


1 Introduction
During the last ten years or more there has been a pervasive global trend across all financial services sectors towards the use of more market-based, quantitative and probabilistic measures of risk, capital and value for the purposes of financial reporting and regulatory capital assessment. Major regulatory developments such as Basel II/III in the banking sector and Solvency II in the insurance sector are prime examples. The Defined Benefit Pension sector has similarly experienced a number of developments in recent years that have moved the assessment of DB pension fund liabilities and their funding in this direction, albeit to a more limited degree than has occurred in insurance and banking.
A recent initiativeFootnote 1 by the European Insurance and Occupational Pension Authority (EIOPA) could pave the way for a significantly more quantitative and market-based approach to the assessment of the funding adequacy of the European Union's Defined Benefit pension funds. This initiative could provide greater consistency between the treatment of equivalent obligations that can arise in policies written by insurance companies such as fixed and deferred annuities and in the promises made to Defined Benefit pension fund members. With the bulk of DB pension funds now closed and with liability structures that are increasingly convergent with those of annuity-writing life insurers, such consistency has attractions. It may provide greater transparency on the comparable levels of security of similar assets that the public own in the form of insurance policies and accrued pension fund benefits. And for the UK actuarial profession, it may provide a means for developing their understanding of how some of the quantitative and market-based risk management expertise developed in the insurance sector over the last ten years can be applied to risk management of DB pension funds.
Whilst the liabilities of closed DB pension funds increasingly resemble the simpler types of life insurance liabilities, more complex issues can arise on the asset side of a DB pension balance sheet. This is particularly the case for pension funds that are currently significantly under-funded on a mark-to-market basis, i.e. where the market value of the pension fund's asset portfolio is significantly lower than the present value of the promised liability cashflows when discounted at risk-free interest rates. In this circumstance, the pension fund sponsor's commitment to make good on any shortfall that ultimately arises in the delivery of the pension promises can be regarded as a significant asset on the ‘holistic balance sheet’ of the pension fund. If we assume the sponsor will make good on their commitment except when they are unable to as a result of corporate insolvency, this asset, often referred to as the sponsor covenant, can be considered as a form of corporate debt owned by the pension fund.
The EIOPA proposals place the market-consistent valuation of the pension fund's assets (including the sponsor covenant) and liabilities at the centre of the quantitative assessment. Determining a market-consistent value for the sponsor covenant can be significantly more complicated than the mark-to-market valuation of the sponsor's other corporate debt. This is primarily because the amount that is owed by the sponsor at the time of default is generally unknown: pension funds will typically have significant market, interest rate and longevity risks that make the ultimate ability of the existing asset portfolio to fund the liability cashflows uncertain. Put another way, in the scenario where the corporate sponsor defaults, the shortfall (if any) suffered by the pension fund is not a pre-defined, fixed quantity. Furthermore, the economic scenarios that result in corporate default may also typically result in higher-than-average pension fund deficits. So the very times at which the sponsor covenant is most required may also be the times when it is least secure. Developing market-consistent valuation methods to rigorously account for such features will generally be significantly more complex than valuing a fixed stream of corporate debt cashflows.
This paper discusses how a market-consistent valuation of the sponsor covenant can be undertaken. Section 2 provides a general overview of the valuation problem, and introduces a Monte Carlo simulation framework for the valuation of the sponsor covenant. Several case studies are provided to illustrate the valuation dynamics produced by the method. Section 3 develops simpler, faster calculations that aim to approximate the full valuation methodology set out in Section 2. Again, case studies are used to illustrate the accuracy and reliability of the approximation methods across a range of circumstances. Section 4 moves beyond the valuation problem and considers how the market-consistent pension fund balance sheet can be used to assess risk-based capital requirements. As per the EIOPA proposals, a 99.5% 1-year Value-at-Risk framework similar to Solvency II is considered. The risk management incentives generated by such a capital assessment framework are also discussed in this section. Finally, section 5 sets out the paper's conclusions.
2 Market-consistent valuation of the sponsor covenant – Developing a general method
This section develops a general methodology for the market-consistent valuation of the sponsor covenant. This valuation approach intends to accurately capture the impact of complex pension fund circumstances on the market-consistent valuation such as:
• The diverse range of asset strategies that may be in place in DB pension funds, including dynamic asset re-balancing and de-risking
• Dynamic and path-dependent deficit contribution commitments
• Correlation between sponsor default and returns on the pension fund's asset portfolio
• The lack of a publicly available assessment of the credit quality of the employer
A general valuation methodology that can accurately capture the full range of possible circumstances arising in the above areas is likely to require a Monte-Carlo simulation framework. This framework could have many similarities to the one used in the insurance sector in its market-consistent valuation of asset-contingent liabilities, for example in the Technical Provisions valuation element of Solvency II. This below discusses how this type of framework could be applied in the specific context of DB pension funds.
2.1 The key elements of the valuation calculation
The valuation of the sponsor covenant requires a description of the behaviour of three key modelling elements:
1. When is the sponsor unable to make good on the commitment to fund any shortfall in the pension fund? The valuation approach developed below assumes that this occurs whenever corporate default occurs, and only occurs in that circumstance
2. What is the size of the pension fund deficit (if any) when corporate sponsor default occurs? In the valuation method below, we assume this is the pension fund deficit on a market-consistent basis, i.e. the difference between the present value of the promised liability cashflows when discounted at risk-free rates, less the market value of the pension fund's asset portfolio (subject to a minimum of zero). The pension fund deficit at a given point in time will depend on modelling assumptions about how asset strategy is managed and how contributions are paid between the valuation date and that point, as well as the fund's financial market, economic and longevity experience up to that point
3. In the event of default, what proportion of the deficit (if any) is recovered from the sponsor?
Each of these elements of the valuation calculation is discussed in further detail below. An important point to note in the below discussion is that we are aiming to develop a market-consistent valuation of the sponsor covenant. That means that our best estimates of the answers to the above questions are not necessarily relevant. Rather, we are fundamentally interested in understanding what observable market prices can tell us about how the market would price cashflows that are a function of these variables. These prices will be impacted by both the expectations for future cashflows and the risk premium required for bearing the risk associated with those cashflows, but the market-consistent valuation does not require us to make this de-composition. As a result, it is usually convenient to express the expectations and discount rates implicit in a given market price by making the assumption that investors are risk-neutral (i.e. the risk premiums do not exist). This doesn't mean the valuation is wrong if investors really are risk-averse. It is just a convenient way of doing the valuation maths, using the insight that we don't need to know the market's degree of risk aversion in order to calculate a market-consistent valuation - we just need to know the market prices we want to be consistent with.
2.2 Assessing the market-consistent cost of the credit risk associated with the sponsor covenant
The market-consistent valuation of the sponsor covenant requires a market-based estimate of the probability of sponsor default across all possible future circumstances that may arise over the period in which deficit contributions may be paid. It will generally be important to capture how the sponsor default probability may vary in different financial environments. For example, the sponsor default probability may be higher in circumstances such as an economic depression. The measurement of the impact of credit risk on the sponsor covenant valuation may be quite sensitive to these assumptions as the promised deficit contributions implicit in the sponsor covenant may be greatest in such difficult economic environments.
2.2.1 Sponsors with traded corporate debt
For firms that have traded corporate debt, a market-implied (risk-neutral) default rate can be derived from the market price of the debt. However, even with this observable market price of debt and the assumption that corporate debt default and deficit contribution default always occur jointly, there are still several practical issues to consider in implementing the default risk assumptions required for the valuation model. These are discussed further below.
The derivation of the risk-neutral default probability requires an assumption about the loss that the corporate debt-holder experiences when default occurs. This is expressed as a percentage of the promised payments and is known as the Loss Given Default (LGD). Alternatively, market practitioners may refer to the Recovery Rate, which is simply (1- LGD). Empirical data suggests typical recovery rates of 35%–40% of the promised amount are experienced when unsecured corporate debt defaultsFootnote 2.
A term structure of default probabilities may be required that exceeds the observable corporate bond yield term structure of the employer. The sponsor covenant may entail deficit contributions being paid over many years or even decades. Valuation of the covenant therefore requires estimation of market-consistent default probabilities for each year that deficit contributions may be payable under the covenant. But the market prices from which these default probabilities are derived may only be observable for a limited term of corporate debt, and so the longer-term default probabilities need to be ‘extrapolated’ from the observable market prices.
This extrapolation problem is not unique to estimating the market-consistent cost of credit default risk – it is a recurring theme in the market-consistent valuation of long-term insurance liabilities. For example, the issue of extrapolation of risk-free interest rates for the purposes of market-consistent valuation of long-term insurance liabilities has been a topic of significant debate in the development of the Solvency II frameworkFootnote 3. Such extrapolation problems can generally be described in three components: what is the longest reliable market price that can be observed? What ultra long-term assumption should be used? How should these two points be joined up? All three of these components of the extrapolation process may involve some subjectivity. Arguably, this issue is less important in the context of credit default probabilities for sponsor covenants, as most sponsors’ deficit contribution plans will be measured over periods of several years rather than several decades.
A worked example will be useful to illustrate how market data can be used to develop the risk-neutral default probabilities that will be crucial inputs into the sponsor covenant valuation process. Figure 1 displays the credit spread term structure implied by Marks & Spencer credit default swaps as at 31st December 2011, as provided by Bloomberg.
Credit Spread Term Structure for Marks & Spencer as derived from Credit Default Swaps at 31/12/11

The above credit spread term structure can be used to derive a term structure for the risk-neutral cumulative default probabilities of the issuer. This requires one further assumption – the Recovery Rate or Loss Given Default that is embedded in the credit default swap pricingFootnote 4. This calculation can be applied whether using market credit spreads derived from credit default swaps or corporate bond prices. Source: Bloomberg
Figure 2 shows the risk-neutral default probabilities implied when we assume a Recovery Rate of 35%, i.e. a Loss Given Default of 65%.
Risk-Neutral Cumulative Default Probabilities for Marks & Spencer as at 31/12/11
As these default probabilities are risk-neutral, they have no direct economic interpretation - it does not imply that market participants’ best estimate of the 10-year cumulative default probability on 31st December 2011 was 37%. However, these probabilities are fundamental parameters for the market-consistent valuation of the credit-risky cashflows promised to Marks & Spencer debt-holders. That is, the calculation tells us that the market price of 10-year credit default risk can be derived from making the joint assumption that the 10-year cumulative default rate was 37% and the corporate debt-holders do not require a risk premium for bearing credit risk. This observation can be used in the market-consistent valuation of other more complex forms of cashflows that are a function of whether or not Marks & Spencer defaults over the next ten years.
A further and important topic naturally arises in the above discussion. In general, any market-consistent valuation process requires a definition of the risk-free interest rate (and its term structure where relevant). Across the financial sector, differences can arise in consideration of what market prices should be used in the specification of the risk-free interest rate. In particular, should government bond prices or interest rate swap rates be used to derive the risk-free interest rates that are fundamental to market-consistent valuation of any given cashflow? This distinction between government bond yields and interest rate swap rates has been especially relevant in recent years, where the difference between the two have been at historical highs in economies where sovereign default risk is viewed as low.
In the context of the sponsor covenant valuation, this assumption can be important. In particular, should the market-consistent default probabilities be derived to be consistent with credit spreads over government bond yields or swap rates? In the above example, the credit spreads have been derived in excess of swap rates. If the default probabilities were derived with reference to the credit spread over government bond yields, the default probabilities would be higher. For example, the 10-year swap spread over UK government bond yields on 31st December 2011 was 0.22%. The 10-year risk-neutral default rate for Marks & Spencer above would increase from 37% to 40% if we used the credit spread over government bonds rather than over swaps. Swap spreads can vary considerably over time and historically it has not been unusual to see swap spreads over 100 basis points. In such circumstances the difference in risk-neutral default probabilities generated by the choice of swaps or government bonds will be significantly greater than in this example.
It should also be noted that the choice of risk-free interest rate will impact on both sides of the DB pension fund holistic balance sheet – a government bond yield basis will result in smaller asset values (sponsor covenant) and larger liabilities (present value of promised pension payments) than an interest rate swap. It is therefore likely to be a fundamentally important assumption in the construction of holistic balance sheets.
Finally, assumptions about how the sponsor default probability varies with economic conditions are required. In particular, the correlation between sponsor default and the size of the deficit is important to the covenant valuation. Put another way, the risk-neutral 1-year default rate for a given employer may be observed to be, say, 1%. But the default rate conditional on equities falling, say, 25%, may be significantly higher.
The size of the deficit is generally a function of two economic variables: the returns of the risky asset portfolio and the behaviour of risk-free interest rates. We can generally assume a very strong correlation between a firm's equity returns and its probability of default (i.e. when the firm defaults, the value of its equity is conditionally expected to be significantly lower than in the circumstance where it has not defaulted). So the correlation of other economic variables with the sponsor default rate can be equivalently considered as their correlation with the sponsor's equity return. This is usually helpful as there will be more relevant data available on the behaviour of firms’ equity returns.
This correlation effect is well-documented both theoretically and empiricallyFootnote 5. Typically market-implied correlation numbers between a single firm's equity return and the broader equity market index will be of the order of +0.5Footnote 6.
2.2.2 Sponsors with no traded corporate debt
Many UK DB pension fund sponsors are smaller firms that do not have market-traded corporate debt. In this case, the market-consistent default modelling is further complicated by the lack of an obvious market price to be consistent with. For such sponsors, it will be necessary to estimate the risk-neutral default probabilities of the sponsor using other market information – most obviously, the market prices of the corporate debt of firms of similar levels of credit worthiness.
Deciding which other firm's corporate debt prices to use in the calibration requires estimation of a sponsor's credit worthiness, which is a generally complex undertaking. A robust estimation would require sophisticated analysis of the sponsor's financial condition and business prospects. This would be a daunting task to perform for the many thousands of small DB pension funds in the UK. Fortunately, there are well-established commercial service providers that deliver such analysis of corporation's default risk: credit ratings agencies. Credit ratings agencies’ ratings provide a standardised way of describing credit default risk, and are provided for both public and private businesses. These ratings are so prevalent that standard market credit spread term structures for different credit ratings will be publically available from market data providers such as Bloomberg. So once we have assigned an estimated credit rating to a sponsor, we have an obvious set of reference market prices to use in deriving the market-consistent risk-neutral default probabilities.
The breadth of publically available ratings-based spread curves means that this ratings-based approach can be implemented to varying degrees of granularity – for example, a B-rated sponsor in the energy sector could be proxied by using the general B-rated credit spread curve, or the energy sector-specific public credit spread curve could be used as the reference set of credit-risky prices.
It can also be noted that the UK Pension Protection Fund (PPF) has experience of building an internal model that includes estimation of the credit riskiness of the sponsors of all eligible occupational pension funds, and recently published a paper describing their methodologyFootnote 7. Whilst the PPF internal model does not attempt to perform market-consistent valuation of sponsor covenants, it does require sponsor-specific credit risk estimates and their paper describes how it uses a credit ratings-based approach to categorise the level of sponsor risk.
2.3 Estimating the Pension Fund's Sponsor Recovery Rate
Section 2.1 described how a key assumption required for the sponsor covenant valuation is the amount assumed to be recoverable from the sponsor in the event of a default. Like estimation of the sponsor default probability, this calculation may appear a daunting task: it requires an estimation of the total recoverable assets that will typically be available in the event of a future default, and an assumption about the total amount of debt owed by the sponsor and where the pension fund ranks in the list of creditors. However, there is again a considerable amount of empirical evidence of corporate recovery rates that can be useful in this context. As mentioned in section 2.2, the long-term empirical recovery rate on unsecured corporate debt has been around 35%–40%. Generally, the deficits of UK DB pension funds are treated as a form of unsecured debt and have a similar rank to other unsecured creditors. The empirical corporate recovery rate on unsecured debt is therefore likely to be a sensible starting point for the sponsor covenant recovery rate assumption.
Some adjustments could be made to this rate. For example, there may be some variation in recovery rates by the industrial sector of the sponsor (sectors with significant tangible assets may be expected to provide higher recovery rates than sectors with a large proportion of intangible assets).
Clearly the above assumption should only be applied to the deficit arising after allowing for all assets already owned by the pension fund. If the pension fund has more complex credit arrangements with the sponsor such as contingent assets, these would be allowed for directly in the valuation of pension fund assets and the unsecured debt recovery rate would be applied to the residual deficit.
2.4 Simulation modelling for the projection of the DB pension fund deficit
The sponsor's deficit contribution commitment may imply a series of promised cashflows that arise over a long period of time and whose values are a function of the future values obtained by the pension fund's assets and liabilities. For example, the employer may commit to revising the deficit contribution schedule upwards in the future in the event that there is an increase in the pension fund deficit, and that revision of the contributions may take a stipulated form (e.g. the deficit contribution level may be set by targeting a reduction in the deficit to zero over a period of 5 years, assuming assets earn a specified expected return). In these circumstances, some form of stochastic model of the future behaviour of the pension fund assets and liabilities will be required in order to assess what deficit contributions are promised in what circumstances, and hence what is the current value of this promise.
The complexities of deficit-contingent contribution paths and correlated sponsor default behaviour make Monte Carlo simulation a natural implementation framework for the stochastic modelling. It will generally be difficult to develop analytical valuation solutions that can accurately accommodate these complexities, whereas a simulation approach to valuation is highly flexible. For this reason it has become the standard methodology used in the market-consistent valuation of complex insurance liabilities in the context of Solvency II and its precursors.
Again note that the simulation model will not be used in this context to establish realistic projections or probability estimates for future events. Its only purpose is to perform a market-consistent valuation of the sponsor covenant. This means that the model does not require any best estimate view of the probability of a particular event occurring in the future; the probabilities will be derived as much as possible from observable market instruments. As discussed in sections 2.1 and 2.2, it is most convenient to use the risk-neutral probability measure for this purpose.
The simulation model of the future behaviour of the pension fund assets and liabilities is generally required to have the following properties to be fit for the purpose of the sponsor covenant valuation:
1. An arbitrage-free risk-neutral simulation model for the joint behaviour of the various material risk factors that drive asset and liability behaviour over the deficit contribution payment horizon. These risk factors are likely to include equity returns, real estate returns, corporate bond returns, nominal yield curves, real yield curves, inflation, sponsor default and perhaps other market risk factors such as exchange rates and alternative asset returns. Material liability-side risk factors may include longevity risk, real salary inflation and perhaps the behaviour of deferred members (for example, their propensity to take cash settlements in exchange for their pension promises).
2. Modelling assumptions for current asset strategy and how that strategy will evolve over time across all possible future scenarios. This will include any dynamic de-risking strategies and assumptions around net cashflow re-investment.
3. If the deficit contribution schedule is a function of a liability valuation (or the size of the deficit), then the liability valuation basis and the valuation calculation will need to be modelled. An algorithm to describe the behaviour of the deficit contributions is required and this is discussed further in section 2.4.1.
From a modelling perspective, the first of these three requirements is the most technically complex (particularly given the model will be calibrated to relevant market prices in order to be used in a market-consistent valuation). This paper will not catalogue the full range of stochastic asset modelling choices available for these purposes and sections 2.5 and 2.6 will present some case study valuations that will use example model specifications. However, two general observations can be made in this discussion:
• This requirement is fundamentally similar to the modelling required in market-consistent valuation of insurance Technical Provisions in Solvency II and its UK precursor, the Realistic Balance Sheet, and hence UK actuaries have developed considerable experience and expertise in this field over the last ten years;
• Secondly, the process of developing market-consistent model calibrations for the purposes of valuation of long-term, illiquid liabilities inevitably involves expert judgement as the set of market prices that are theoretically required to perform ‘mark-to-market’ for these liabilities are not observable.
2.4.1 Modelling the promised deficit contribution schedule
The valuation of the employer covenant requires a description of what deficit contributions will be paid when in all possible future circumstances. This valuation process can be considered in two components: modelling the behaviour of the promised deficit contribution; and modelling the employer's ability to carry through with their promises (credit default risk). Or, put another way, the sponsor covenant valuation requires a projection of the contributions paid up to the point of default, and an assumption about what will be paid at the point of default.
It may often be possible for the promised deficit contribution assumption to be based on existing deficit contribution arrangements that exist between an employer and the pension fund. A typical arrangement could be that every three years the deficit contribution level for the next three years is set based on the level of the deficit at that point in time and a target horizon for funding the deficit shortfall. This type of arrangement could be easily modelled within the risk-neutral simulation framework. As will be seen in the examples in section 2.5 and particularly 2.6, the simulation framework provides virtually unlimited flexibility in what form of contribution pattern can be valued in the sponsor covenant valuation.
This type of flexible modelling framework may create an incentive for the sponsor to ‘assume risk away’ by encouraging unrealistic assumptions about the scale and pattern of future deficit contributions in the valuation exercise. It will generally be necessary to ensure that what is assumed in the model is an accurate representation of the ‘real-life’ behaviour of the employer. A similar issue arises in insurance valuation, where the current valuation of contingent liabilities can be highly sensitive to assumed future management actions. For example, in recent years UK with-profit funds developed a Principles and Practices of Financial Management document that had a number of uses including providing statements of future management actions that the regulatory capital assessment's valuation modelling had to be consistent with. Similarly, Solvency II requires a number of criteria to be met by the future management action assumptions used in the valuation such as verifiability and realism before the assumptions can be incorporated into the valuation modelFootnote 8.
2.5 Single-period examples
This section will develop some example case studies that can be used to illustrate the application of the above principles to sponsor covenant valuation. The section starts with the simplest of cases and then incrementally introduces more complexity to the examples.
2.5.1 Risk-free sponsor and no asset risk
We begin with the simplest possible example. This trivial case may appear of limited value, but it will provide a useful ‘baseline’ result that can allow us to measure how increasing complexity impacts on the valuation. The example assumes:
• The pension fund has a portfolio of assets that have a market value of 90 today.
• The pension fund liability consists of a single liability cashflow of 100 that is fixed and certain and is due in 1 year.
• The sponsor has committed to paying a contribution at the point the liability cashflow falls due if the pension fund assets are not sufficient to fully pay the liability cashflow. There is no credit risk associated with this sponsor commitment, i.e. it is assumed to be certain that the sponsor will pay any required deficit contribution at the end of the year.
• The pension fund assets are invested in a 1-year risk-free zero-coupon bond.
• The 1-year risk-free interest rate is 2% (annually compounded).
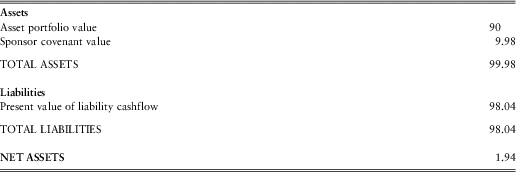
Under the above assumptions, the end-year asset portfolio value (before any required deficit contribution) is certain to be 91.8. The end-year pension fund deficit is therefore certain to be 100 − 91.8 = 8.2. The market-consistent value of this risk-free cashflow is simply found by discounting the cashflow by the risk-free interest rate, giving a value of 8.04.
Similarly, the current market-consistent value of the pension fund liability is simply found by discounting the 1-year certain cashflow of 100 at the risk-free interest rate of 2% to give a value of 98.04.
This market-consistent balance sheet of the pension fund is presented in table 1.
Market-consistent balance sheet of pension fund (risk-free sponsor, no asset risk)
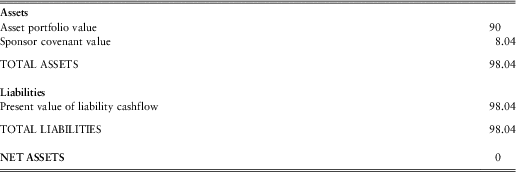
In this example, the total end-year value of assets (asset portfolio + deficit contribution) always exactly equals the value of the end-year liability cashflow: there is no circumstance in which there is an excess or shortfall of assets (gross of the required contribution) less liabilities. The obvious result is obtained: the current market-consistent values of assets and liabilities are equal.
2.5.2 Risk-free sponsor and a risky asset portfolio
We now introduce the first element of complexity to the above case. It is assumed that the end-year asset value is no longer invested in a risk-free portfolio but is invested in a portfolio of risky assets. For the purposes of the example, it is assumed that the end-year asset portfolio value is lognormally distributed with a volatility of 15%. As we are working with risk-neutral probabilities, the expected return of the risky asset portfolio is not required and it can be assumed that the portfolio has an expected return equal to the risk-free return.
The assumption that the sponsor commitment is default risk-free is retained. That is, the sponsor has committed to paying a contribution at the point the liability cashflow falls due, if the pension fund assets are not sufficient to fully pay the liability cashflow. There is no credit risk associated with this sponsor commitment, i.e. it is assumed to be certain that the sponsor will pay any required deficit contribution at the end of the year.
In this example, the sponsor commitment can be described in the following statement:
If the end-year pension fund asset value exceeds 100, pay zero; if the end-year pension fund asset value is less than 100, pay (100 − asset value).
This statement is a pay-out function of a 1-year put option on the value of the assets with a strike price of 100 and a current asset price of 90. Under our assumption that the end-year asset portfolio value is lognormally distributed, the sponsor covenant can be valued using the standard Black-Scholes formula. This calculation produces a current value for the sponsor covenant of 10.53. Note the value of the sponsor covenant has increased by 2.3 from the value in the previous case. This is reasonably intuitive and there are two (related) drivers of this increase in market-consistent value:
1. The variability in the end-year asset portfolio value means that the sponsor's commitment could now require a payment of any value between 0 and 100. The average value of the required sponsor cashflow will therefore be higher, even after allowing for an increase in expected return of the pension fund assets.
2. From a market-consistent valuation perspective, the valuation of the large contribution cashflows will tend to be disproportionately more costly than the (real-world) probability that is attached to them. This is because their replication cost is greatest (it requires a greater asset investment at time 0 to finance a cashflow shortfall at time 1 that arises after a fall in the value of assets).
The new market-consistent balance sheet is set out in table 2:
Market-consistent balance sheet of pension fund (risk-free sponsor, risky asset portfolio)
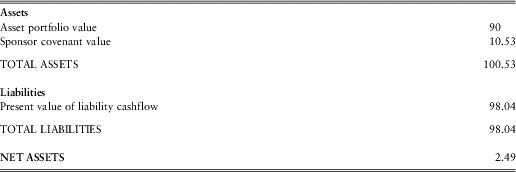
The balance sheet now has a positive net asset value. The source of this surplus is again intuitive: in this example, there are no scenarios where the end-year total assets (inclusive of the contribution) will be less than the liability cashflow (as there is no sponsor default risk in this example); but there are scenarios where the (risky) asset portfolio has an end-year portfolio value that exceeds the fixed liability cashflow of 100. Note this has made the important assumption that any terminal surplus of the pension fund is not distributed to pension fund members and hence is not included as a component of the pension fund liability value. Under this assumption, the end-year net asset value of the pension fund can be written as:
If asset portfolio is less than 100, net asset value equals zero; if asset portfolio is greater than 100, net asset value equals (asset portfolio − 100).
The above statement is the pay-out function of a 1-year call option with a strike price of 100 (and an underlying asset price of the current asset portfolio value of 90). We again use the standard Black-Scholes formula to value this call option, and the Black-Scholes calculation does indeed produce a value of 2.49. This simple case is an example of put-call parity.
Note we have made no assumptions in the construction of the balance sheet about where any surplus assets go in the event that an end-year surplus exists, other than that it does not need to be considered as a form of liability to the pension fund members. If there was an obligation to distribute this ‘trapped surplus’ to pension fund members, it could be considered as a component of the liability and in this case the net asset value would equal zero in all cases.
Figure 3 shows how the market-consistent value of the sponsor covenant varies as a function of the starting asset portfolio in our two examples.
Value of Sponsor Covenant as a function of starting asset portfolio value
The above chart is merely showing the difference between the intrinsic value and total value of a put option on a risky asset. But it highlights some basic insights that are germane to the sponsor covenant valuation subject:
• The sponsor covenant increases in value as the pension fund deficit increases (prior to allowing for any sponsor credit risk).
• Increases in asset portfolio risk will generally result in an increase in the value of the sponsor covenant (prior to allowing for any sponsor credit risk).
• When the pension fund has a very large surplus or deficit, the asset portfolio strategy (and its volatility) will not have a major impact on the value of the sponsor covenant; rather, the asset portfolio risk will have the most significant impact on the sponsor covenant valuation when the pension fund's funding level is around 100%.
2.5.3 Credit-risky sponsor and no asset risk
The next two cases develop the single-period example to address the crux of the valuation problem: how to allow for the impact of sponsor credit risk in the valuation of the sponsor covenant. We first consider the case where the asset portfolio is risk-free (as per the 2.5.1 case). However, it is no longer assumed that the sponsor's ability to meet the required deficit contribution is certain. Instead, the following assumptions are used:
• The sponsor's corporate bonds are traded and the credit spread of the 1-year corporate bond over the 1-year risk-free interest rate is 3%. The market assumes a 30% recovery rate in the pricing of the corporate bond (i.e. in the event of default, the bond will pay 30% of the promised amount at the end of the year). This is sometimes referred to as a 70% Loss Given Default assumption.
• It is assumed that the sponsor will fully pay any required contribution in scenarios where it does not default on its 1-year corporate bond. And that in the scenarios where it does default on its 1-year corporate debt, the sponsor will pay 30% of any required contribution.
Section 2.5.1 showed that the required end-year deficit contribution is a fixed amount of 8.20. However, the valuation of this cashflow must now take into account the impact that default risk has on the market-consistent valuation of the sponsor covenant. This can be done by assessing the sponsor covenant valuation conditional on default occurring or not, and then applying market-consistent (risk-neutral) probabilities to those values.
We know from section 2.5.1 that the value of the sponsor covenant conditional on no default occurring is 8.04. In the event of default, the sponsor is assumed to pay 30% of the promised contribution. The value conditional on default is therefore 30% of 8.04 = 2.41.
To complete the calculation, the risk-neutral default probability is required. In a risk-neutral setting, the expected default loss of the corporate must equal the credit spread implicit in the bond price. The expected default loss is the multiple of the probability of default (PD) and the loss given default (LGD). The LGD has been assumed to be 70%. The credit spread has been observed in the market at 3%. The risk-neutral 1-year PD is therefore 3%/70% = 0.043.
The value of the sponsor covenant can therefore be calculated as:
 $${{\rm{(1 - PD)}}\,\times \,{\rm{Value}}\,{\rm{given}}\,{\rm{no}}\,{\rm{default}}\, + \,{\rm{PD}}\,\times \,{\rm{Value}}\,{\rm{given}}\,{\rm{default}} \cr {\rm{(1 - 0}}{\rm{.043)}}\,\times \,{\rm{8}}{\rm{.04}}\, + \,{\rm{0}}{\rm{.957}}\,\times \,{\rm{2}}{\rm{.41}}\, = \,{\bf {{7}}}{\bf {{.80}}} $$
The market-consistent balance sheet applicable in this case is set out in table 3. It shows that, after allowing for sponsor default risk and its impact on the market-consistent value of the sponsor covenant, the total asset value of the balance sheet is now lower than the market-consistent liability value.
Market-consistent balance sheet of pension fund (credit-risky sponsor, risk-free portfolio)
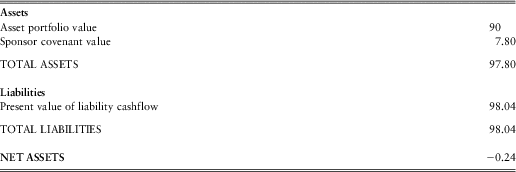
You may note that the reduction in value of the sponsor covenant from 8.02 to 7.80 is exactly 3% of the value of the no-default value. It is no coincidence that this reduction in value is equal to the assumed size of the credit spread. If we assume that the LGD or recovery rate applicable for the pension fund is the same as experienced by a corporate bondholder, then the recovery rate/LGD assumption cancels out of the calculation. In particular, we can note that:
 $${\rm{PD}}\, = \,{\rm{Credit}}\,{\rm{Spread}}\,{\rm{/}}\,{\rm{LGD}}$$
and
 $${\rm{Value}}\,{\rm{given}}\,{\rm{default}}\, = \,{\rm{Value}}\,{\rm{given}}\,{\rm{no}}\,{\rm{default}}\,\times \,{\rm{LGD}}$$
Equations 2.2 and 2.3 can be substituted into 2.1 to obtain the relationship:
 $${\rm{Value}}\,{\rm{of}}\,{\rm{sponsor}}\,{\rm{commitment}}\, = \,{\rm{Value}}\,{\rm{given}}\,{\rm{no}}\,{\rm{default}}\,\times \,{\rm{(1}}\,{\rm{ - }}\,{\rm{Credit}}\,{\rm{Spread)}}$$
This is a useful result as the LGD assumption is generally not directly observable from corporate bond prices, and so removing the need to estimate it is helpful. As discussed in section 2.3, we think that the assumption that the LGD on a sponsor's corporate bonds and the sponsor covenant will generally be reasonable.
2.5.4 Credit-risky sponsor and a risky asset portfolio
We now turn to the most complex single-period example: valuing the sponsor covenant in the presence of both sponsor credit risk and asset portfolio risk. In the example, the same asset portfolio risk assumptions as in 2.5.2 above are used – the end-year asset portfolio value is assumed to be lognormally distributed with a proportional volatility of 15%. The sponsor's commitment is again the same as in 2.5.2:
If the end-year pension fund asset value exceeds 100, pay zero; if end-year pension fund asset value is less than 100, pay (100 − asset value).
To incorporate sponsor credit risk into the valuation, we now need to solve the valuation equation:
 $$no{{\rm{Value}}\, = \,{\rm{E \ [max}}\,{\rm{(0,}}\,{\rm{100}}\,{\rm{ - }}\,{\rm{asset}}\,{\rm{value)}}\ {\rm{given}}\,{\rm{No}}\,{\rm{Default]}}{\rm{.}}\,{\rm{Prob}}\,{\rm{(no}}\,{\rm{Default)}}\, \cr + \,{\rm{E}}\,{\rm{[max}}\,{\rm{(0,}}\,{\rm{100}}\,{\rm{ - }}\,{\rm{asset}}\,{\rm{value)}} \\ \ {\rm{given}}\,{\rm{default]}}{\rm{.}}\,{\rm{Prob}}\,{\rm{(Default)]\, \ast\,(1 - LGD)]}}\,{\rm{/}}\,{\rm{(1}}\, + \,{\rm{r)}}$$
where expectations are taken in the risk-neutral measure.
If we assume that the change in the asset portfolio value is statistically uncorrelated with sponsor default, then this function simply becomes:
 $${\rm{Value}}\, = \,{\rm{E[max\ (0,}}\,{\rm{100 - asset}}\,{\rm{value)]}}{\rm{.[Prob\ (no}}\,{\rm{Default)}}\, + \,{\rm{Prob\ (Default)\,\ast\,(1 - LGD)]}}\,{\rm{/}}\,{\rm{(1}}\, + \,{\rm{r)}}$$
Noting that:
 $${\rm{Prob}}\,{\rm{(No}}\,{\rm{Default)}}\, + \,{\rm{Prob\ (Default)}}\,{\rm{\ast}}\,{\rm{(1 - LGD)}}\, = \,{\rm{1}}\,{\rm{ - }}\,{\rm{Credit}}\,{\rm{Spread}}$$
and
E [max (0, 100 − asset value)/(1+r) is the Black-Scholes value obtained in 2.5.2, the following result is obtained:
Sponsor Covenant Value (with credit risk and asset portfolio risk) = (1 − Credit Spread).Sponsor Covent Value (no credit risk, with asset portfolio risk)
So this result is consistent with 2.5.3, i.e. the value in the presence of sponsor default risk is simply the value in the absence of sponsor default risk multiplied by a factor of (1 − Credit Spread).
Continuing with the numbers assumed in our examples above, this means that the sponsor covenant value is (1 − 0.03) × 10.53 = 10.21. The impacts of the asset portfolio risk (increasing the sponsor covenant value) and the sponsor credit risk (reducing the value) are largely offsetting – this valuation is quite similar to the value produced under the risk-free sponsor/risk-free portfolio case of section 2.5.1 (value of 10.53).
The updated market-consistent balance sheet is given in table 4.
Market-consistent balance sheet of pension fund (credit-risky sponsor, risky asset portfolio, no correlation)
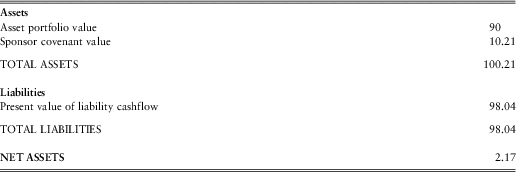
This result only applies under the assumption that sponsor default risk and the asset portfolio risk are statistically uncorrelated. As discussed in section 2.2, generally, sponsor default and the asset portfolio value will be correlated – a general economic shock could be expected to impact on both general financial market prices and the likelihood of the sponsor being able to re-pay its corporate debt. Assuming a non-zero correlation between the sponsor default event and the asset portfolio value creates the requirement to find the two conditional expectations in equation 2.5:
 $${\rm{E\ [max\ (0,}}\,{\rm{100}}\,{\rm{ - }}\,{\rm{asset}}\,{\rm{value)}}\ {\rm{given}}\,{\rm{No}}\,{\rm{Default]}}$$
and
 $${\rm{E\ [max\ (0,}}\,{\rm{100}}\,{\rm{ - }}\,{\rm{asset}}\,{\rm{value)}}\ {\rm{given}}\,{\rm{Default]}}$$
No exact analytical solutions are available for the above expectations, even in this relatively simple single-period example. However, a numerical approximation is readily obtainableFootnote 9. As discussed earlier, Monte-Carlo simulation has emerged as the standard actuarial methodology for valuation of complex liabilities in insurance and is also a natural choice for this challenge of valuing the complex pension fund asset that arises in the form of the sponsor covenant. This is a natural point to introduce a simulation approach to the valuation problem.
It is fairly straightforward to build a simulation model of the above asset and default dynamics. In the results below, 25,000 1-year market-consistent simulations of the asset portfolio value and sponsor default event were produced using an Excel spreadsheet. The following algorithms were used in the modelling:
 $${{\rm{End{\hbox-}year}}\,{\rm{Asset}}\,{\rm{Portfolio}}\,{\rm{Value}}\, = \,{\rm{Start {\hbox-} Year}}\,{\rm{Value}}\,\times \,{\rm{(1}}\, + \,{\rm{risk{\hbox-}free}}\,{\rm{rate)}}\, \cr \times \,{\rm{exp( - \,{\vskip-2pt\hskip1\hat}\!\sigma \,2/2}}\, + \,{\rm{\sigma }}{\rm{.}}{{{\rm{z}}}_{\rm{1}}}{\rm{)}} $$
Sponsor default occurs if z2 < Default Probability
 $${{{\rm{z}}}_{\rm{2}}}\, = \,\rho {{{\rm{z}}}_{\rm{1}}}\, + \,{\rm{sqrt(1}}\,{\rm{ - }}\,{{\rho }^{\rm{2}}} {\rm{)}}{\rm{.}}{{{\rm{z}}}_{\rm{3}}}$$
where σ is the assumed 1-year standard deviation of the asset portfolio total return, and ρ is the correlation between the asset portfolio total return and the sponsor default.
z1 and z3 are independent standard normal variables that were sampled using the inverse normal function of a uniform random variable (produced using the rand() Excel function). This approach to random number generation is not sufficiently robust for industrial applications, but has sufficient accuracy for this simple simulation problem.
Figure 4 shows the valuation results that are obtained under different assumptions for the correlation between the asset portfolio value and sponsor default. A high correlation means that more defaults occur when the asset portfolio value falls. As a result, the average size of the deficit that arises when default occurs increases as the strength of the correlation increases. This increases the credit risk of the sponsor commitment and reduces its value. The chart also shows that the sponsor support value tends towards the risk-free value as the correlation approaches −1Footnote 10.
Value of Sponsor Commitment as a function of correlation between asset portfolio value and sponsor default
End-December 2011 UK Government Bond Spot Yield Curve
In practice, we would generally expect positive correlation between the asset portfolio value and sponsor default risk factors in the above model specification. As described in section 2.2, an assumption of around 0.5 is typically used in the joint modelling of a diversified equity index and the single-name exposure that drives the default event. At these levels of correlation, the impact of non-zero correlation is fairly modest in our example: it reduces the market-consistent value of the sponsor covenant by 1%–2.5%.
And finally, the market-consistent balance sheet with a asset portfolio/sponsor default risk correlation of +0.5 is given in table 5.
Market-consistent balance sheet of pension fund (credit-risky sponsor, risky asset portfolio, 0.5 correlation)
2.5.5 Summary of results obtained from the single-period examples
These simple single-period examples have produced some intuitive results. To recap, we have found that:
• In the absence of sponsor credit risk, asset portfolio risk or liability cashflow risk, the value of the sponsor covenant is simply equal to the current market-consistent deficit (and zero if the pension fund asset portfolio market value exceeds the market-consistent liability present value);
• With sponsor credit risk and no asset or liability risk, the value of the sponsor covenant is the credit risk-free valuation, multiplied by a factor of (1 − Credit Spread). This assumes the Loss Given Default for the sponsor commitment is the same percentage value as the Loss Given Default for the sponsor's corporate bonds.
• With no sponsor credit risk, the presence of asset portfolio risk transforms the sponsor covenant into a put option on the value of the assets. This means that increases in asset portfolio risk will increase the value of the sponsor covenant. This impact will be greatest when the pension fund is close to 100% funded on a market-consistent valuation basis. Under suitable assumptions about the asset portfolio value behaviour, we can value this option using the standard Black-Scholes formula.
• If we assume that sponsor credit default risk and asset portfolio risk are statistically uncorrelated, we again obtain the result that the sponsor commitment value in the presence of sponsor credit risk is simply the sponsor commitment value in the absence of sponsor credit risk multiplied by a factor of (1 − Credit Spread).
• Positive correlation between the asset portfolio value and the sponsor's credit quality increases the credit riskiness of the sponsor covenant and reduces its market-consistent value.
2.6 Multi-period examples
The single-period examples provided a gentle introduction to the covenant valuation problem, giving some general insights into the behaviour of the covenant valuation and the assumptions required in the valuation process. In the simple examples, analytical valuation formulae could be derived. But in the more complex case where both asset portfolio risk and sponsor default risk was assumed to be present, an analytical solution to the valuation was not available. This will generally also be true in the more complex world of multi-timestep modelling.
Accurate analytical solutions to the valuation will be particularly difficult find when the valuation aims to allow for the more complex real-life features that can impact on the valuation: the sponsor covenant may take the form of a set of contribution cashflows that spans many years or even decades; where the size of the contribution cashflows is a function of the path that the pension fund deficit takes over that period; the asset strategy of the pension fund may also vary over the course of time as a function of how financial market and pension fund metrics behave over time. These real-life complexities make it very challenging to develop accurate analytical functions for the market-consistent valuation of the sponsor commitment. Section 3 of this paper will examine how closed-form approximation formulae for the valuation can be derived, but we first develop a more general framework for the accurate valuation of any form of sponsor covenant.
This type of complex path-dependent valuation problem is well-suited to Monte-Carlo simulation. However, the simulation modelling requirements for the multi-period problem are more demanding than the single-period model. In particular, we will need a market-consistent asset and economic model that can generate arbitrage-free joint paths for risk factors rather than single-period values. The simplicity of the single-period modelling requirement also allowed us to ignore explicit modelling of stochastic changes in interest rates. But the more general multi-time step problem will likely require an explicit model of the yield curve – in order to calculate bond returns and to project future levels of pension fund deficits and calculate the actions that follow it (such as changes in asset strategy and the level of the contribution commitment). Again, note that the market-consistent valuation requirement means that the model must be risk-neutral and arbitrage-free. This necessarily introduces some difficult mathematics. There is a rich history of published research in arbitrage-free yield curve modelling that is used to value financial market instruments (and indeed to value complex insurance liabilities), but the construction of these models inevitably involves some complex mathematics.
Section 2.6.1 sets out the underlying stochastic model that will be used in this section's multi-period examples. These model choices are merely examples – a wide range of interest rate models, equity return models and credit default models could be used for this market-consistent valuation purpose. The key requirement is that the models can be adequately calibrated to the market prices that the covenant valuation is intended to be consistent with.
2.6.1 The risk-neutral simulation model for interest rates, asset portfolio returns and sponsor credit quality
In the stylised examples below, we include three key sources of risk in the market-consistent modelling:
1. The risk-free yield curve. We will assume this yield curve is used to value expected pension fund liability cashflows, and to value risk-free bonds that are included in the pension fund's asset portfolio. For the purposes of this example, we will use a commonly known stochastic yield curve model – the Black-Karasinski modelFootnote 11.
2. The risky asset portfolio. The portion of the pension fund asset portfolio that is not invested in risk-free bonds is modelled as a single risky asset portfolio using a lognormal total return model.
3. The sponsor credit risk. We will use a credit rating-based approach to simulating the behaviour of the sponsor credit risk.
This clearly is not an exhaustive list of the risk exposures of pension funds. Inflation risk and longevity risk are other obvious risk factors that could be incorporated into the sponsor covenant valuation process. However, for the purposes of developing illustrative examples, these three risk factors will provide a useful starting point.
Again note the requirement here is for risk-neutral joint paths for the above variables to be generated – so the implementation of the above modelling components will be in a risk-neutral setting. Below we provide some details of the modelling approaches outlined above.
The Black-Karasinski model for risk-free interest rates
The Black-Karasinski model is one of a class of arbitrage-free yield curve models known as short rate models. Other well-known short rate models include the Vasicek model and the Cox-Ingersoll-Ross model. In a short rate model, a stochastic process for the short-term interest rate is specified (different short rate models differ by specifying different stochastic dynamics for the short-term interest rate model). The fundamental idea of short rate models is that the stochastic process for the future behaviour of the short-term interest rate uniquely defines the arbitrage-free prices today of risk-free bonds of any term. So in an arbitrage-free setting, the specification of the stochastic process for the short-term interest rate also implies a bond pricing formula for the valuation of a risk-free cashflow of any duration. In a similar way, the model dynamics also implies arbitrage-free pricing formulae for interest rate derivatives such as swaptions, caps and floors. The parameters of the stochastic process for the short-term interest rate can therefore also be calibrated to derivatives such as these in order to generate market-consistent levels of interest rate volatility from the model. The mathematics of the specific model used in our examples is described in more detail in Appendix B.
In the following examples we use a calibration of this model to UK government bonds and swaption-implied volatilities as at end-December 2011.
The Lognormal Model for the risky asset portfolio returns
It is assumed that the continuously-compounded total return in excess of the risk-free short rate is normally distributed. As we are modelling in a risk-neutral setting, it must be assumed that the (arithmetic) mean excess total return is zero. So the only parameter remaining to be specified is the volatility of the excess total return. In market-consistent modelling, this parameter can be calibrated to the market prices of relevant option contracts, where they are available. For the purposes of the examples in this section, it is assumed that the option-implied volatility of the excess total return is 20%.
The Rating-Based Model for the Credit Quality of the Sponsor
As discussed in section 2.4, the market-consistent, risk-neutral stochastic modelling of sponsor default is primarily driven by reference to the market price of default risk, as implied by the level of credit spread on the traded debt of the sponsor firm. We may also be interested in projecting intermediate changes in the credit quality of the sponsor, as there may be management actions that are triggered by falls in sponsor credit quality.
In the following examples a stochastic credit rating model developed by Jarrow, Lando and Turnbull (JLT)Footnote 12 is used. In particular, a proprietary implementation of this model as found in Barrie & Hibbert's Economic Scenario Generator is used, though any JLT implementation that is calibrated to market credit spreads would be expected to deliver similar results for the example valuations considered below.
The model is calibrated to the general level of credit spreads found in corporate bond prices in the UK as at end-December 2011. In this calibration of the credit model, the credit spread of corporate bonds in excess of government bonds is used.
As discussed in section 2.5, if credit spreads were defined as the bond yield in excess of swap rates, the implied risk-neutral default rates would be lower. A calibration of credit spread to swap rates would therefore generally result in an increase in the value of the credit-risky sponsor covenants.
A recovery rate of 35% is assumed when deriving risk-neutral default probabilities from corporate bond prices.
Correlation between the variables
For the purposes of our examples, it is assumed that risk-free interest rate changes are uncorrelated with the other variables; and the credit quality of the sponsor and the risky asset portfolio return have a correlation of +0.6.
Below a series of multi-period examples are incrementally developed using the stochastic modelling set-up described above.
2.6.2 No risky assets; no credit risk
As in the series of single-period examples of section 2.5, this section introduces a series of multi-period examples of increasing complexity. The initial examples will therefore by highly stylistic, but this approach again can provide some transparency on how more realistic and complex features incrementally impact on the sponsor covenant valuation.
The first example assumes a default risk-free sponsor, and assumes that the asset portfolio is entirely invested in government bonds. Figure 6 shows the schedule of promised liability cashflows. The cashflows are assumed to arise on a yearly basis over the next 60 years (with the next cashflow due one year from the valuation date). When discounted using the UK government bond yield curve given in section 2.6.1, the present value of this liability cashflow schedule is exactly £1 billion. The duration of the liability cashflows is 16.3 years.
Schedule of Promised Liability Cashflows
The current market value of the pension fund's asset portfolio is assumed to be £800 m and is initially assumed to be entirely invested in a risk-free government bond portfolio. This bond portfolio is represented in the model by a 10-year bond that pays a 5% annual coupon. The portfolio is assumed to be re-balanced every year such that the bond portfolio at the start of every future year is invested in a 10-year bond with a 5% coupon.
Whilst this example has no risky assets and no sponsor credit default risk, there is still significant interest rate risk that arises from the asset portfolio's smaller market value and shorter duration relative to the promised liability cashflows. This risk will be captured by the stochastic interest rate paths produced by the interest rate model. The contribution strategy that will be applied in this example has not yet been specified, but almost any contribution strategy in this example will result in some variability arising in the size of contributions ultimately required to fund the liability cashflows as a result of the interest rate risk inherent in the asset-liability position.
Throughout the following examples two contribution strategies will be modelled:
• Contribution Strategy 1: A contribution is only paid when the asset portfolio is exhausted and is insufficient to fund the immediately-required liability cashflow.
• Contribution Strategy 2: A required contribution is calculated annually as Market-Consistent Deficit/5 (subject to a minimum of zero).
These two contribution strategies are intended to represent the two ends of the spectrum in terms of the pace of deficit funding. We expect most DB pension funds’ deficit contribution strategy will sit somewhere between these strategies, and hence the results of the respective strategies should provide an indication of the range of outcomes produced by variation in the deficit contribution strategy.
We now consider the sponsor covenant valuation results obtained under the two contributions strategies under the risk-free sponsor/risk-free asset portfolio case. It may be recalled from the single-period case in section 2.5.1 that the value of the sponsor covenant in this case was found to simply be the market-consistent value of the current deficit (i.e. liability cashflows discounted at the risk-free yield curve less the market value of the asset portfolio, subject to zero). This general result will also hold in the risk-free case multi-period case, with one exception that is discussed below.
Even in the risk-free asset portfolio case, the multi-period example has significant asset-liability mismatches that will generate variations in contributions payable over time under both of the above contribution strategies. This creates the possibility that the contribution strategy will result in a surplus of assets arising after all liability cashflows have been paid (if higher-than-expected future risk-free interest rates subsequently arise it can result in some of the paid contributions ultimately not being required to fund the promised liability cashflows).
If these surplus assets were assumed to be distributed to shareholders as a ‘negative contribution’ and added to the contribution cashflow schedules, the sponsor covenant valuations in the risk-free sponsor case would always be equal to the market-consistent deficit value. Similarly, if they were assumed to be distributed to pension fund members as ‘bonus payments’ and treated as liabilities, the liability valuation would increase to offset the increase in the value of the sponsor covenant, and hence again the result of a net asset value of zero for the market-consistent balance sheet would be obtained. However, if we assume these are undistributed surplus assets, there will be scope for the market-consistent sponsor covenant value to be greater than the current size of the deficit. How much greater will depend on the asset and contribution strategies, and how likely they are to result in a terminal surplus asset level arising.
When Contribution Strategy 1 is run using the risk-neutral simulation model described in section 2.6.1, an analogous result to the no asset risk/no sponsor default risk case in section 2.4 is found: the present value of the contributions was found to be £200 m (which equates to the £200 m difference between the liability cashflow present value of £1bn and the market value of the asset portfolio of £800 m). However, Contribution Strategy 2 results in a higher value of £209 m. The difference in sponsor covenant valuation between Contribution Strategies 1 and 2 reflects the higher probability of terminal surplus assets arising under Strategy 2 than Strategy 1.
In each of these cases, 10,000 risk-neutral simulations of the 60-year path of contribution cashflows have been simulated and discounted using the risk-neutral discount functions. Analysing these simulation outputs, we also find that the average duration of the simulated contribution cashflow stream under Contribution Strategy 1 is 32.4 years, and under Contribution Strategy 2 it is 5.6 years (we will use these statistics below).
2.6.3 With risky asset portfolio; no sponsor credit risk
Mirroring the progression of the single-period examples, we now consider the multi-period case when some of the asset portfolio is moved from risk-free assets into the risky asset portfolio described in section 2.6.1. In particular, two cases are considered: when the asset portfolio is invested 50%/50% in the risky asset portfolio and the risk-free bond portfolio (with annual rebalancing back to 50% allocations); and a 100% allocation to the risky asset portfolio.
Figure 7 shows the results for sponsor covenant valuation of these two cases, and compares these results with the valuation produced above with the risk-free bond portfolio. Again, both contribution strategies are analysed.
Sponsor covenant valuation under different asset allocations (no sponsor default risk)
These results are consistent with the single-period examples. Moving into riskier assets creates a more option-like commitment that incurs a greater cost for the sponsor (again assuming the shareholder cannot recover any terminal surplus, or at least that they are not considered as negative contributions in the covenant valuation). And in all cases this effect is more pronounced under Contribution Strategy 2 as the possibility that a surplus pool of assets arises after all liability cashflows have been paid is greater under Contribution Strategy 2 than Strategy 1.
2.6.4 Credit-risky sponsor; no risky assets
This section considers the impact of changes in the sponsor credit rating on the valuation of the sponsor covenant in the multi-period case when the asset portfolio is invested in the risk-free bond portfolio. It is assumed that 35% of the required future contributions are recovered from the sponsor in the event of default (i.e. a cash lump sum of 35% of the market-consistent deficit is paid into the pension fund).
You can recall from section 2.6.2 that the value of the sponsor covenant in this case when the sponsor is assumed to have no default risk was calculated to be £200 m for Contribution Strategy 1 and £209 m for Contribution Strategy 2. The 35% recovery rate implies that a sponsor who immediately defaults will pay £70 m (i.e. 35% of the £200 m deficit) under both contribution strategies. So we know that different starting sponsor credit ratings must result in covenant valuations in the range of £70 m to £200 m for Contribution Strategy 1 and a range of £70 m and £209 for Contribution Strategy 2.
Figure 8 presents the valuation results obtained by the model for eight credit ratings under both contribution strategies.
Sponsor covenant valuation and starting sponsor credit ratings (asset portfolio = £800m; no risky assets)
One of the most immediately striking aspects of the figure 8 is how much the value of the sponsor covenant is reduced under Contribution Strategy 1 when the sponsor credit rating is changed from risk-free to AAA – this reduces the covenant valuation by more than 40%. A few back-of-the-envelope calculations can help provide some intuition for this result.
Recall from section 2.6.2 that the average duration of the contribution cashflow stream produced in the risk-free example under Contribution Strategy 1 is 32.4 years. The starting 32-year AAA credit spread over government bonds at the end-2011 valuation date is assumed to be 2.0% in the model. Using the 35% recovery rate, the 32-year risk-neutral annualised default rate is 1.9%/(1 − 0.35) = 2.9%. This implies a 32-year risk-neutral default probability of 61%. This default probability is broadly consistent with the reduction in sponsor covenant valuation – i.e. assuming a 35% recovery rate is obtained in default, the 61% default probability implies an expected default loss of 0.61*0.65 = 40%.
As mentioned in 2.6.1, using credit spreads over swap rates rather than government bond yields would reduce the risk-neutral default probabilities, and hence increase the covenant valuations for the credit-risky sponsor cases. Also, the size of the above impact arises in part because of the very long duration of the contribution cashflow stream that is produced by Contribution Strategy 1. The proportional reduction in sponsor covenant valuation that is generated by the move from risk-free to AAA sponsor under Contribution Strategy 2 is significantly smaller than for Contribution Strategy 2: 18% instead of 43%.This is mainly because the duration of the contribution cashflow stream is much shorter under Contribution Strategy 2 (5 years instead of over 30 years), and the probability of a AAA sponsor defaulting over 5 years is much lower than over 30 years.
2.6.5 Credit-risky sponsor; with risky asset portfolio
We now assess the sponsor covenant valuation behaviour for credit-risky sponsors when some of the asset portfolio is allocated to risky assets. Figure 9 shows the results for the sponsor covenant valuation produced by the risk-neutral multi-period simulation model for the three asset strategies considered in section 2.6.3 and Contribution Strategy 1. Figure 10 shows the corresponding results under Contribution Strategy 2.
Sponsor covenant valuation as function of starting sponsor credit rating and asset strategy (Asset portfolio = £800m; Contribution Strategy 1)
Sponsor covenant valuation as function of starting sponsor credit rating and asset strategy (Asset Portfolio = £800m; Contribution Strategy 2)
These results are generally consistent with the results obtained throughout section 2: more asset risk generally results in an increase in the sponsor covenant; lower sponsor credit quality results in lower covenant valuations; Contribution Strategy 2 produces higher valuations than Contribution Strategy1.
However, an interesting feature of the above charts is that the value of the sponsor covenant in the risky asset strategy case falls below the risk-free strategy case when the sponsor credit rating is low (BB to CCC).This is driven by the wrong-way risk effect that is captured by the model. The model assumes a strong correlation between the risky asset portfolio and the sponsor default occurrence – defaults and falls in asset portfolio value tend to occur together, hence increasing the effective exposure to default risk. This is true in all cases, but the impact of this effect is greater for the low credit qualities. In these cases, the increase in default probability that occurs when assets perform poorly dominates the option value increase that is created by the sponsor's commitment to (try to) fund deficit increases.
2.7 Sensitivity analysis
The market-consistent valuation results produced in this section were based on market conditions at the end of 2011. These market conditions were unusually challenging for DB pension funds and reversion to more historically ‘average’ market conditions would result in a significant improvement in the net asset position of the holistic balance sheets calculated in this section. Below we analyse the sensitivity of the above valuation results to changes in starting market conditions, and, in particular, a change to market conditions that are representative of a historical ‘average’.
Current market conditions impact on the holistic balance sheet in two particularly important ways. Firstly, long-term interest rates are at unusually low levels by historical standards. As figure 5 showed, the 15-year UK government bond spot rate was 2.8% at end-December 2011. Figure 11 shows the behaviour of the long-term UK government bond yield over the last 55 years.
Long-term UK government bond yield (1955–2012)
The chart highlights that long-term interest rates are currently at levels that have not been observed in the UK in generations. This low level of risk-free interest rate naturally results in higher levels for the market-consistent value of promised liability cashflows.
Secondly, as highlighted by figure 12, UK investment-grade corporate credit spread levels are higher than their long-term historical average.
UK A-rated 7–10 corporate bond spread13 (1996–2012)
Higher Footnote credit spreads result in lower market-consistent values for the sponsor covenant. For example, at the end of 2011, the UK A-rated 7–10 year corporate bond spread was 370 bps. This compares to a median value over the 189 months since 1996 of 144 bps.
So, the combination of the levels observed by these two critical economic variables – low long-term risk-free interest rates and high corporate credit spreads – represents a historical ‘double-whammy’ for the valuation of the holistic balance sheet. It is natural to consider how the holistic balance sheets presented in this section would change if market conditions reverted to levels of historical normalcy. Of course, defining normalcy is a matter of subjective choice, but a broadly sensible set of assumptions can be easily postulated. Below, we analyse the impact on the holistic balance sheet if market conditions instantly reverted to the following conditions: the UK A-rated 7–10 year corporate bond spread falls by around 225 bps to its historical median level of 144 bps and risk-free interest rates move to a flat yield curve of 4.2% (the unconditional forward rate specified in Solvency II texts).
The impact on the holistic balance sheet produced for an A-rated sponsor with the 50/50 investment strategy and under Contribution Strategy 2 can be analysed as follows:
• The shift in the risk-free yield curve from its end-2011 levels as shown in figure 5 to a flat yield curve of 4.2% would have an immediate impact on the current values of the asset portfolio and the value of promised liability cashflows, and these impacts can be directly calculated by applying the new risk-free discount rates to the bond and promised liability cashflows:
○ The £400m government bond portfolio would fall in value to £334m, and hence the total asset portfolio would fall in value from £800m to £734m.
○ The present value of promised liability cashflows would fall from £1000m to £819m. The current market-consistent pension fund deficit would therefore fall from £200m to £85m.
• The sponsor covenant can be re-valued with these new starting values for assets and liabilities and with the new lower level of credit spreads (and hence lower risk-neutral default rates). This requires a new set of risk-neutral simulations to be calibrated and run through the risk-neutral asset-liability projection. In order to provide insight into the incremental impacts of the rate and spread changes, the covenant valuation has been re-calculated twice: once with credit spreads remaining at their end-2011 levels but the risk-free yield curve at the assumed historical norm; and then with both credit spreads and risk-free interest rates at their assumed historical normal levels. This results in sponsor covenant valuations of £123m and £166m respectively.
These results are summarised together with the end-2011 results presented for this case in section 2.65 in table 6.
Holistic balance sheet for section 2.6.5 example (A-rated sponsor, 50/50 asset portfolio, Contribution Strategy 2)
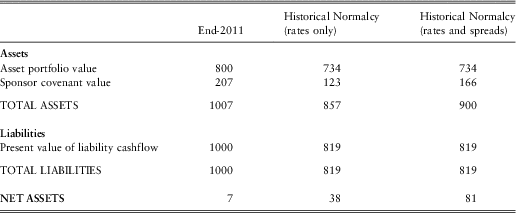
Table 6 shows that a reversion of economic and financial market conditions to historical normalcy would have a significantly beneficial impact on the net asset position of the holistic balance sheet in this example DB pension fund case. Interestingly, the reversion to historically normal credit spreads has a bigger incremental impact on the net asset value than the reversion to normal risk-free interest rates. Of course, this is partly a function of how ‘normal’ is defined, and it could be argued that the UK's ‘normal’ risk-free interest rate is higher than 4.2%.
Nonetheless, these examples highlight that the behaviour of the sponsor covenant value is a function of both the cost of sponsor credit risk and the expected level of contributions that will be generated by the strategy. So, even in the case where credit spreads fall to the historically lower level, the absolute value of the covenant has been reduced because the smaller size of the pension fund deficit results in a lower size of deficit contribution payment typically arising, particularly in the first five or so years of the projection.
2.8 Areas for further research
The construction of a market-consistent, holistic balance sheet for a DB pension fund is undoubtedly a task that is both technically complex and requiring of considerable expert judgement. Whilst marking liquid asset securities to market is a relatively straightforward task, market-consistent valuation of the sponsor covenant is not. Further, at the time of writing there is considerable debate around Solvency II methodologies for the valuation of long-term liability cashflows, and these issues are equally relevant to the valuation of the liabilities of pension funds.
Further research into holistic balance sheet valuation methods can be considered in (at least) two distinct categories:
1. Market-consistent valuation of long-term, illiquid liabilities. This overlaps significantly with the work currently underway in Solvency II's Long-Term Guarantee Impact Assessment. At the time of writing this work had not yet been completed, but the valuation topics being considered in this debate currently include:
• How to extrapolate market prices beyond the terms of reliable market prices?
• What allowance for liability illiquidity should be made in the valuation, and how?
• In times of market distress, is it appropriate for the market-consistent valuation of liabilities to be calibrated to asset prices that have been adjusted from their observable market values?
Each of these questions could have a direct and significant impact on the valuation of the promised liability cashflows in a holistic balance sheet. So too would the even more fundamental question of whether risk-free interest rates should be derived from government bond prices or interest rate swap rates.
2. Market-consistent valuation of the sponsor covenant. This section has highlighted that the sponsor covenant valuation requires many assumptions about the joint behaviour of the sponsor and economic and financial variables over long periods of time. Some of the particular topics that could be further researched include:
• How long-term risk-neutral default rates are derived for sponsors that do not have traded credit-risky bonds.
• Setting of non-observable assumptions such as the recovery rate that occupational pension funds can expect from defaulting sponsors and the size of the wrong-way risk correlation.
• ‘Governance’ of the setting of assumptions on how much sponsor is committed to paying into the pension fund when and in what circumstances.
3 Developing a ‘light’ method for the market-consistent valuation of the sponsor covenant
In section 2, a risk-neutral simulation framework was developed and applied to the market-consistent valuation of the sponsor covenant. The simulation approach is powerful and flexible: it can fully incorporate the impact of path-dependent contribution strategies into the valuation, and can allow for other complexities such as the wrong-way risk that is likely to be a feature of the covenant valuation (i.e. recognising that the sponsor default probability will tend to be higher when the size of the deficit increases), dynamic asset strategies, fat-tailed asset return distributions and so on.
However, a simulation framework is also moderately complex to implement: it requires a simulation model for the various risk factors that will drive the behaviour of the covenant; these risk factors need to be calibrated to relevant market prices and then projected over the term of the pension fund's liabilities; assumptions about the behaviour of the pension fund investment strategy and the sponsor's deficit contribution strategy in all future possible economic environments are required; estimates are required for sponsor recovery rates and the size of correlation between deficit size and sponsor default probability; a significant amount of computation will be required for the valuation of every pension fund's sponsor covenant.
This section considers whether a simpler valuation method can be developed that does not require the use of stochastic simulations, but which can still reliably capture some of the sponsor covenant valuation behaviour that was identified in section 2. This will inevitably involve approximation and will have limitations. Throughout the section we will attempt to obtain clarity about what features of the covenant valuation are capable of accurate representation using a simple formula, and which must ultimately be tackled using simulation (or at least that requires further research to develop reliable approximation methods).
3.1 Valuation assuming deterministic deficits and contributions
It can be recalled from section 2 that the complexity of the valuation was driven by the potential variability of future deficits, how that impacted on contributions payable under the assumed deficit contribution strategy, and how sponsor default probabilities behaved as economic conditions and pension funds’ financial health varied. It is relatively easy, however, to perform a market-consistent valuation of the elements of the covenant that does not depend on the complexity that arises from volatility in financial market prices and economic variables. Before we set out how the method can be implemented, table 7 sets out what characteristics of the sponsor covenant valuation are captured by this deterministic approach.
Sponsor covenant characteristics captured by full and deterministic valuation methods
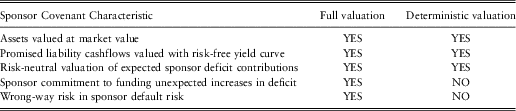
This deterministic valuation approach is relatively straightforward to implement as follows:
1. Derive a term structure of risk-neutral default probabilities from a market credit spread curve.
2. Generate the path of deficit contributions that is generated from the assumed deficit contribution strategy when future interest rate changes and asset portfolio returns are derived from the current risk-free forward curve.
3. Project the path of the pension fund deficit under the asset returns, liability discount rates and contributions calculated in step 2.
4. Calculate the value of the sponsor covenant conditional on a default at time t as the risk-neutral present value of the contributions paid up until time t as calculated in step 2, plus x% of the pension fund deficit prevailing at time t as calculated in step 3 (the latter being the assumed amount recoverable from the sponsor on default).
5. Calculate the market-consistent value of the sponsor covenant as the probability-weighted sum of the conditional sponsor covenant valuations (using the default probabilities derived in step 1 and the conditional valuations calculated in step 4).
In option pricing parlance, the above calculation can be considered as an exact valuation of the intrinsic value of the sponsor covenant. It does not include the time value of the optionality inherent in the sponsor covenant. This optionality essentially arises because the sponsor is assumed to be committed to funding downside risk on further deficit increases, but is assumed to not participate in the upside if the pension fund moves into surplus. As such, the optionality also increases the value of the sponsor covenant. The intrinsic value can therefore generally be considered as a lower bound on the sponsor covenant valuation.
The single time-step examples in section 2.5.2 provided some insight into the behaviour of the intrinsic and time values of the sponsor covenant option. It highlighted that the time value is likely to be most material when the pension fund is currently close to 100% funded, and will tend to zero as the size of surplus/deficit increases in magnitude (in either direction). The time value will also be increased when there is a lot of potential variability in the size of future contributions – this variability could arise because of a risky asset strategy or because of the timing of the contributions as implied by the assumed strategy.
The above approach is referred to as the Deterministic Valuation Method for the remainder of this section. Our understanding of the implementation of the method and the results it produces is now developed by applying it to some of the multi time-step examples developed in section 2.6.
Figure 13 uses the methods discussed in section 2.2 to calculate the default probability term structures derived for the A-rated and BB-rated credit spread term structures that were assumed in the section 2.6 valuations. As in section 2.6, a 35% recovery rate is assumed to be embedded in the credit spread pricing. These calculations correspond with Step 1 of the Deterministic Valuation Method as described above.
Risk-Neutral Default Probabilities Derived from A-rated and BBB-rated credit spread curves
Moving on to step 2 in the Deterministic Valuation Method, figure 14 shows the contributions generated by each of Contribution Strategies 1 and 2 of section 2.6 when asset returns and interest rates follow the forward risk-free yield curve used in section 2.6.
Deterministic Risk-Neutral Projection of Contributions (No sponsor default)
Figure 15 shows the risk-neutral expected paths for the market-consistent pension fund deficit when the asset returns and interest rates follow the forward curve and contributions are paid as per figure 14.
Deterministic Risk-Neutral Projection of Deficit (no sponsor default)
The sponsor covenant valuation conditional on default occurring in year t can be calculated from the information in figures 14 and 15. This can be done by defining the conditional valuation as the present value (when discounting with the starting risk-free yield curve) of the contributions paid up until year t, plus 35% of the market-consistent pension fund deficit arising at year t. These conditional valuations are shown for each Contribution Strategy conditional on default occurring in each of years 1–60.
The results of figure 16 can be combined with the default probabilities shown in table 7 and figure 13 in order to produce the sponsor covenant valuation for each of Contribution Strategy 1 and 2 for A-rated and BB-rated sponsors. The risk-free sponsor results can also be obtained for this method by using the sponsor covenant valuation conditional on default occurring after year 60 and applying a probability of 1 to this event. These results are set out in figure 17.
Sponsor Covenant Valuations Conditional on Default Occurring in Year t
Sponsor Covenant Valuations using the Deterministic Valuation Method
3.2 Comparing the deterministic and Monte-Carlo simulation valuation results
Section 3.1 introduced the idea of performing an exact deterministic valuation of the intrinsic value of the sponsor covenant and produced a number of sponsor covenant valuations using this approach for the examples introduced in section 2.6. This section compares those deterministic valuations with the ‘full’ valuations carried out using stochastic simulations in section 2.6.
Figures 18 and 19 show the results produced under the two methods for the A-rated and BB-rated sponsor respectively using Contribution Strategy 1 and for the three investment strategies modelled in section 2.6.
Comparison of Sponsor Covenant Valuation Results from Simulation and Deterministic Valuation (A-rated sponsor; Contribution Strategy 1)
Comparison of Sponsor Covenant Valuation Results from Simulation and Deterministic Valuation (BB-rated sponsor; Contribution Strategy 1)
As mentioned in section 3.1, figures 18 and 19 show that the deterministic valuation is generally a lower bound for full valuation (there is an exception for the BB-rated 50/50 strategy result and this is discussed further later). Also, the deterministic valuation is not sensitive to the investment strategy assumption as it assumes all assets earn the risk-free rate implied by the starting forward yield curve. As the investment strategy moves into riskier and more volatile assets, the difference between the full and deterministic valuations increases. This is intuitive – the difference between the valuations reflects the time value of the optionality inherent in the sponsor covenant and this time value increases as the volatility of the asset strategy is increased.
Figures 20 and 21 show the analogous results for Contribution Strategy 2.
Comparison of Sponsor Covenant Valuation Results from Simulation and Deterministic Valuation (A-rated sponsor; Contribution Strategy 2)
Comparison of Sponsor Covenant Valuation Results from Simulation and Deterministic Valuation (BB-rated sponsor; Contribution Strategy 2)
Again, figures 20 and 21 show the deterministic valuation is a lower bound for the full valuation and a similar pattern of results can be observed for Contribution Strategy 2 as Strategy 1. However, the differences between the full and deterministic valuations are generally greater under Contribution Strategy 2 than Strategy 1. For example, consider the A-rated sponsor with 50/50 asset strategy: the full valuation is 107% of the deterministic valuation under Strategy 1, and this ratio increases to 127% under Strategy 2. This is because there is greater variability in the level of contributions paid under Strategy 2 than 1 under each of the investment strategies considered.
The usefulness of the deterministic valuation as a proxy for the full valuation can also be considered for different levels of starting size for the deficit. Figures 22 and 23 compare the full valuation and deterministic valuations produced under Contributions Strategy 1 and 2 respectively for a range of starting deficits for the A-rated sponsor with the 50/50 asset strategy. (The variation in the starting deficit value is produced by changing the starting value of the asset portfolio.)
Comparison of Sponsor Covenant Valuation Results from Simulation and Deterministic Valuation for various starting deficit sizes (A-rated sponsor; 50/50 asset strategy; Contribution Strategy 1)
Comparison of Sponsor Covenant Valuation Results from Simulation and Deterministic Valuation for various starting deficit sizes (A-rated sponsor; 50/50 asset strategy; Contribution Strategy 2)
Finally, figure 24 summarises the results of the previous two charts by plotting the difference between the full valuation and deterministic valuation as produced for each contribution strategy.
Difference between Sponsor Covenant Valuation Results from Simulation and Deterministic Valuation for various starting deficit sizes (A-rated sponsor; 50/50 asset strategy)
Figures 22 to 24 show that the differences between the full sponsor covenant valuation and deterministic valuation tends to be greatest when the pension fund surplus/deficit is zero. This is consistent with option pricing theory: recall that the difference between these valuations can be considered as a form of time value for the optionality in the sponsor covenant. The time value of an option is greatest when the option is at-the-(forward) money.
You will also notice that in some cases the difference between the simulation valuation and the deterministic valuation is negative in figure 24. At first glance this is a very odd result: the difference in valuations represents the time value of the optionality in the sponsor covenant valuation, and a fundamental tenet of option pricing theory is that an option's time value cannot be negative. This can be explained by recognising that the sponsor covenant valuation has an additional complexity: the wrong-way risk referred to earlier in the paper.
As discussed earlier, when we move from the deterministic basis to the full stochastic basis, the sponsor covenant valuation generally increases because the sponsor promises to absorb deficit downside risk but does not participate in all the gains on the upside (i.e. the analysis has not assumed the sponsor owns any terminal surplus). However, the stochastic modelling also assumes that sponsor default rates are, on average, higher in the economic conditions that generate significant increases in the deficit. This wrong-way risk has a negative impact on the simulation valuation, and is not captured by the deterministic valuation. The cases where the negative result is obtained are cases where the first of these effects (which we can describe as the ‘pure’ time value) is very low because the option is so deep in-the-money, but the second effect is still present and the negative impact it has across all cases is most transparent in these cases.
In summary, section 3.2 has demonstrated that a risk-neutral deterministic or intrinsic valuation of the sponsor covenant is readily computable. It has also demonstrated intuitive results about when the deterministic valuation will most closely correspond to the full valuation (i.e. when the optionality or time value of the sponsor covenant option is low). A consequence of this is that the difference between the deterministic and full valuation will be greater for riskier investment strategies; for contribution strategies that result in more variation and uncertainty in contribution levels; and when the pension fund surplus/deficit is close to zero.
A ‘typical’ UK pension fund could have a market-consistent deficit of 20% of liabilities; a 50/50 asset strategy and a deficit contribution strategy that is somewhere in between Strategy 1 and Strategy 2. In such a case, the modelling in this section suggests the deterministic valuation would under-estimate the full market-consistent value of the sponsor covenant by 10% to 20% for an A-rated sponsor and 5%–10% for a BB-rated sponsor. If the market-consistent pension fund deficit is greater than 20%, this will generally reduce the degree to which the deterministic valuation under-estimates the full valuation.
3.3 Beyond the deterministic valuation method
As has been discussed throughout this paper, the accurate assessment of the full market-consistent value of the sponsor covenant can be highly complex due to features such as path-dependency in contributions, wrong-way risk in sponsor default probabilities, and dynamic behaviour in investment strategy. Finding robust analytical approximations to the behaviour of the full valuation, including the option time value, is a demanding problem that the scope of this paper and we recommend it as a topic worthy of further research.
4 Using the holistic balance sheet to assess risk-based solvency requirements
The holistic balance sheet can be useful as a risk-adjusted, market-based assessment of the current economic value of a pension fund's assets and liabilities. But in the context of the EIOPA proposals described in the Introduction, the holistic balance sheet is primarily intended as a means to a further end: to make a risk-based solvency capital assessment for the pension fund.
There are many approaches to assessing the solvency capital requirement of a financial balance sheet, and this is again an area where recent actuarial experience in the insurance sector can be drawn upon. Traditionally, insurance solvency capital requirements were assessed using prudential margins in actuarial valuations. Over the last ten or so years, this has been superseded by more explicitly risk-based approaches that use probabilistic objectives for capital adequacy. An example of this type of approach is the 1-year 99.5% Value-at-Risk (VaR) of the market-consistent value of the net assets of the balance sheet, i.e. the solvency capital is defined as the 99.5th percentile of the probability distribution of the one-year change in the market-consistent value of the balance sheet's net assets.
This definition of solvency capital requirement has been used widely in the global insurance sector over the last ten yearsFootnote 14 and is the approach proposed for Solvency II's Solvency Capital Requirement. As the holistic balance sheet uses a market-consistent valuation approach, it can sit naturally within this market-consistent balance sheet framework for assessing solvency capital.
This section of the paper discusses how the holistic balance sheet and the valuation approaches developed in sections 2 and 3 can be applied to the solvency capital assessment as defined by the 1-year market-consistent VaR approach. Section 4.1 discusses some of the computational challenges that are generally associated with the implementation of the method; section 4.2 then develops an example capital calculation based on the holistic balance sheets developed in section 2.6; and section 4.3 goes on to consider the risk management incentives that such a capital assessment approach may create for DB pension fund stakeholders.
4.1 The computational challenge of 1-year Value-at-Risk
The computational challenge of implementing the 1-year VaR assessment can be substantial when the assets or liabilities of the balance sheet require the use of simulation in their market-consistent valuation. In these circumstances, a full VaR computation can be described in two stages:
1. Produce a set of stochastic scenarios for the 1-year projection horizon required by the 1-year VaR assessment. These scenarios will be used to describe the joint probability distribution of the risk factors that will drive changes in the market-consistent values of the assets and liabilities over the 1-year horizon. Note these probabilities will not, in this case, be risk-neutral – they are intended to represent the probabilities of what may happen in the ‘real-world’ over a 1-year projection.
2. In each of the above 1-year real-world scenarios, a market-consistent valuation of the assets and liabilities of the balance sheet is required at the end of the projection year. For complex assets and liabilities, this may require the use of thousands of risk-neutral simulations for the valuation in each real-world scenario.
This ‘nested stochastic’ problem is described graphically in figure 25.
Use of stochastic scenarios in a 1-year Value-at-Risk calculation
The nested stochastic problem arises regularly in the implementation of 1-year VaR for life insurers. Specifically, this arises due to the complex options and guarantees embedded in some insurance contracts and that therefore appear on the liability side of the insurer's balance sheet. These product features generally require simulation methods to be used to accurately assess their market-consistent values. This requirement is very similar to the need for market-consistent simulations to be used to accurately value all forms of complexity that can arise in valuation of the sponsor covenant.
In response to this challenge, a number of approaches have been developed to reduce the computational burden of the nested stochastic calculation. Most of these have involved developing liability proxy functions that provide analytical approximations to the market-consistent liability valuation, hence removing the need for the ‘inner’ market-consistent simulations shown in figure 25. Figure 26 shows how the introduction of these proxy functions reduces the computation burden of 1-year VaR.
1-year Value-at-Risk calculation with proxy valuation functions
A range of quantitative methods have been developed for producing liability proxy valuation functions in insurance and they could be similarly applied to produce estimates of how the market-consistent values of the sponsor covenant change over the 1-year projection as function of the modelled risk factors.
So, one approach to implementing the 1-year VaR calculation for pension funds would be to generate thousands of 1-year real-world scenarios, estimate the holistic balance sheet arising in each scenario using approximate valuation functions that describe how the sponsor covenant valuation changes as a function of the modelled risk factors, and then read off the 99.5th percentile results for change in the net assets of the holistic balance sheet. This is analogous to the approaches being developed by insurance groups who are developing Internal Models for Solvency II Solvency Capital Requirement.
However, a simpler method is used in the Solvency Capital Requirement's Standard Formula calculation. The Standard Formula also reduces the computational burden of the 1-year VaR calculation, but it does so in quite a different way to that shown in figure 26: rather than removing the need for market-consistent simulations to be carried out in each real-world scenario, it vastly reduces the number of real-world scenarios in which the valuations need to be carried out. It does this by calculating the impact on the market-consistent balance sheet of a 99.5th percentile individual shock to each of the balance sheet's key risk factors, and then using an assumed correlation matrix to aggregate these individual capital requirements. This method is commonly referred to as the Stress-and-Correlate method or the Var-Covar methodFootnote 15.
The method can miss some of the complexities of asset/liability behaviour (in particular, non-linear risk factor sensitivities of market-consistent valuations). Unlike more sophisticated methods, it can only provide an estimate of a given percentile of the net asset probability distribution rather than an estimate of the entire probability distributionFootnote 16. But it might be considered ‘good enough’, particularly in the context of the other approximations and estimates inherent in the valuation and capital assessment process.
Finally, the most pragmatic approach could combine both of the above forms of approximation, i.e. use the Var-Covar approach together with valuation approximation functions such as those developed in section 3. This would reduce the need for any stochastic scenarios to be used in the solvency capital assessment process: the solvency capital assessment would simply entail re-calculating the sponsor covenant valuations using the approximate valuation formulas under a handful of specified stress tests.
4.2 Solvency capital assessment example using the Var-Covar approach
An illustrative example is now developed to demonstrate how the holistic balance sheet can be used in the assessment of a 1-year market-consistent VaR. The Var-Covar approach described in section 4.1 is used in the example, and the example can be considered as loosely based on the Solvency II Standard Formula. In order to focus on the capital assessment and not be distracted by any approximation errors in the balance sheet re-valuations, the full market-consistent simulation model developed in section 2.6 is used in this section for the re-valuations required by the Var-Covar method.
You will recall from section 4.1 that the Var-Covar approach requires the holistic balance sheet to be re-valued following a 99.5% stress to each of the risk factors considered in the capital assessment. These stress tests are used to calculate capital requirements for each risk factor, and these capital requirements are then aggregated using a correlation matrix. In the valuation model developed in section 2.6, there are four sources of risk for which the holistic balance sheet needs to be stressedFootnote 17:
1. Changes in the risk-free yield curve.
2. Changes in the value of the risky asset portfolio.
3. Changes in the credit quality of the sponsor.
4. Changes in the general level of credit spreads.
The risk-based capital assessment example will use the cases described in section 2.6.5: 50/50 asset portfolio, Contribution Strategy 2, and will consider the results for three different sponsor credit ratings: risk-free, A and BB. The holistic balance sheets produced in section 2 for these cases are summarised in table 8.
Holistic balance sheets of pension funds by sponsor credit rating (section 2.6.5 case)
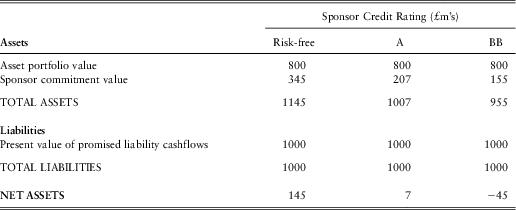
The stressed holistic balance sheet valuation is now calculated for each of the four risk factors described above.
4.2.1 Yield curve stress
This section considers how a 99.5th percentile change in the risk-free yield curve can impact on the items of the holistic balance sheet and its net asset value.
In theory, the holistic balance sheet is impacted by a change in any point of the yield curve. So, a full approach to assessing the sensitivity of the balance sheet to changes in the yield curve could consider its sensitivity to changes in each of, say, 60 annual points on the yield curve, and then stochastically model how each of those 60 points behave.
In practice, simpler approaches can be developed by recognising that these 60 points on the yield curve will generally be quite strongly correlated. This means that a smaller number of statistical risk factors can be used to accurately represent the joint behaviour of all 60 points. Typically, a statistical technique such as Principal Components Analysis (PCA) is used to represent the joint behaviour of all points on the yield curveFootnote 18. PCA typically shows that the vast bulk of empirical variations in yield curves can be explained by three or four factorsFootnote 19. Whilst PCA factors are derived purely statistically rather than from any descriptive model of yield curve behaviour, the factors can generally be given intuitive explanations: the first PCA factor will generate shifts in the level of the yield curve; the second factor will produce changes in the slope of the yield curve; and the third factor will generate twists in the shape of the yield curve.
In a principle-based approach to capital assessment, the methodology should focus on the risk factors that have greatest impact on the capital assessment of the balance sheet. (A key feature of a principle-based risk assessment system should be that the risk assessment methodology should be driven by the balance sheet's risk exposures, rather than the other way round.) This will be a function of how the balance sheet is managed, and consequently which risk factors it has greatest net exposure to. For example, when a balance sheet is duration-matched but not cashflow-matched, its exposure to the first PCA factor (yield curve level) should be low, but the exposure to the second and third factors (slope and twist risk) will be comparatively significant. But a balance sheet that has a substantial duration mis-match will tend to find that its risk exposure to the first PCA factor will dominate the yield curve risk and capital assessment, and relatively little will be added by considering its sensitivity to ‘higher-order’ forms of interest rate risk.
In the example described above, the holistic balance sheet's assets (both the asset portfolio and the future contribution cashflow stream) have a significantly shorter duration than the promised liability cashflows. This is likely to be currently representative of a significant portion of UK DB pension funds. The yield curve risk assessment in this example will therefore focus on the first yield curve risk factor: changes to the level of the yield curve. More complex changes to the shape of the yield curve will be omitted from the example, but it could be naturally extended to include additional PCA factors as risk factors in the capital assessment. It can be noted that this is also the approach proposed for the Solvency II Solvency Capital Requirement's Standard Formula – the Standard Formula's yield curve stresses only considers specified changes in the level of interest rates; it does not consider the impact of changes in slope or twists in yield curve shape.
As the example holistic balance sheet has a net shortfall in duration, it can be intuitively deduced that the net assets of the balance sheet will be exposed to a fall in the level of the yield curve rather than interest rate rises. The yield curve fall stress specified in the latest draftFootnote 20 of Solvency II's Standard Formula is used as our example 99.5th percentile yield curve stress. Figure 27 shows the base and stressed yield curve produced by the Solvency II stress test.
Base and stressed risk-free yield curve
The change in the value of the promised liability cashflows and the asset portfolio's government bond holdings can be directly calculated by discounting these cashflows using the stressed risk-free yield curve. The liability valuation increases by 17.7% from £1,000m to £1,177m under this change in the yield curve. The bond holding increases by 8.3% from £400m to £433m. The value of the risky asset sub-portfolio is unchanged by this stress test.
The above numbers show the liability valuation has increased by over £140m more than the asset portfolio. What about the market-consistent value of the sponsor covenant? The contribution strategy will now generate, on average, more contributions than in the base case, and those cashflows will be discounted at a lower interest rate, so it can be expected that the sponsor covenant asset will generally increase in value under this stress test. In the case of the risk-free sponsor, the increase in the value of the contributions will exactly offset the change in the market-consistent deficit. But in the other cases, the risk-neutral simulation model must be re-run with the new yield curve in order to assess the increase in the sponsor covenant value (unless, of course, we are using approximate valuation functions such as those produced in section 3).
The stressed holistic balance sheets are set out in Tables 9–11.
Holistic balance sheet of pension fund; including yield curve stress results (Risk-free sponsor)
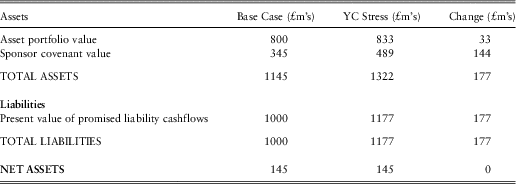
Holistic balance sheet of pension fund; including yield curve stress results (A-rated sponsor)
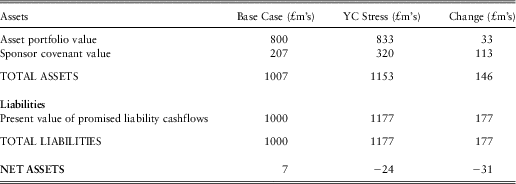
Holistic balance sheet of pension fund; including yield curve stress results (BB-rated sponsor)
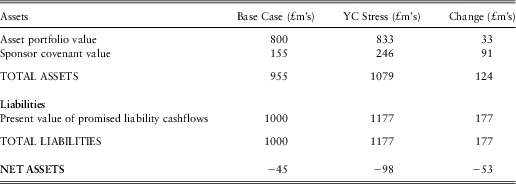
In the risk-free sponsor case, the change in the value of the risk-free contribution stream entirely offsets the change in the liability cashflow valuation (net of the asset portfolio value change); but in the presence of credit risk, the increase in promised contributions has a more limited impact on the valuation of the sponsor covenant as the new contribution stream is riskier in the sense that it will fall in value by a greater amount when sponsor default occurs. As a result, the net asset value of the balance sheet falls under the stress test when the sponsor covenant is credit-risky.
For the A-rated sponsor, the increase in covenant value (£113m) offsets around three-quarters of the increase in market-consistent deficit (£144m). The BB-rated sponsor offers less protection, and the covenant increase (£91m) is only three-fifths of the deficit increase.
4.2.2 Risky asset portfolio value stress
This section considers a stress to the starting value of the risky asset sub-portfolio. The sub-portfolio has a starting value in the base case of £400m (a 50% allocation of the £800m total asset portfolio). It was assumed in the valuation calculations in section 2 that the risky asset portfolio return is lognormally distributed with a volatility of 20%. Using this assumption to set the 1-year 99.5% stress testFootnote 21, we obtain a stress test of a 37.7% fall in the risky asset portfolio valueFootnote 22.
This results in a stressed risky asset portfolio value of £249m. The risk-free bond portfolio value is unaffected by this stress, and so the starting total asset portfolio value is £649m (£400m of risk-free bonds plus £249m of risky assets). The value of the promised liability cashflow stream is also unaffected by this stress.
The sponsor covenant valuation in this stress test can be calculated by re-running the risk-neutral simulation model with the revised starting value for the risky asset portfolio. Intuitively, an increase in the value of the sponsor covenant can be expected as the contribution strategy will generate an increased amount of contributions, acting as an ‘absorber’ of some of the asset portfolio value loss. As in 4.2.1, in the risk-free sponsor case the sponsor covenant will absorb the entire deficit impact. But in the credit-risky sponsor cases, the credit risk associated with the increased contributions acts to limit the capacity of the covenant to absorb the entire mark-to-market impact. Tables 12 and 13 present the stressed balance sheets for the A-rated and BB-rated sponsors respectively.
Holistic balance sheet of pension fund; including risky asset portfolio stress results (A-rated sponsor)
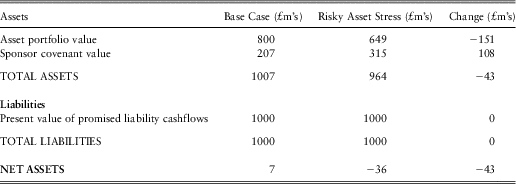
Holistic balance sheet of pension fund; including risky asset portfolio stress results (BB-rated sponsor)
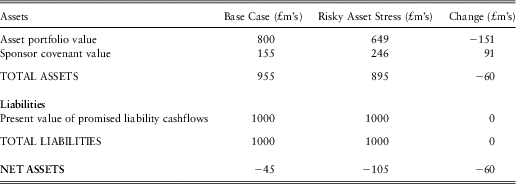
In these results around two-thirds of the asset portfolio value loss has been offset by the increase in value in the sponsor covenant that arises in the stress. Naturally, the A-rated sponsor is able to absorb more of the impact than the BB-rated sponsor.
4.2.3 Sponsor credit rating stress
This section considers the impact on the holistic balance sheet of a 99.5th percentile stress of the credit rating of the sponsor. This first requires us to define what would happen to the credit ratings of the A-rated and BB-rated sponsors after applying a 99.5th percentile stress to their rating. Table 14 shows the long-term historical frequencies of 1-year changes in credit ratings of A-rated and BB-rated corporate sponsorsFootnote 23.
Historical frequency of 1-year change in credit rating of corporate bonds (1920–2010)
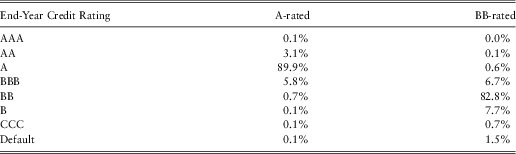
Table 14 shows that the probability of the A-rated sponsor being downgraded to B or lower is 0.3%, and the probability of a downgrade to BB or lower is 1%. So the 99.5th percentile 1-year event for the A-rated sponsor is a downgrade to BB. By chance, the example is already quite familiar with the BB-rated sponsor covenant valuation: table 8 showed that the sponsor covenant valuation for a BB-rated sponsor under Contribution Strategy 2 and the 50/50 asset strategy is £155m. No other items of the holistic balance sheet are impacted by this stress test. Table 15 shows the stressed balance sheet for the A-rated sponsor.
Holistic balance sheet of pension fund; including sponsor credit rating stress results (A-rated sponsor)
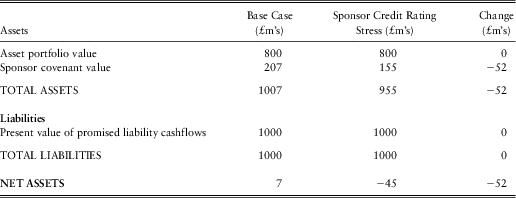
For the sponsor that is currently rated BB, table 14 shows that there is a 1.5% probability of defaulting within 1 year, and so the 1-year 99.5% stress test is that the sponsor defaults. Section 2.6.5 showed that the result for this asset strategy and contribution strategy where the sponsor has defaulted is a sponsor covenant valuation of £70m. The results for this case are shown in table 16.
Holistic balance sheet of pension fund; including sponsor credit rating stress results (BB-rated sponsor)
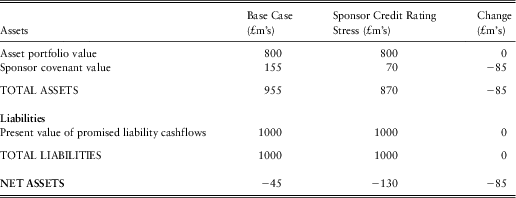
4.2.4 Credit spread level stress
The final of the four risk factor stresses left to consider is an overall change in the market level of credit spreads. In considering how to define the credit spread stress, a similar discussion arises as in the yield curve risk section. The sponsor covenant valuation will in theory be a function of the size of the sponsor credit spread at every term at which a contribution cashflow may arise. However, variation in credit spreads will be highly correlated across different points on the term structure of a given sponsor or credit rating. Moreover, the overall level of market credit spreads of different credit ratings will also tend to be highly correlated.
So in a similar spirit to the yield curve risk stress test, the example uses a single factor to produce a stressed increase in the overall level of credit spreads (across both term and credit rating). This factor is a parameter in the market-consistent credit model that is used to specify the level of credit spreads (and hence risk-neutral default rates).
The parameter has been stressed to produce a shift in credit spreads that is broadly consistent with the level of spread stress in the Solvency II QIS5 specificationFootnote 24. The QIS5 specification requires a 1.4% increase in the A-rated spread curve, and a 4.5% increase in the BB curve. The QIS5 specification of a shift of the same size in the credit spread at all terms is not consistent with the theory and empirical reality that credit spreads will be less volatile at longer terms. The credit model factor therefore tends to struggle to fit exactly to this specification. Figures 28 and 29 show the stressed credit spread term structures produced by the model.
Stress test of credit spreads: impact on A-rated credit spread term structure
Stress test of credit spreads: impact on BB-rated credit spread term structure
Figure 28 shows that the stress applied in the model produces a 1.4% shift in the 13-year A-rated credit spread, with a higher stress produced at shorter terms and a smaller stress produced at longer terms. Similarly, a 4.5% shift in the B-rated credit spread was produced at a term of 2–3 years, and a smaller stress was produced for longer terms.
The stress to the level of credit spreads does not impact on the value of the asset portfolio as its bonds holdings are assumed to be risk-free. So this stress only impacts on the market-consistent valuation of the credit-risky sponsor covenant asset. The valuation impact can be assessed by re-running the risk-neutral simulations with the new credit model calibration (note the assumed higher level of spreads will result in the risk-neutral model producing a higher level of sponsor defaults). The balance sheet results for the A-rated and BB-rated sponsors are shown in tables 17 and 18 respectively.
Holistic balance sheet of pension fund; including credit spread stress results (A-rated sponsor)
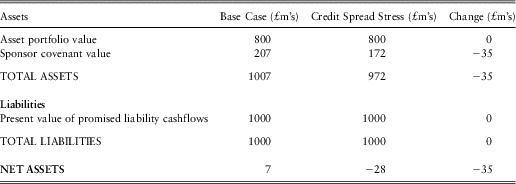
Holistic balance sheet of pension fund; including credit spread stress results (BB-rated sponsor)
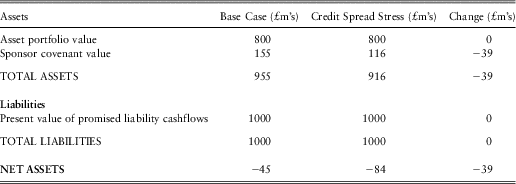
4.2.5 Summary of the stress test results
Having calculated the capital requirements generated by each risk factor on a stand-alone basis, the following section will turn to their aggregation to produce a total solvency capital requirement for the holistic balance sheet. Before doing that, table 19 summarises the capital requirement results produced in sections 4.2.1–4.2.4.
Summary of individual capital requirements by risk type and sponsor credit rating
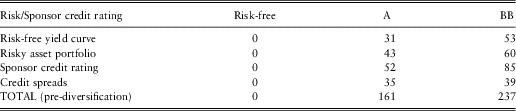
The stressing of the holistic balance sheet in these various ways highlights a few general observations that can be summarised as follows:
• The higher the credit quality of the sponsor, the more the sponsor covenant will act as a loss-absorber for the impact of unexpected risks on the balance sheet – the sponsor covenant will increase in value to offset some of the increase in pension fund deficit. Taken to the limiting case of a risk-free sponsor, the sponsor covenant will absorb all risks and the net assets of the balance sheet will be immunised from the impact of all risks on the balance sheet (perhaps except from the risk that the assumption the sponsor is risk-free turned out to be wrong!).
• With lower quality sponsors, the sponsor covenant is not able to absorb as much of the impact of other risks: whilst promised and expected contribution cashflows may increase after a shock to say, equity markets, the credit-riskiness of the contribution stream will mean that the impact on the valuation will be less than proportional to the increase in expected contributions.
• At a 99.5% confidence level, a credit rating stress of sponsors with a credit rating of BB or lower will produce a sponsor default stress. This implies that a large number of corporate pension fund sponsors will be able to obtain only limited credit for the presence of the sponsor covenant within a 99.5% VaR framework – the sponsor covenant asset will be largely offset by the need to hold capital against the risk that the sponsor immediately defaults. But there are two effects that will slightly improve this picture: a recovery rate from the sponsor can be assumed in the event of default; the capital required for sponsor default risk will diversify to some degree with the other capital requirements. This latter point is the focus of the next section.
4.2.6 Aggregated risk-based capital assessment
The aggregation of the above stand-alone capital requirements requires assumptions about the joint behaviour of the four risk factors. The illustrative correlation assumptions used in this example are summarised in table 20.
Assumed correlations between stand-alone capital requirements

Note this illustrative example assumes all risk factors are correlated with a Gaussian copula (i.e. the strength of the correlation does not vary as a function of the size of the marginal shock to the risk factor).
Under these assumptions the aggregate capital requirement can be calculated as the square root of the sum of squared capital requirements plus covariance terms. The aggregation calculation generates an aggregate capital requirement of £122m for the A-rated sponsor and £175m for the BB-rated sponsor. The pre-diversification capital requirement (i.e. simply the sum of the individual capital requirements produced for each risk factor) is £161m for the A-rated sponsor and £237m for the BB-rated sponsor. The correlation assumptions have generated a diversification benefit of £39m for the A-rated sponsor and £62m for the B-rated sponsor. In both cases the diversification benefit is a reduction in the aggregate capital requirement of around 25% of the pre-diversification capital requirement.
Figures 30 and 31 chart the stand-alone capital requirements and diversification benefit for the A-rated and BB-rated sponsors respectively.
Aggregate capital requirement by risk type and diversification benefit (A-rated)
Aggregate capital requirement by risk type and diversification benefit (BB-rated)
And finally, the holistic balance sheets with their solvency capital requirements are set out in tables 21–23 for each of the risk-free, A-rated and BB-rated sponsors.
Holistic balance sheet and capital requirement of pension fund (Risk-free sponsor)
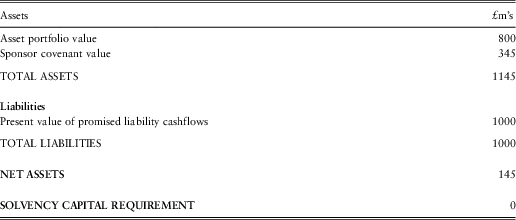
Holistic balance sheet and capital requirement of pension fund (A-rated sponsor)
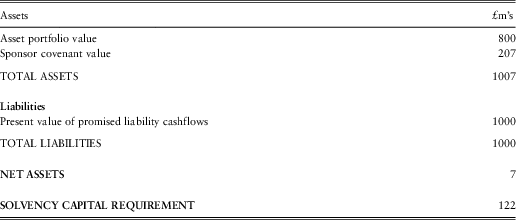
Holistic balance sheet and capital requirement of pension fund (BB-rated sponsor)
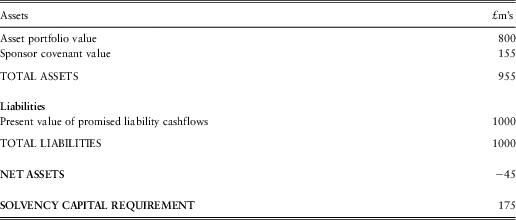
In the examples produced in this section, there is insufficient available capital to meet the 1-year 99.5% VaR capital requirement in both the A-rated and BB-rated sponsor cases. In the credit-risky sponsor cases, the Solvency Capital Requirement has been calculated at 12% to 18% of the liability valuation. It should also be noted that the example has only considered a sub-set of all the risks that would likely need to be considered in reality in the implementation of this capital assessment process. Longevity risk and inflation risk are perhaps the most obvious examples of omitted risks whose inclusion would further increase the Solvency Capital Requirement.
So this analysis could lead to an expectation of a Solvency Capital Requirement of 15%–20% or more of the liability valuation for DB pension funds with characteristics similar to those of the examples used in this section. Given the liability cashflows have a duration of around 16 years in the example, this magnitude of capital buffer is roughly equivalent to the impact of reducing the discount rates used in the valuation of the liability cashflows by around 100 basis points. In other words, total assets of the holistic balance sheet are required to have a market-consistent value equal to at least the value of the liability cashflows when discounted at risk-fee minus 100 basis points. The quid pro quo is that those total assets now explicitly include the market-consistent value of the sponsor covenant. As we have seen in the examples of section 2.6, the sponsor covenant valuation will be highly sensitive to sponsor credit rating, to the pace of deficit contribution funding that is assumed in the valuation.
The following section discusses what risk management actions could be incentivised for a Defined Benefit pension fund attempting to meet the capital adequacy approach developed in this paper.
4.3 Risk management strategies and incentives created by this capital assessment framework
The examples of section 4.2 illustrate how the market-consistent 1-year 99.5% VaR capital requirement methodology could produce solvency capital requirements that are highly demanding for the typical complexion of UK DB pension funds. Strategies for generating a balance sheet with net assets in excess of the capital requirements could be grouped into three categories:
1. Strategies to increase the holistic balance sheet's total assets.
2. Strategies to reduce the holistic balance sheet's liabilities.
3. Strategies to reduce the solvency capital requirement.
This is certainly a topic deserving of dedicated research, particularly in the context of important real-life complexities such as the presence of the Pension Protection Fund and its impact on risk management incentives. However, each of the above categories is briefly discussed in turn below.
4.3.1 Strategies to increase the holistic balance sheet's total assets
In general, the value of the sponsor covenant on the holistic balance sheet can be increased by increasing the size, improving the credit quality and/or accelerating the timing of the future sponsor contributions produced by the assumed contribution strategy. It is self-evident that promising to pay more and to pay it sooner will generally increase the value of the sponsor covenant. The simulation framework provides the flexibility to investigate a wide range of contribution strategies that may differ in terms of how much they promise to pay in what circumstances. It may also be possible to improve the credit quality of the promised contributions by creating some form of collateral arrangement with the sponsor, for example, through the use of contingent assets. We have already seen some activity of this kind in the UK DB pension fund sector, and a risk-based capital framework could accelerate the use of this type of mechanism. Of course, such approaches will not be free lunches for the sponsor: they essentially put the pension fund members up the pecking order of corporate debt, and in general this will increase the cost of raising corporate debt for the sponsor business.
4.3.2 Strategies to reduce the holistic balance sheet's liabilities
In some cases the holistic balance sheet framework might highlight the financial status of DB pension funds and their sponsors, making the possibility that not all promised pension payments are going to be made by the sponsor increasingly visible to trustees and members. This may mean members are more inclined to support a reduction in the cost of the promised pension payments by accepting cash values that recognise the credit risk of the sponsor and are hence lower than the value of the pension promise when valued on a risk-free basis.
4.3.3 Strategies to reduce the solvency capital requirement
In the examples of section 4.2, the capital requirement was a significant 13%–19% of the liability valuation for the credit-risky sponsors. There may be a number of financial market hedging activities that the pension fund could pursue that would significantly reduce this capital requirement. For example, the yield curve risk capital requirement could be significantly mitigated by lengthening the duration of the bond portfolio or through the use of interest rate swaps; the risky asset portfolio risk capital requirement could be significantly mitigated by switching into lower risk assets or through hedging strategies such as the use of futures contracts or put options; the general credit spread capital requirement could be mitigated through the use of index credit default swaps. Similarly, for non-market risks not considered in these examples such as longevity risk, a growing market in longevity insurance or hedging has been gradually emerging over many years that would perhaps be further incentivised by this risk-based framework.
All of these risk mitigation strategies will generally reduce the total expected return on the pension fund assets. And whilst the market-consistent 1-year VaR capital adequacy framework is unaffected by changes in the ‘real-world’ expected asset return, the sponsor may nonetheless view it as a relevant metric.
The mitigation of the sponsor-specific credit downgrade/default risk is particularly interesting. At a conceptual level, this risk exposure is very inefficient – for under-funded pensions funds, the pension fund members may be bearing very significant exposure to a single undiversified credit issuer. There is an obvious risk diversification benefit to be generated by sharing this risk with someone else.
This credit risk reduction could be achieved through holding some credit default swaps on the sponsor within the pension fund asset portfolio. Another, perhaps more radical, approach could be to take the promised contribution cashflow strategy as assumed in the valuation of the sponsor covenant and convert it into a financial asset through securitisation. In theory, this would convert the sponsor covenant valuation on the holistic balance sheet into a cash asset (which would not be reduced in value under the various stresses discussed in section 4.2). Or there may be a sponsor risk mutualisation strategy that the pension fund sector could pursue that does not directly involve securitising the contribution commitments on the financial markets, but that entails pension funds exchanging each others’ sponsor covenant ‘securities’. The Pension Protection Fund could be viewed as a government-mandated approach to this debt mutualisation idea.
In summary, there is a rich and complex set of risk management possibilities that are created from the economic insights provided by the holistic balance sheet framework, and this is a natural area for further research.
5. Summary and Conclusions
The commitment of Defined Benefit pension funds’ sponsors to make the contributions in the future that are required to fund the current high levels of pension fund deficits is an increasingly important asset for UK schemes. This paper has developed approaches to applying market-consistent techniques to the valuation of this sponsor covenant as an asset on a market-based ‘holistic’ balance sheet.
Section 2 developed a Monte-Carlo simulation modelling framework that could be used for this valuation purpose. The benefit of this stochastic simulation approach is its flexibility – it was demonstrated how this approach could allow for the key areas of complexity that can make market-consistent sponsor covenant valuation technically challenging: sponsor credit risk; ongoing volatility in the deficit level and the uncertainty and path-dependency in contribution payments that it creates; the likelihood of higher sponsor default rates being experienced in the economic environments that generate higher deficits (wrong-way risk).
The results produced by applying this approach to a number of illustrative cases were generally intuitive. However, as in other long-term liability sectors such as life insurance, the application of market-consistent techniques in the current economic and financial market environment can produce solvency results that are challenging for the DB pension fund sector. Section 2.7 analysed the sensitivity of the balance sheet valuation results to starting market conditions. This sensitivity analysis suggested that the returns of long-term risk-free interest rates and credit spreads to their historical averages would result in a significant improvement in the net asset position of the holistic balance sheet.
Whilst the flexibility of the Monte-Carlo simulation approach is required to fully capture all forms of complexity that can arise in the valuation of the sponsor covenant, its implementation may not be practical for every DB pension fund. Section 3 developed a formula-based valuation method as a simpler alternative. This method is again focused on the application of a market-consistent valuation approach, but its relative simplicity means that it cannot capture some of the features that can be present in sponsor covenant valuation – in particular, the impacts of deficit volatility and wrong-way risk on the valuation. This tends to result in the formula method systematically under-valuing the sponsor covenant, though case study results suggested the results would be within 5%–20% of the full Monte-Carlo valuation for pension funds with characteristics typical of the UK sector today.
Section 4 of the paper considered how the market-consistent balance sheets constructed in sections 2 and 3 could be used in solvency capital assessment. In particular, the assessment of capital requirements defined as the 1-year 99.5% Value-at-Risk of the holistic balance sheet was considered. Examples developed in this section produced capital requirements of 10%–20% of the market-consistent valuation of pension fund liabilities. These examples highlighted that the capital requirement would be highly sensitive to the assumed credit quality of the sponsor. In the limiting case, a risk-free sponsor would result in zero solvency capital requirements. More generally, the sponsor acts as a loss absorber for the pension fund, and the higher the credit quality of the sponsor, the greater their ability to absorb risk and thereby reduce the risk-based capital requirements of the pension fund.
These topics of market-consistent sponsor covenant valuation and its use in DB pension solvency capital assessment are relatively nascent for the actuarial profession, yet are also highly topical and with potentially challenging implications for pension fund stakeholders. There are many areas of further research that can be developed from the themes explored in this paper in order to further the profession's technical knowledge and understanding of the market-consistent approach to DB pension solvency assessment. We anticipate this may have ongoing relevance both for the measurement of the security of promised pension fund benefits and in providing insight into how risks identified by the market-consistent approach can be efficiently managed.
Appendix A: Approximate valuation of the sponsor commitment in Section 2.5.4
Below we develop a closed-form approximation for the sponsor covenant valuation in the example described in section 2.5.4Footnote 25.
Consider the following model:
• Sponsor credit rating:
○
 $$${{Z}_D}\, \in \,N({\rm{0}},{\rm{1}})$$$
represents credit state of sponsor
○ Sponsor defaults if
$$${{Z}_D}\,\leq \,{{{\rm{\rPhi }}}^{{\rm{ - }}1}} ({{Q}_D})$$$
where QD is their risk-neutral probability of default. Let
$$${{T}_D}\, = \,{{{\rm{\rPhi }}}^{{\rm{ - }}1}} ({{Q}_D})$$$
denote the ‘default threshold’.
• Pension assets:
○
$$${{A}_T}\, = \,{{A}_0}\it exp \left[ {\left( {r\,{\rm{ - }}\,\frac{{\rm{1}}}{{\rm{2}}}{{\sigma }^{\rm{2}}} } \right)T\, + \,\sigma \sqrt T {{Z}_A}} \right] $$$
where
$$${{Z}_A}\, \in \,N({\rm{0}},{\rm{1}})$$$
under risk-neutral measure.
• Dependency between sponsor credit rating and pension assets:
○ ZD, ZA are bivariate standard normal and Corr(ZD, ZA) = ρ
○ Without loss of generality, write
$$${{Z}_A}\, = \,\rho {{Z}_D}\, + \,\sqrt {{\rm{1}}\,{\rm{ - }}\,{{\rho }^{\rm{2}}} } {\epsilon}$$$
where
$$${\epsilon}\, \in \,N({\rm{0}},{\rm{1}})$$$
and Corr(ZD, ε) = 0






We want to value a put option with payoff:
 $${\rm{Payoff}}\, = \,\max \left( {{\rm{0}},{\rm{L}}\,{\rm{ - }}\,{{{\rm{A}}}_{\rm{T}}}} \right)\,\times \,\left( {1\,{\rm{ - }}\,\left( {1\,{\rm{ - }}\,{{\rdelta }}} \right){{{\rm{l}}}_{{\rm{default}}}}} \right)$$
where ldefault is the default indicator function (=1 if sponsor defaults and 0 otherwise) and δ is a recovery rate.
The value of this option is:
 $${V\, = \,{{e}^{{\rm{ - }}rT}} {{E}_Q}[\max (0,{\rm{L}}\,{\rm{ - }}\,{{{\rm{A}}}_{\rm{T}}})\,\times \,(1\,{\rm{ - }}\,({\rm{1}}\,{\rm{ - }}\,\rdelta ){{{\rm{l}}}_{{\rm{default}}}}] \cr V\, = \,{{e}^{{\rm{ - }}rT}} {{E}_Q}[\max (0,{\rm{L}}\,{\rm{ - }}\,{{{\rm{A}}}_{\rm{T}}})]\,{\rm{ - }}\,({\rm{1}}\,{\rm{ - }}\,\rdelta ){{e}^{{\rm{ - }}rT}} {{E}_Q}[\max (0,{\rm{L}}\,{\rm{ - }}\,{{{\rm{A}}}_{\rm{T}}})\,\times \,{{{\rm{l}}}_{{\rm{default}}}}] \cr V = {{V}_{B{\rm{ - }}S}}({{{\rm{A}}}_{\rm{0}}},\,{\rm{L}},\,{\rm{T,}}\,r,\,\sigma )\,{\rm{ - }}\,({\rm{1}}\,{\rm{ - }}\,\rdelta ){{e}^{{\rm{ - }}rT}} {{E}_Q}[\max (0,{\rm{L}}\,{\rm{ - }}\,{{{\rm{A}}}_{\rm{T}}})\,\times \,{{{\rm{l}}}_{{\rm{default}}}}] \\ $$
where  $$${{V}_{B{\rm{ - }}S}}({{{\rm{A}}}_{\rm{0}}},\,{\rm{L}},\,{\rm{T,}}\,r,\,\sigma )$$$
is the Black-Scholes price put price.
Now consider the second term:
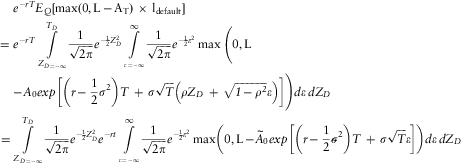 $${ {{e}^{{\rm{ - }}rT}} {{E}_Q}[\max (0,{\rm{L}}\,{\rm{ - }}\,{{{\rm{A}}}_{\rm{T}}})\,\times \,{{{\rm{l}}}_{{\rm{default}}}}] \cr = \ {{e}^{{\rm{ - }}rT}} \mathop{\int}\limits_{{{Z}_{D\, = \,{\rm{ - }}\infty }}}^{{{T}_D}} {\frac{1}{{\sqrt {2\pi } }}{{e}^{{\rm{ - }}\frac{1}{2}Z_{D}^{2} }} } \mathop{\int}\limits_{_{{{\epsilon}\, = \,{\rm{ - }}\infty }} }^\infty {\frac{1}{{\sqrt {2\pi } }}{{e}^{{\rm{ - }}\frac{1}{2}{{{\epsilon}}^2} }} \max \Bigg({\rm{0}},{\rm{L}}} \cr {\rm{ - }}{{A}_0}\it exp \left[ {\left( {r\,{\rm{ - }}\,\frac{{\rm{1}}}{{\rm{2}}}{{\sigma }^{\rm{2}}} } \right)T\, + \,\sigma \sqrt T \left( {\rho {{Z}_D}\, + \,\sqrt {1\,{\rm{ - }}\,{{\rho }^2} } {\epsilon}} \right)} \right]\Bigg)d{\epsilon}\,d{{Z}_D} \cr \!\!\!\!\!\!\!\!= \mathop{\int}\limits_{{{Z}_{D\, = \,{\rm{ - }}\infty }}}^{{{T}_D}} {\frac{1}{{\sqrt {2\pi } }}{{e}^{{\rm{ - }}\frac{1}{2}Z_{D}^{2} }} {{e}^{{\rm{ - }}rt}} } \mathop{\int}\limits_{_{{{\epsilon}\, = \,{\rm{ - }}\infty }} }^\infty {\frac{1}{{\sqrt {2\pi } }}{{e}^{{\rm{ - }}\frac{1}{2}{{{\epsilon}}^2} }} \max \left( {{\rm{0}},{\rm{L}}\,{\rm{ - }}\!\!\!{{{{\rm{{\vskip-7pt\hskip10pt\tilde}{\!\!\!\it A}}}}}_{\rm{0}}}\it exp \left[ {\left( {r\,{\rm{ - }}\,\frac{{\rm{1}}}{{\rm{2}}}{{{\tilde{\sigma }}}^{\rm{2}}} } \right)T\, + \,\sigma \sqrt T {\epsilon}} \right]} \right)d{\epsilon}\,d{{Z}_D}} \cr}$$
where:
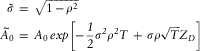 $${ \tilde{\sigma }\, = \,\sqrt {{\rm{1}}\,{\rm{ - }}\,{{\rho }^2} } \cr {{{{\rm{\vskip-7pt\hskip10pt\tilde}{\!\!\!\it A}}}}}_{\rm{0}}\, = \,{{{{A}}}_{\rm{0}}}\,\it exp \left[ {{\rm{ - }}\frac{1}{2}{{\sigma }^2} {{\rho }^2} T\, + \,\sigma \rho \sqrt T {{Z}_D}} \right] $$
Therefore:
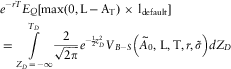 $${ &#x0026; {{e}^{{\rm{ - }}rT}} {{E}_Q}[\max (0,{\rm{L}}\,{\rm{ - }}\,{{{\rm{A}}}_{\rm{T}}})\,\times \,{{{\rm{l}}}_{{\rm{default}}}}] \cr = \mathop{\int}\limits_{{{Z}_D}\, = \,{\rm{ - }}\infty }^{{{T}_D}} {\frac{2}{{\sqrt {2\pi } }}{{e}^{{\rm{ - }}\frac{1}{2}z_{D}^{2} }} {{V}_{B{\rm{ - }}S}}\left( \!\!\!{{{{{\rm{\vskip-7pt\hskip10pt\tilde}{\!\!\!\it A}}}}}_{\rm{0}}},\,{\rm{L,}}\,{\rm{T,}}\,r{\rm{,}}\,\tilde{\sigma }} \right)} d{{Z}_D} \cr}$$
This integral needs to be estimated numerically.
An approximate solution can be obtained by approximating 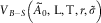 $$${{V}_{B{\rm{ - }}S}}\left( \!\!\!{{{{{\rm{\rm{\vskip-7pt\hskip10pt\tilde}{\!\!\!\it A}}}}}_{\rm{0}}},\,{\rm{L,}}\,{\rm{T,}}\,r{\rm{,}}\,\tilde{\sigma }} \right)$$$
as a linear function of ZD. A Taylor expansion around the default threshold TD gives:
 $${ {{V}_{B{\rm{ - }}S}}\left \rm \Big( \!\!\!\!{\vskip-7pt\hskip10pt\tilde}\!\!\!\it A}}}}}_{\rm{0}}}({{Z}_D}),\,{\rm{L,}}\,{\rm{T,}}\,r{\rm{,}}\!\!\!{\vskip-5pt\hskip10pt\tilde}{\!\!\sigma } \right) \cong {{V}_{B{\rm{ - }}S}}\left( \!\!\!\!{{{{{\rm{\vskip-7pt\hskip10pt\tilde}{\!\!\!\it A}}}}}_{\rm{0}}}({{T}_D}),\,{\rm{L,}}\,{\rm{T,}}\,r{\rm{,}}\,\tilde{\sigma }} \right) \cr \, \quad+ \,{{{\rm{\rDelta }}}_{B \minus S}}\left( \!\!\!\!{{{{{\rm{\vskip-7pt\hskip10pt\tilde}{\!\!\!\it A}}}}}_{\rm{0}}}({{T}_D}),\,{\rm{L,}}\,{\rm{T,}}\,r{\rm{,}}\,\tilde{\sigma }} \right)\frac{{\partial \!\!\!{{{{\rm{{\vskip-7pt\hskip10pt\tilde}{\!\!\!\it A}}}}}_{\rm{0}}}}}{{\partial {{Z}_D}}}{{|}_{{{Z}_D}\, = \,{{T}_D}}}\,({{Z}_D}\,{\rm{ - }}\,{{T}_D}) = {{A}}\, + \,{{B}}{{Z}_D} \cr}$$
where:
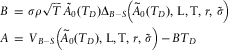 $${ {{B}}\, = \, \sigma \rho \sqrt T \!\!{{{{{{\vskip-3pt\hskip10pt\tilde}{\!\!\!\it A}}}}}_{\rm{0}}}({{T}_D}){{\rDelta }_{B{\rm{ - }}S}}\left( \!\!\!\!{{{{{\rm{\vskip-7pt\hskip10pt\tilde}{\!\!\! \it A}}}}}_{\rm{0}}}\left( {{{T}_D}} \right),\,{\rm{L,}}\,{\rm{T}},\,r,\,\tilde{\sigma }} \right) \cr {{A}}\, = \,{{V}_{B{\rm{ - }}S}}\left( \!\!\!\!{{{{{\rm{\vskip-7pt\hskip10pt\tilde}{\!\!\!\it A}}}}}_{\rm{0}}}\left( {{{T}_D}} \right),\,{\rm{L,}}\,{\rm{T}},\,r,\,\tilde{\sigma }} \right)\,{\rm{ - }}\,{\it{B}}{{{\it{T}}}_D} \cr}$$
Inserting this approximation into the integral:
 $${{ {{e}^{{\rm{ - }}rT}} {{E}_Q}[\max (0,{\rm{L}}\,{\rm{ - }}\,{{{\rm{A}}}_{\rm{T}}}) &#x0026; \,\times \,{{{\rm{l}}}_{{\rm{default}}}}] = \mathop{\int}\limits_{{{Z}_D} = \minus \infty }^{{{T}_D}} {\frac{1}{{\sqrt {2\pi } }}{{e}^{{\rm{ - }}\frac{1}{2}Z_{D}^{2} }} (A\, + \,B{{Z}_D})d{{Z}_D}\, = \,A{\rm{\rPhi }}({{T}_D})\,{\rm{ - }}\,B\frac{1}{{\sqrt {2\pi } }}{{e}^{{\rm{ - }}\frac{1}{2}{{T}}_{D}^{2} }}}} \cr \qquad\qquad\qquad\qquad\qquad\qquad\qquad\ = A{{Q}_D}\,{\rm{ - }}\,B\frac{1}{{\sqrt {2\pi } }}{{e}^{{\rm{ - }}\frac{1}{2}T_{D}^{2} }} \cr}$$
Finally, the approximate option value is:
 $$V = {{V}_{B - S}}({{A}_0},\,L,\,T,\,r,\,\sigma )\,{\rm{ - }}\,(1\,{\rm{ - }}\,\rdelta )\left( {A{{Q}_D} - B\frac{1}{{\sqrt {2\pi } }}{{e}^{{\rm{ - }}\frac{1}{2}{\rm{T}}_{D}^{2} }} } \right)$$
Note that the first term in this expression,  $$${{V}_{B \minus S}}({{A}_0},\,L,\,T,\,r,\,\sigma )(1\,{\rm{ - }}\,(1\,{\rm{ - }}\,\rdelta ){{Q}_D})$$$
is the price of the option if ρ = 0 (i.e. sponsor default is independent from the value of pension assets). The second term is an adjustment for non-zero ρ.
Appendix B: Mathematical specification of the Black-Karasinski Model used in Section 2.6
The basic form of the Black-Karasinski model is:
 $$d\,\ln \left[ {r\left( t \right)} \right]\, = \,\ralpha \left( {\mu \,{\rm{ - }}\,{\rm{ln}}\left[ {{\rm{r(t)}}} \right]} \right)\, + \,\sigma dZ(t)$$
where r(t) is the instantaneous short rate at time t; and dZ(t) is a standard Brownian motion.
The implementation of the model used in this paper makes two key extensions to the above model dynamics. First, the model is extended to a 2-factor version of the model in the following way:
 $${d\,\ln \left[ {r\left( t \right)} \right]\, = \,{{\ralpha }_{\rm{1}}}\left( {\ln \left[ {m(t)} \right]\,{\rm{ - }}\,{\rm{ln}}\left[ {{\rm{r(t)}}} \right]} \right)\, + \,{{\sigma }_{\rm{1}}}dZ(t) \cr d\ln \left[ {m\left( t \right)} \right]\, = \,{{\ralpha }_{\rm{2}}}\left( {\mu \,{\rm{ - }}\,{\rm{ln}}\left[ {{\rm{m(t)}}} \right]} \right)\, + \,{{\sigma }_{\rm{2}}}dZ(t) $$
The key benefit of this extension of the model is that it can generate imperfect correlation between the changes in yields with different terms to maturity – in the 1-factor version, a single source of volatility drives the entire yield curve and so the whole yield curve is perfectly correlated and all points on the yield curve move up or down in unison.
The second extension made to the model is to generalise the μ parameter so that it is a deterministic function of time μ (t). This allows the starting yield curve of the model to be perfectly fitted to the yield curve observed at the valuation date.



