Introduction
The reception of chemical substances in the environment is crucial for the survival of insects. These substances encompass volatile compounds released by plants, microbial metabolites present in the soil, and pheromones secreted by other insects (Peitong et al., Reference Peitong, Ru, Guonian, Mengli and Yirong2024; Sandoz, Reference Sandoz2011). Insects utilise the perception of chemical signals to locate food sources, seek mates, and identify habitats (Fahad Raza et al., Reference Fahad Raza, Anwar, Husain, Rizwan, Li, Nie, Hlaváč, Ali, Rady and Su2022; Paoli and Galizia, Reference Paoli and Galizia2021). During this process, bees sustain themselves by foraging for pollen and nectar. Factors such as the colour, shape, structure, and fragrance of flowers significantly influence bee foraging behaviour (Parachnowitsch and Kessler, Reference Parachnowitsch and Kessler2010; Pel et al., Reference Pel, Van Nest, Hathaway and Fahrbach2023; Su et al., Reference Su, Ma, Zhang, Hu, Ding, Jiang and Huang2022), with floral volatiles being one of the primary determinants affecting this behaviour (Bisrat and Jung, Reference Bisrat and Jung2022; Dötterl and Vereecken, Reference Dötterl and Vereecken2010). Through extensive evolutionary processes, bees have developed a highly sensitive olfactory system that enables them to perceive and process the complex and diverse chemical information present in their environment (Ha and Smith, Reference Ha and Smith2022; Laska et al., Reference Laska, Galizia, Giurfa and Menzel1999; Ramírez et al., Reference Ramírez, Fagundez, Grosso, Argibay, Arenas and Farina2016). Furthermore, bees rely on this acute olfactory system for critical activities such as foraging for food sources, selecting oviposition sites, engaging in communication, and reproduction (Sandoz, Reference Sandoz2011).
The recognition of external odorant molecules by insects is a complex process that involves various olfactory-related chemosensory proteins, among which odorant receptors (ORs) are critical olfactory sensory proteins. These receptors can activate neural signals by binding to specific volatile compounds, enabling insects to distinguish between different types of odour (Schmidt and Benton, Reference Schmidt and Benton2020; Yan et al., Reference Yan, Jafari, Pask, Zhou, Reinberg and Desplan2020). Chemical stimuli are detected by ORs located on the cilia of olfactory sensory neurons (OSNs) (DeMaria and Ngai, Reference DeMaria and Ngai2010). Research on insect olfactory receptor genes initially emerged following the genome sequencing of Drosophila melanogaster (Diptera: Drosophilidae). Subsequently, investigations into honeybee olfactory receptors commenced in 2006 with the genomic sequencing of Apis mellifera ligustica, which led to the identification of 170 putative olfactory receptor genes (Robertson and Wanner, Reference Robertson and Wanner2006). These investigations provide foundational data for understanding how Apis mellifera ligustica utilise their olfactory systems during foraging behaviour. While extensive research has characterised ORs and odour-binding proteins in bees, the upstream regulatory mechanisms controlling olfactory gene expression remain poorly understood.
The Hedgehog (Hh) signalling pathway, particularly its core component Smoothened (Smo), has emerged as a potential regulator of olfactory function across various species. Smo, a member of the G protein-coupled receptor (GPCR) family (Kristiansen, Reference Kristiansen2004), plays a pivotal role in olfactory receptor trafficking, as evidenced by both Smo gene knockdown and inhibitor treatment experiments in murine models. Experimental findings demonstrate that Smo downregulation leads to attenuated olfactory behavioural responses (Sanchez et al., Reference Sanchez, Alkhori, Hatano, Schultz, Kuzhandaivel and Jafari2016). Bardet–Biedl syndrome demonstrates that anosmia is a consequence of impaired cilia function in patients (Abou et al., Reference Abou, Wissam, Lo and Nauli2009). The absence of cilia leads to the inability of Smo to be activated and the disruption of Hh signalling pathway (Huangfu et al., Reference Huangfu, Liu, Rakeman, Murcia, Niswander and Anderson2003). However, despite these advances in model systems, the specific function of Smo in honeybee olfaction remains unexplored.
As a crucial pollinator, the foraging behaviour of honeybees is intimately linked to their olfactory function. The current research has primarily focused on the functional characterisation of protein related with olfactory, while investigations into the regulatory mechanisms by which upstream signalling pathways control protein related with olfactory expression remain relatively limited. In our previous studies, we found that activation and inhibition of Smo both significantly alter the expression patterns of key olfactory receptor genes (OR151, OR152, and OR2), thereby regulating olfactory-mediated behaviours (Guo et al., Reference Guo, Wang, Yu, Zhang, Zhang and Guo2024). However, the regulatory mechanism of this protein in the olfactory system of bees remains unclear. Through transcriptome sequencing, this study systematically analysed the expression changes of olfactory-related protein genes in honeybees under both activated and inhibited states of the Smo signalling pathway, revealing a novel mechanism by which this pathway regulates chemosensory function. This provides important insights into the olfactory regulatory network of pollinating insects.
In this investigation, Apis mellifera ligustica was selected as the model organism to elucidate the regulatory effects of AmelSmo protein on olfactory behaviour-related genes and signalling pathways. Through the administration of inhibitors and agonists, coupled with transcriptome sequencing analysis, we examined gene expression patterns to establish the theoretical foundation for understanding both the functional role of Smo protein in Apis mellifera ligustica and the underlying mechanisms of olfactory recognition in honeybees.
Materials and methods
Test insects
The Apis mellifera ligustica specimens utilised in this study were obtained from the experimental apiary at the College of Animal Science, Shanxi Agricultural University. Foraging worker bees with pollen loads on their hind legs were collected from the entrance of healthy, robust honey bee colonies that had not experienced swarming. The collected specimens were housed in wooden enclosures measuring 12 cm × 12 cm × 5 cm, with 20 worker bees allocated per enclosure. A total of 1,200 worker bees were distributed across 60 enclosures, which were subsequently divided into four experimental groups, each comprising 15 enclosures containing 300 specimens. Prior to the formal experiment, we conducted preliminary tests to determine optimal treatment conditions. Four concentration gradients (0, 200, 500, and 800 μg/mL) of both cyclopamine (the inhibitor) and purmorphamine (the agonist) were administered to bees for 24 and 48 h, followed by qPCR analysis of antennal Smo expression levels. The results demonstrated that (1) 200 μg/mL cyclopamine treatment for 24 h yielded the most significant Smo downregulation (optimal inhibition efficiency), and (2) 800 μg/mL purmorphamine treatment for 48 h induced the highest Smo expression (optimal activation effect). These optimised parameters were consequently selected for the formal experiment (Guo et al., Reference Guo, Wang, Yu, Zhang, Zhang and Guo2024).
Worker bees were subjected to distinct feeding protocols: one cohort received 30% sucrose solution containing 200 μg/mL cyclopamine (inhibitor) for 24 h, while another cohort was administered 30% sucrose solution with 800 μg/mL purmorphamine (agonist) for 48 h. Two control groups were established, receiving only 30% sucrose solution for 24 and 48 h, respectively. The volume of all solutions was standardised at 2 mL. The specimens were incubated in a thermostatic hygrostatic chamber maintained at 30 ± 2°C with relative humidity of 65% ± 5% in wooden containers. Upon completion of incubation, the honey bee antennae were excised using forceps, flash-frozen in liquid ammonia, and stored at −80°C for subsequent analysis.
Total RNA extraction and quality assessment
In this investigation, total RNA was extracted from Apis mellifera ligustica worker bee antennae using Trizol reagent, encompassing four distinct feeding conditions: 30% sucrose solution for 24 h (YYC), 30% sucrose solution containing 200 μg/mL cyclopamine for 24 h (YY), 30% sucrose solution for 48 h (YJC), and 30% sucrose solution containing 800 μg/mL purmorphamine for 48 h (YJ). Three biological replicates were extracted from each group, designated as YYC1-3, YY1-3, YJC1-3, and YJ1-3, with each sample derived from antennal tissue of 100 worker bees. RNA quality was evaluated through agarose gel electrophoresis, while purity and concentration were determined using a NanoDrop2000 spectrophotometer. RNA integrity was precisely assessed using an Agilent2100 Bioanalyzer to ensure sample suitability for transcriptome sequencing.
Construction, quality control, and sequencing of complementary DNA libraries
Following mRNA enrichment and fragmentation, cDNA synthesis was performed via reverse transcription, followed by Illumina adapter ligation and library enrichment. Subsequently, paired-end sequencing of the cDNA library was conducted using the HiSeq 2000 sequencing platform. The entire process of library construction, sequencing, and quality assessment and control of raw data was executed by Shanghai Sangon Biotech Engineering Technology & Services Co., Ltd.
Sequence alignment and filtration of genomic data
To ensure analytical integrity, the raw sequencing data underwent quality filtration to remove adapter sequences and low-quality reads, yielding high-quality clean data for downstream analysis. Using Trimmomatic software, we processed the sequencing data according to the following criteria: low-quality segments and fragments containing adapters and poly-N sequences were eliminated, retaining only high-quality reads with Phred quality scores >20 for subsequent analyses. A random subset of 10,000 clean sequence reads was extracted and compared against the NCBI database to analyse species distribution and assess potential contamination. The sequencing reads that passed quality control were aligned to the reference genome using HISAT2 software, followed by statistical analysis using RSeQC for comprehensive mapping assessment and quality metrics evaluation. All paired-end reads of 100 base pairs of raw sequence data have been deposited in the NCBI Short Read Archive database under accession number PRJNA1212903. The Apis mellifera ligustica reference genome and its genome annotation files were retrieved from the NCBI FTP server (ftp://ftp.ncbi.nlm.nih.gov/genomes/all/GCF/003/254/395/GCF_003254395.2_Amel_HAv3.1/) for sequence alignment analysis.
Analysis of gene expression levels and functional annotation
Statistical analyses were performed on gene expression data across treatment and control groups to identify significantly differentially expressed gene (DEG) sets. For experiments with biological replicates, differential expression analysis was conducted using DESeq software, while EBSeq software was employed for experiments without biological replication. In identifying DEGs, gene expression levels were quantified and normalised using HTSeq software in conjunction with the RPKM (Reads Per Kilobase of transcript per Million mapped reads) criterion. Multiple testing threshold P-values were calculated using false discovery rate, with differential expression criteria set at Q value < 0.05 and fold change > 1.2. The identified DEGs were subjected to functional annotation analysis using GO and KEGG pathways. Functional enrichment analysis was conducted using topGO and clusterProfiler packages. Functions were considered significantly enriched when the adjusted P-value (Q-value) was <0.05.
Validation of RNA-Seq expression profiles through quantitative real-time PCR analysis
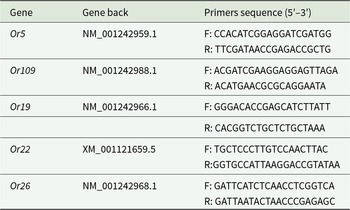
Five DEGs associated with olfactory function were selected for qRT-PCR validation of RNA-Seq data. The RNA samples returned from the transcriptome sequencing facility were reverse transcribed to cDNA. The synthesised cDNA templates were subsequently analysed following the manufacturer’s protocol for TB Green® Premix Ex Taq™ (Tli RNaseH Plus) detection kit. Reaction system composition: 5 μL of TB Green® Premix Ex Taq™ (Tli RNaseH Plus), 0.5 μL each of forward and reverse primers (10 μmol/L), 500 ng of cDNA template, with ddH2O added to achieve a final volume of 10 μL. The thermal cycling protocol consisted of initial denaturation at 95°C for 3 min, followed by 40 cycles of denaturation at 95°C for 5 s, annealing at 57°C for 30 s, and extension at 72°C for 30 s. The melting curve analysis was performed with denaturation at 95°C for 10 s and annealing at 52°C for 5 s. In this study, Actin-related protein 1 (Arp1) of Apis mellifera ligustica (GenBank accession number: NM_001185145.1) was selected as the internal reference gene. All experimental groups were conducted with three biological replicates and three technical replicates. The primer sequences used are listed in table 1.
Synthesis sequence of primers of genes

Results and analysis
Transcriptomic sequencing analysis and evaluation
In this study, a total of 673,647,356 reads were obtained, comprising 330,946,078 reads from the inhibitor group and 342,701,278 reads from the agonist group. After quality control, 645,843,492 clean reads were retained. The GC content ranged from 42.11% to 45.48%, with Q20 values exceeding 98.90% and Q30 values above 95% across all groups (table 2), indicating high reliability of the sequencing data. Approximately 95.47% to 97.23% of clean reads from the inhibitor group were successfully mapped to the Apis mellifera ligustica reference genome, while the agonist group showed mapping rates of 96.59% to 97.27%. Within the reference sequence, uniquely mapped reads constituted approximately 92.78% to 94.11% for the inhibitor group, and 93.90% to 94.83% for the agonist group. Using StringTie for genomic alignment and assembly of all datasets, followed by comparative analysis with known gene models using GffCompare, we identified 14,744 novel transcripts. Post-alignment analysis revealed the distribution ratios of 88% for exons, 7.40% for introns, and 4.05% for intergenic regions (table 3).
Overview of transcriptome data quality control

Regional distribution of reference genome comparison

Analysis of gene expression level
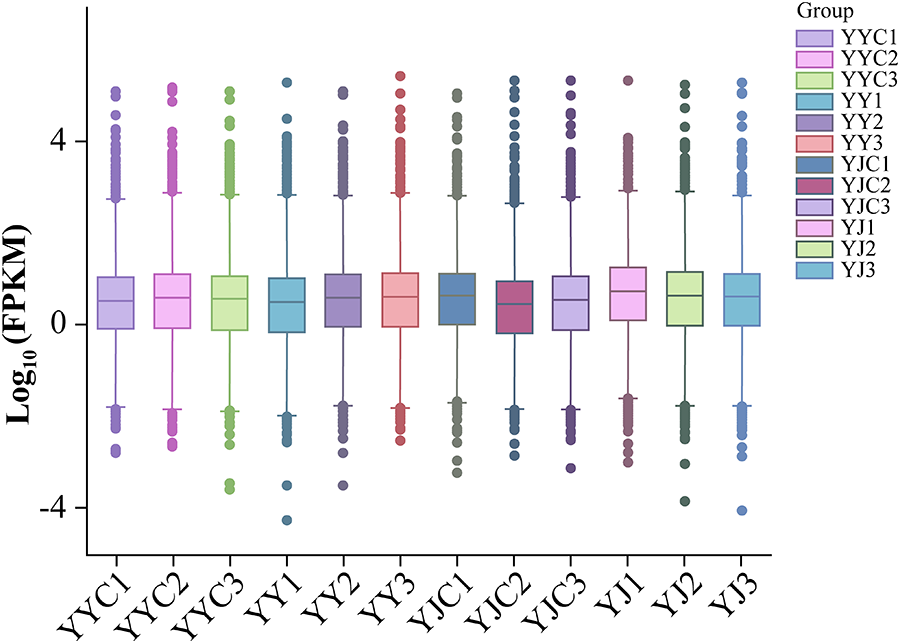
Gene expression levels are typically quantified through transcript abundance measurements, where higher abundance corresponds to elevated expression levels. Gene expression levels can be quantified in RNA-seq analysis by calculating the number of reads mapped to genomic loci or exonic regions. The gene expression density distribution of experimental samples exhibited a normal distribution pattern (fig. 1).
Distribution of gene expression values in each sample.

Transcriptome sample correlation analysis
After the sample quality inspection meets certain requirements, Pearson correlation analysis is conducted on the FPKM values of all genes in each group of samples. The results show that the square of the correlation coefficient R 2 within each group of samples is above 0.8, while the correlation coefficient R 2 between different groups of samples is above 0.6 (fig. 2). This indicates that the samples within each group have good repeatability after treatment, and there is a good degree of distinction between different groups. In summary, all samples show intergroup differences with high credibility, which are in line with the requirements for further analysis.
Intra-group and inter-group correlation heatmap of YY and YJ groups.

Differential expression gene screening
Differential expression analysis using DEGseq revealed 12,356 DEGs between the inhibitor-fed and control groups, with 276 significantly DEGs, comprising 115 upregulated and 161 downregulated genes (fig. 3A). The agonist-treated group exhibited 12,356 DEGs compared to the control group, with 672 significantly DEGs, including 145 upregulated and 527 downregulated genes (fig. 3B).
Volcano plot of expression differences between different comparison groups. (A) Differential gene volcano map of YY and YYC groups. (B) YJ and YJC group differential gene volcano map.

Functional enrichment of GO and KEGG
GO functional annotations are categorised into three primary domains: biological processes, molecular functions, and cellular components, which respectively characterise the biological engagement of gene products, their molecular activities, and subcellular localisation. GO functional annotation analysis was performed on DEGs between the Apis mellifera inhibitor-treated and control groups. The YY and YYC groups shared 64 categories, with the top 10 significantly enriched functions being: cell, cell part, cellular process, multicellular organismal process, metabolic process, biological regulation, organelle, developmental process, regulation of biological process, and binding (fig. 4A).
Differential gene GO classification chart. (A) YY vs YYC group differential gene GO classification chart. (B) YJ vs YJC group differential gene GO classification chart.

The DEGs between the agonist-treated and control groups were annotated, with both YJ and YJC groups exhibiting 64 distinct categories. The top 10 significantly enriched functional classifications were: cell, cell part, cellular process, biological regulation, binding, regulation of biological process, metabolic process, organelle, multicellular organismal process, and developmental process (fig. 4B).
KEGG pathway analysis revealed significant enrichment of 89 DEGs between the inhibitor and control groups across five functional categories: 16 genes in Cellular Processes, 11 in Environmental Information Processing, 5 in Genetic Information Processing, 36 in Metabolism, and 21 in Organismal Systems. The five most significantly enriched pathways were signal transduction, carbohydrate metabolism, amino acid metabolism, transport and catabolism, and endocrine system regulation (fig. 5A).
Results of KEGG enrichment of differentially expressed genes in Apis mellifera ligustica after inhibition and excitation. (A) YY and YYC groups showed different gene KEGG enrichment results. (B) YJ and YJC groups showed different gene KEGG enrichment results.

Between the agonist-treated and control groups, 353 genes exhibited significant enrichment across five functional categories: 70 genes in Cellular Processes, 59 in Environmental Information Processing, 26 in Genetic Information Processing, 100 in Metabolism, and 98 in Organismal Systems. The five most significantly enriched pathways were signal transduction, cellular community, transport and catabolism, endocrine system, and immune system (fig. 5B).
Molecular investigation of chemosensory gene expression in insect olfaction
Transcriptomic sequencing analysis revealed three differentially expressed olfactory receptor genes in the DEGs between YY and YYC groups: odorant receptor 19, odorant receptor 22, and odorant receptor 5. Meanwhile, two olfactory receptor genes were identified in the DEGs between YJ and YJC groups: odorant receptor 109 and odorant receptor 26. All five olfactory receptor genes exhibited downregulated expression patterns.
Validation of DEGs through quantitative reverse transcription polymerase chain reaction analysis
The RNA-Seq results of five olfactory receptor genes in Apis mellifera were validated using quantitative real-time PCR (qRT-PCR) for both inhibitor and agonist groups. The analysis revealed downregulated expression of Or5, Or19, Or109, Or26, and Or22 in Apis mellifera ligustica, which corroborated the RNA-Seq findings (table 4), thus confirming the reliability of the transcriptome sequencing data.
Identification of differentially expressed genes in Apis mellifera ligustica by qRT-PCR

Discussion
This investigation employed next-generation high-throughput sequencing technology to obtain extensive genomic sequences, enabling precise quantification of transcriptomes (Jacob, Reference Jacob2018). This research provides effective methodological approaches for investigating the inhibitory or excitatory effects of Smo on the olfactory mechanisms in Apis mellifera ligustica.
The results demonstrated that following the administration of inhibitors and agonists to Apis mellifera ligustica, the DEGs in antennal tissue exhibited significant GO enrichment in biological processes including cellular components, cellular partitions, and cellular processes. In the KEGG enrichment analysis, signal transduction emerged as the most significantly enriched pathway in both DEG groups. The DEGs from inhibitor-fed honeybees showed enrichment in GO terms including multicellular organismal process, metabolic process, and biological regulation, along with KEGG pathways comprising carbohydrate metabolism, Amino acid metabolism, transport and catabolism, and endocrine system. Conversely, the DEGs from agonist-fed honeybees exhibited enrichment in GO terms such as biological regulation, binding, regulation of biological process, and metabolic process, as well as KEGG pathways including cellular community, transport and catabolism, endocrine system, and immune system. Smo is a distant relative of GPCR, which mediates Hh signalling during embryonic development (Chen et al., Reference Chen, Taipale, Young, Maiti and Beachy2002). Therefore, DEG is most significantly enriched in signal transduction both in inhibiting and activating Smo gene, indicating that the change of Smo expression greatly affects the signal transduction process. Sonic Hedgehog (Shh) is a secreted protein that controls cell fate and mitosis in the developing nervous system, and the constituent active form of Smo (Smo-M2) mimics the concentration-dependent effects of Shh in the developing neural tube (Hynes et al., Reference Hynes, Ye, Wang, Stone, Murone, Sauvage and Rosenthal2000), in the GO term, DEGs fed with inhibitors and agonists were most significantly enriched in cell-related entries, suggesting that changes in Smo gene expression could affect cellular processes. Feeding method was used to inhibit and activate the Smo gene in Apis mellifera ligustica, which may be the reason for the enrichment of DEGs in the metabolic processes of amino acid metabolism and carbohydrate metabolism.
Transcriptome sequencing and quantitative analysis revealed that in Apis mellifera ligustica fed with either a Smo inhibitor or agonist, differentially expressed OR genes were downregulated compared to the sugar water control group. Previous research has demonstrated that in Drosophila, the Smo protein operates through the Hh signalling pathway (Ayers and Thérond, Reference Ayers and Thérond2010). Furthermore, the Hh pathway’s activity level influences both the sensitivity of OSNs to odorants and the proper localisation of olfactory receptors (ORs) to cilia (Sanchez et al., Reference Sanchez, Alkhori, Hatano, Schultz, Kuzhandaivel and Jafari2016). As a Smo antagonist, cyclopamine promotes the accumulation of Smo in cilia. While Smo localisation to cilia is a prerequisite for activation, this does not result in complete pathway activation. Mechanistically, cyclopamine binds to the ligand-binding pocket in the seven-transmembrane domain of Smo, thereby preventing the conformational changes required for its active state (Gigante and Caspary, Reference Gigante and Caspary2020). These findings suggest that administration of a Smo inhibitor to Apis mellifera ligustica could downregulate olfactory receptor (OR) genes, as Smo inactivation interferes with the Hh pathway’s regulatory control over OR expression and disrupts proper OR trafficking to cilia. In contrast, the Smo agonist purmorphamine exerts its effects through direct interaction with Smo’s seven-transmembrane domain, where it modulates activity by presumably stabilizing an active conformational state (Sinha and Chen, Reference Sinha and Chen2006). Our working hypothesis proposes that purmorphamine-mediated Smo activation occurs through conformational changes that release PTCH1-dependent suppression. However, this ligand-independent activation circumvents the physiological Hh-PTCH1 regulatory axis, potentially leading to pathological PTCH1 accumulation. According to established feedback mechanisms (Riobo, Reference Riobo2015), such elevated PTCH1 levels may subsequently compensate by suppressing Smo activity – paradoxically producing effects similar to Smo inhibition. In either case, the resultant disruption of OR trafficking to ciliary membranes would lead to compensatory downregulation of OR gene expression.
This bidirectional regulatory effect demonstrates that maintaining physiological Smo activity levels is essential for proper OR gene regulation. Using combined electroantennography and Y-tube olfactory assays, our team has established that administration of both agonist and antagonist compounds to Apis mellifera ligustica significantly alters the expression patterns of key olfactory receptor genes (OR151, OR152, and OR2), consequently modulating olfactory-mediated behaviours (Guo et al., Reference Guo, Wang, Yu, Zhang, Zhang and Guo2024). Building upon these findings, our transcriptomic analysis demonstrates consistent downregulation of olfactory-related genes among DEGs following modulation of Smo activity. These complementary results strongly suggest that AmelSmo functions as a critical regulator in the honeybee olfactory system. It should be specifically noted that the current study primarily focuses on molecular-level validation of regulatory mechanisms. Through integrated transcriptomic and qPCR analyses, we have established a clear correlation between Smo activity modulation and specific OR gene expression patterns. However, as behavioural assays were not included in this investigation, the direct functional relationship between this molecular regulatory mechanism and honeybee olfactory behaviour requires systematic validation in future studies. These findings not only reveal the evolutionarily conserved role of Smo in insect olfactory regulation but also provide novel mechanistic insights into how Hh signalling pathways modulate chemosensory responses in honeybees.
Conclusion
RNA sequencing analysis identified five downregulated olfactory receptor genes in the transcriptome. GO and KEGG analyses revealed that DEGs were predominantly enriched in cellular processes and signal transduction pathways, with significant involvement in metabolic processes. Analysis of gene expression patterns reveals that AmelSmo protein modulates olfactory behaviour through its influence on olfactory receptor activity. Nevertheless, the precise molecular mechanisms remain elusive, and the regulatory network governing olfactory behaviour exhibits remarkable complexity. AmelSmo protein may participate in additional regulatory pathways, necessitating further functional validation and gene interaction studies to elucidate its role in olfactory recognition processes.
Acknowledgements
This work was supported by National Key Research and Development Program of China (2022YFD1600201-3).
Competing interests
The authors declare that they have no known competing financial interests or personal relationships that might influence the results reported in this paper.