

Introduction
In nature, plants often encounter environmental changes that threaten their survival; these changes can be called adversity or stress (Shinozaki and Yamaguchi-Shinozaki, Reference Shinozaki and Yamaguchi-Shinozaki2000; Zhu, Reference Zhu2001). Salinity is a chemical stress that causes changes in osmosis, transportation and metabolic processes, including nutrient deprivation, decreased turgor pressure, dehydration and the inhibition of plant growth (Bohnert et al., Reference Bohnert, Ayoubi and Borchert2001; Zhu, Reference Zhu2001). Salt stress and the molecular mechanism of plant salt tolerance are important topics. Although a variety of plant species have been investigated, tobacco has always been one of the most important model crop plants for studying plant stress physiology (Honée et al., Reference Honée, Melchers, Vleeshouwers, van Roekel and de Wit1995; Bonnet et al., Reference Bonnet, Bourdon, Ponchet, Blein and Ricci1996) because tobacco tissue culture is easy. Moreover, re-differentiated and transformed clones are also easy to obtain. Scientists have introduced exogenous transcriptional factors or functional genes involved in photosynthesis, nutrient absorption and utilization, disease resistance, pest resistance, drought resistance, salinity resistance, freezing tolerance, heat tolerance and herbicide tolerance into the tobacco plant (Keller et al., Reference Keller, Pamboukdjian and Poncbet1999; Ozturk et al., Reference Ozturk, Talam'e and Deyholos2002), and then obtained the corresponding transgenic tobacco plants, suggesting they are representative and easy objects for experimentation.
In this study, we first constructed a homogeneous tobacco cDNA library, and then obtained expressed sequence tag (EST) data sets by using large-scale EST sequencing technology. We aimed to explore high-throughput cDNA array monitoring technology and to apply it to the gene expression spectrum analysis of salinity-challenged tobacco plants. These EST data sets and corresponding technological systems will provide a basis for the studies of plant stress and disease tolerance mechanisms. The obtained gene expression spectrum of tobacco plants under salt stress will shed new light on plant regulatory mechanisms in response to stress.
Materials and methods
Plant materials
The cDNA library was constructed using 13 tobacco plant species and varieties, including Nicotiana alata Link & Otto, N. clevelandii Gray, N. glutinosa L., N. plumbaginifolia Viviani, N. suaveolens Lehmann, N. suaveolens, N. rustica L., N. tabacum Samson (a cultivar, fragrant tobacco), B21 (Baile tobacco), G80, NC82, Hongda, Yun85 and Yun201, which were all provided by the Yunnan Tobacco Research Institute. Seedlings were transplanted in the open field until all of them were in the large-cross phase. Then roots, stems and leaves were collected and mixed for total RNA extraction.
Yun85 was used for the salt stress experiment. A floating-seeding system in nutrient solution was conducted inside a greenhouse; the coated seeds were sown, in the middle 10 days of May 2006, in tobacco-specific floating plates with Hoagland culture (Hewitt, Reference Hewitt1965). After hydroponic growth for 70 days, seedlings at the 8–10 leaf stage were treated with Hoagland culture containing 200 mmol/l NaCl for 3 h. Then the second leaves were collected for total RNA extraction, using naturally growing plants at the 8- to 10-leaf stage as controls. Sampled in parallel, all these second leaves were preserved in liquid nitrogen. The remainder of the tobacco plants were used for measuring photosynthetic indices.
Main reagents
The RNA extraction reagent Trizol® was bought from GIBCO-BRL/Invitrogen Corp. (Carlsbad, California, USA); DNase I, Sephacryl® S-400 Matrix, restriction endonuclease (NotI and SalI), T4 DNA ligase, Taq DNA polymerase and 1 kb DNA ladder were all from Promega Corp. (Madison, Wisconsin, USA). Reverse transcriptase SuperScriptTM II was from Invitrogen Corp. Both the plasmid DNA extraction kit and N+ nylon membrane were from Millipore Corp. (Anderson, California, USA). The DYEnamicTM sequencing kit was from GE Healthcare (Chalfont St. Giles, UK). The rest of the chemical reagents were analysis grade.
Extraction of total RNA and cDNA library construction
The total RNA was extracted as described in the Trizol® kit instructions and treated with DNase I to remove the trace DNA. After re-treatment with Trizol® reagent, the integrity of the RNA was identified by 1% formaldehyde denaturing gel electrophoresis. The resultant RNA was quantified spectrophotometrically at A260nm and homogenized. The first chain of the cDNA library was synthesized with SuperScriptTM II reverse transcriptase and the primers were as follows:
5′ terminal: 5′-AACATATGCGGCC GCATTATGGC CGGG-3′;
3′ terminal: 5′-GATCTTCCACGCGTCGAC(T)30(AGC) (ATGC)-3′.
With the first chain being a template, the double-chain cDNA was obtained by polymerase chain reaction (PCR) amplification with a 5′ primer (5′-AACATATGCGGCCGCATTATGG-5′) and 3′ primer (5′-GATCTTCCACGCGTCGACT-3′). The cycling parameters of PCR were as follows: denaturing at 95°C for 10 s and annealing at 60°C for 45 s for 16 cycles. Digested with NotI and SalI, the PCR products were eluted through Sephacryl® S-400 Matrix to remove cDNA fragments smaller than 400 bp. The isolations were connected with the pBluescript SK(+) carrier (from Stratagene, Santa Clara, California, USA) and linear DNAs which have the same sticky terminals, and were then transformed into Escherichia coli with the Gene Pulser XcellTM electric shocker (from Bio-Rad Laboratories, Hercules, California, USA).
Extraction of recombinant plasmid and cDNA sequencing
The transformed products were diluted and cultivated on a MacConkey plate containing l00 μg/ml of ampicillin for 12 h and 100 bacterial colonies were selected randomly to check the length of insertion with PCR. The primers for amplification were as follows:
M13 F: 5′-CCCAGTCACGACGTTGTAAAACG-3′
M13 R: 5′-AGCGGATAATTTCACACAGG-3′.
The molecular weight of resultant products was identified by 1% agarose gel electrophoresis. The white bacterial colonies were incubated in a 96-well microplate, each containing 1 ml Luria–Bertani (LB) culture solution (g/l: 10 peptone, 5 yeast cream, 10 NaCl, pH 7.0; and 100 μg/ml ampicillin), under 200 rpm shake culture for 18 h at 37°C. Plasmid DNA was prepared from 9600 recombinant cultures, selected randomly, by following the procedure of the plasmid extraction kit. According to the directions of the DYEnamicTM sequencing kit, the products were amplified and were sequenced with a MegaBACETM 1000 automatic sequencer (from GE Healthcare).
Bio-informatics processing of EST sequence
The original EST sequence was treated as follows: (1) the original ABI sequences were read using the Phred programme (Ewing et al., Reference Ewing, Hillier, Wendl and Green1998) and converted into text files; (2) low-quality sequences were removed using SeqClean (http://www.tigr.org/tdb/tgi/software/), including those from carrier, mitochondria, bacterial genome, joint and ribosomal rRNA; (3) the crude ESTs (≥100 bp) were clustered with TGICL megablast program (TIGR Gene Index Clustering tools) (Pertea et al., Reference Pertea, Huang and Liang2003); (4) the clusters were assembled with CAP3 software (Huang and Madan, Reference Huang and Madan1999); (5) a functional annotation (E<10−5) was presented by BLASTx contrast between the tentative unique transcript (TUT) sequences and the UniProt database (Altschul et al., Reference Altschul, Gish, Miller, Myers and Lipman1990; Apweiler et al., Reference Apweiler, Bairoch and Wu2004) and a functional classification description in the Munich Information Center for Protein Sequences (MIPS) functional classification database (Mewes et al., Reference Mewes, Frishman and Guldener2002).
cDNA array and hybridization probe preparation
Non-redundant cDNA clones were selected and PCR-amplified with universal M13 primers. The independent gene-containing PCR product was used for cDNA array preparation. After being purified, the PCR products were printed on N+ nylon membrane with a microarrayer having a 0.4 mm stitch (384 stitches). Every array contained 25 samples (5×5) and every cDNA sample was printed in duplicate.
The trace DNA in different RNA samples was removed by DNase I. The resultant RNAs were re-extracted and their integrity was identified with Trizol® reagent. After being quantified spectrophotometrically at A260nm, RNA from a different origin was homogenized. With the treated RNA as a template, Oligo(dT)16 as well as 6N being primers and catalysed with reverse transcriptase SuperScriptTM II (from Invitrogen Corp.), the first cDNA chain was made, which was then labelled as a probe with [33P]dCTP (from Amersham BioSciences, Amersham, Bucks, UK). Subsequently, the resulting cDNA was eluted through the Sephadex-G50 to remove [33P]dCTP monomers.
Molecular hybridization and data analysis
The cDNA arrays were treated by UV cross-linking (60 mJ/cm2) before hybridization according to Sambrook and Russell (Reference Sambrook and Russell2001). The hybridization signal was collected by a scanner, a Typhoon 9200 (Molecular Dynamics Inc., California, USA), and then was converted into a homogenized value with ArrayVision 6.0 (MD) after phosphor-screening (Kodak, Japan), and autoradiographed for 72 h. Three independent experiments were established for every probe, and the differential gene expression between two control treatments was tested by modified t-test (http://visitor.ics.uci.edu/genex/cybert/). The intensity of the differentially expressed genes in the current study had to be in accordance with the following three prerequisites: (1) 0.01 confidence interval; (2) average intensity of any set of the hybridization signal being larger or equal to 0.20; (3) the proportional differential expression being larger or equal to 2.00.
Real-time fluorescent quantitative PCR
With Oligo(dT)16 being a primer and catalysed by reverse transcriptase SuperScriptTM II, the first chain of cDNA of the RNA sample in the study was synthesized and served as a PCR template. The differential amounts of five up-regulated and four down-regulated gene expressions were detected in parallel. By setting up three independent, parallel experiments, the relative amount of gene expression was calculated, with the β-actin gene as an internal control. As a result, the dynamic tendency of the gene expression level was determined and the reliability of microarray hybridization was verified. The fluorescent quantitative PCR kit, quantitative PCR device and primer-design software were all from Bio-Rad Laboratories.
Determination of photosynthetic and physiological indices
The second leaf of salt-treated tobacco was used to measure the photosynthetic parameters with an LI-6400 instrument (from LI-COR Inc., Lincoln, Nebraska, USA), using the second leaf of the naturally growing plant as control. The leaves in the study were kept in a chamber with a red-blue light source (28°C, 1000 μmol/m2/s, 385 μl/l concentration of CO2), where the photosynthetic rate, stomatal conductivity, transpiration rate and concentration of intercellular CO2 were determined. Three tobacco plants were used in each group as duplicated samples, and every plant was measured three times. The data were analysed statistically using SPSS 13.0 (SPSS Inc., Chicago, Illinois, USA).
Results and analysis
Quality identification of cDNA library
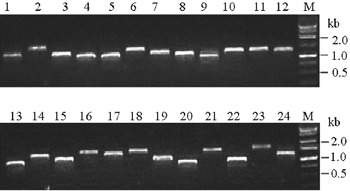
Based on a bacterial counting technique, the bacterial concentration of the cDNA library was about 1.5×l05/ml. The recombination rate of the library was about 80%. Randomly selecting 192 cDNA clones for PCR amplification and obtaining 163 specific primers, we then measured the size of the inserted fragment with 1% agarose gel electrophoresis. The results of 24 PCR products are shown in Fig. 1. The average length of the exogenous cDNA library was estimated to be 1.2 kb, suggesting that the length of the inserted fragment of the cDNA library would ensure the integrity of tobacco genes.
PCR identification of recombinants. Lanes: 1–24, detected clones; M, 1 kb DNA ladder.

Gene annotation and statistical results
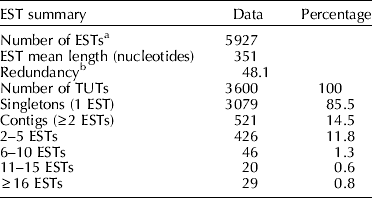
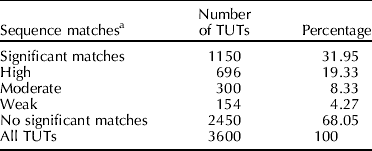
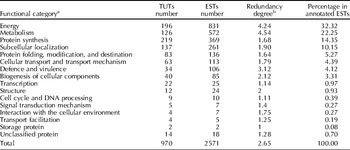
A total of 9600 cDNA clones were selected randomly from the prepared homogeneous cDNA library and sequenced from the 5′ terminal end. Carriers and low-quality sequences were removed with the Phred programme (repetitive sequences and sequences containing over 3% fuzzy sequences). Finally, we obtained 5927 high-quality EST sequences (≥100 nt) (Table 1). Statistical data indicated that the average EST length was 351 nt and more than 52% of them were longer than 400 nt. All ESTs were assembled and formed clusters using the TGICL programme, and every cluster was called a tentative unique transcript (TUT). Then, the above-mentioned EST sequences were assembled into 3600 TUTs, including 521 overlapping groups (contigs) and 3079 independent ESTs (singletons). Twenty-nine overlapping groups out of the EST bank occurred over 15 times and could be classified as highly expressed sequences according to Trail et al. (Reference Trail, Xu, Miguel, Halgren and Kistler2003), representing highly expressed genes in this cDNA library. Using BLASTx to compare with the UniProt database, about 31.95% of the 3600 TUTs had a functional annotation (E⩽10−5) (Table 2). According to the MIPS functional classification system, these annotated genes were classified into 18 functional groups (Table 3).
Summary of EST data
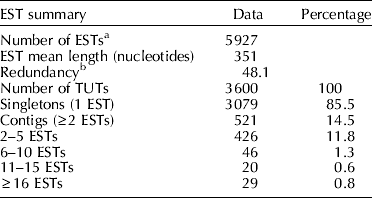
a Number of ESTs with length not less than 100 bp.
b Redundancy=number of redundant ESTs/total number of ESTs.
BLASTx results of TUTs
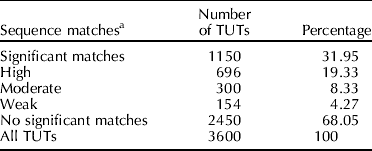
a The TUT sequence matches were divided into highly significant (E⩽10−20), moderately significant (10−20<E⩽10−10), weakly significant (10−10<E⩽10−5) and not significant (E>10−5) classes according to the expected (E) values of BLASTx hit sequences.
MIPS functional classification of ESTs from N. tabacum cDNA library

a Categories were assigned according to MIPS Functional Catalogue Database.
b Redundancy degree=number of ESTs /TUTs of a given category.
cDNA array data analysis
According to the results of EST sequence analysis, non-redundant cDNA clones were selected from these 3600 independent genes (TUTs) and PCR amplified with M13 universal primers. The PCR products were identified by agarose gel electrophoresis, and fragments representing 3503 independent genes were used for the cDNA array preparation. To test the reliability of these cDNA arrays, 384 PCR products were randomly selected for re-sequencing from the 3′ terminus. The positive sequencing results were completely consistent with the original EST sequences of the cDNA clones, suggesting that these resultant cDNA arrays were correct and could be used for later research.
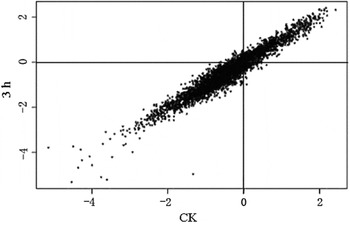
The correlation coefficients (R2) of these three independent cDNAs and hybridization array controls were 0.99, 0.96 and 0.97 respectively, whereas those of NaCl-stressed classes were 0.97, 0.99 and 0.97, suggesting good repetition of the hybridization experiments (Fig. 2). The original data of these cDNA hybridization arrays can be browsed or downloaded from the network bank of our research group (www.estarray.org/array/).
Scatter plot comparing the cDNA array hybridization signal values between control and 200 mmol/l NaCl treatment for 3 h.

Differential expression of NaCl-stressed tobacco leaves
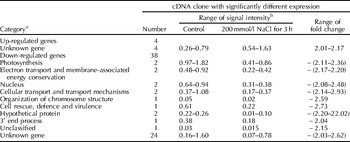
By comparing with the control group, there were 42 genes with differential expression abundance two times higher in the controls than in the NaCl-stressed groups, accounting for 1.17% of the total genes in study. The general distribution of up- and down-regulated genes is listed in Table 4. Attention should be focused on the following points.
(1) Gene expressions of NaCl-challenged tobacco leaves were predominately inhibited: 38 genes were down-regulated whereas only four were up-regulated. These genes are involved in a number of plant physiological processes such as metabolism, respiratory chain, cellular cycle, DNA binding, protein synthesis and binding, as well as cellular transportation.
(2) The expression frequencies of some housekeeping genes, such as ubiquitin, ubiquinol-cytochrome C reductase and histone H2B, dropped markedly, suggesting that basic physiological activities of plants were inhibited.
(3) Genes that were significantly down-regulated also included two light-reaction related genes, photosystem II 10 kDa polypeptide and oxygen-evolving enhancer protein 1 genes. The products of both genes are components of the receptor complex of photosystem II. Such products are located in the grana lamellae of chloroplasts and receive solar energy for photosynthesis.
(4) The amounts of gene expression of many transmembrane protein genes, especially the aquaporin PIP2a (plasma membrane intrinsic protein 2a), were markedly down-regulated, a finding that was closely correlated with the physiological response of NaCl-stressed plants.
(5) More than 2/3 of these differentially expressed genes were functionally known ones, including the four up-regulated genes mentioned above.
Analysis of significantly expressed genes between control and treatment with 200 mmol/l NaCl for 3 h

a Categories were assigned according to MIPS Functional Catalogue Database by gene ontology annotation.
b Mean signal intensity after global normalization.
QRT-PCR test
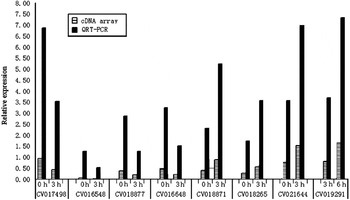
To test the reliability of the cDNA array hybridization data, the RNA samples used in the cDNA array hybridization were reverse transcribed into a cDNA template. Eight genes, four down-regulated (CV017498, CV016548, CV018877 and CV016648) and four up-regulated (CV018871, CV018265, CV021644 and CV019291), were selected randomly for quantitative reverse transcription – PCR (QRT-PCR) analysis. Statistical analysis revealed that there was a difference between the results from cDNA array hybridization and those from QRT-PCR, but the dynamic tendency of gene expression frequency was consistent (Fig. 3).
Comparison of expression data of eight genes using cDNA array and QRT-PCR experiments at various time points. CV017498, CV016548, CV018877 and CV016648 are the GenBank accession IDs of four down-regulated genes; CV018871, CV018265, CV021644 and CV019291 are the GenBank accession IDs of four up-regulated genes.

Analysis of the photosynthetic and physiological data
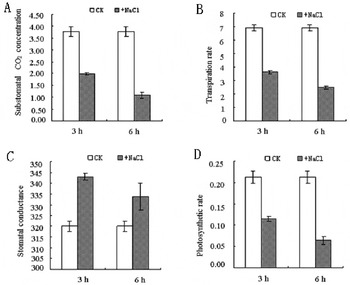
After being challenged with 200 mmol/l NaCl for 3 h, the tobacco leaves had wilted slightly. In order to obtain the physiological dynamics of stressed tobacco plants, we not only measured the photosynthetic physiological parameters after these plants had been stressed for 3 h, but also conducted a control measurement after the tobacco plants had been stressed for 6 h (see Fig. 4 for details). At the time point of 3 h, the foliar photosynthetic rate, stomatal conductance and transpiration rate of the treated group were significantly lower than those of the control group (P<0.01). Correspondingly, the concentration of intercellular CO2 was significantly higher than the controls, suggesting an inhibition of photosynthesis. At the 6-h time point there was a slight change in each physiological parameter, and the between-group difference was even more significant.
Photosynthetic parameters of N. tabacum treated with 200 mmol/l NaCl. (A) Substomatal CO2 concentration; (B) transpiration rate; (C) stomatal conductance; (D) photosynthetic rate. CK, control plants, not exposed to NaCl.

Discussion
EST of tobacco
As one of the most important materials in plant research, the tobacco plant has been used in much fundamental research. Plant tissue culture and plant genetic operational methods have been explored using tobacco plants. Isolation of a variety of tobacco ESTs and whole-length cDNA sequences is an important prerequisite for studying the functional genes of tobacco and provides the material for studying transcriptional regulation and promoters of genes (Staskawicz et al., Reference Staskawicz, Ausubel and Baker1995).
The current research constructed a tobacco cDNA library, using the specific tobacco resources in Yunnan Province, China, and obtained 5927 high–quality ESTs. These ESTs were characterized by:
(1) High library purity – the proportion of empty carrier sequence, mitochondrial as well as bacterial gene sequences, were very low, accounting for 1.2% and 1.0% of the total sequenced clones, respectively.
(2) Low redundancy – in order to decrease the library redundancy and get more independent genes, the prepared original cDNA was used directly to obtain recombinant clones, in order to avoid secondary amplification of the cDNA library. Finally, the redundancy of obtained ESTs was about 48.1%.
(3) In terms of gene function, the highly expressed genes are involved in photosynthetic metabolism and protein synthesis, for example, ribulose-1,5-bisphosphate carboxylase/oxygenase (Rubisco) in the photorespiration and photosynthetic chain, chlorophyll a–b binding protein and plastocyanin. The 3079 genes with low expression accounted for 85.5% of the total TUTs. Further study of the function of these genes will cast light on the understanding of tobacco-specific metabolism and biosynthetic pathways.
(4) The EST data sets have been submitted to GenBank for open access (www.ncbi.nlm.nih.gov/dbEST/, accession nos CV015900-CV021826). These data sets will be helpful in plant- and cultured cell-dependent drug production from tobacco, and will provide useful information for related research.
Differential expression of NaCl-stressed tobacco plants
Excessive soil salinity is an abiotic plant stressor, having a number of plant physiological consequences, including yield loss. The metabolic and developmental changes induced by salt stress are usually caused by alterations of gene expression patterns: some genes are intensively expressed, while others are inhibited. These stress-induced genes and resultant products are accumulated to cope with the adverse environment. Studies of these genes will not only supply further insight into the plant's complicated gene network, but also aid in understanding of the regulatory mechanism of the stress response of plants.
Similar to Arabidopsis thaliana, tobacco is a salt-sensitive plant. In this study, a significant alteration in the gene expression spectrum of tobacco leaves was induced by three-hour stressing with NaCl, and many important physiological processes were implicated. Photosynthesis was markedly inhibited, as the photosynthetic rate was significantly decreased and the expression of some light reaction-correlated genes was markedly down-regulated. This suggests that the characteristics of the gene expression spectrum is consistent with physiological conditions and that the transcriptional level can honestly and specifically indicate physiological conditions.
In addition, we found that the regulation of the aquaporin gene PIP2a dropped significantly, which may be an explanation for a dramatic decrease in stomatal conductance and transpiration rate of NaCl-stressed tobacco plants, and suggesting that a high concentration of salinity makes it hard for plants to get water from soil via the roots, leading to symptoms of water stress. Yamada et al. (Reference Yamada, Katsuhara, Kelly, Michalowski and Bohnert1995) found that the mRNA level of aquaporin in the ice plant (Mesembryanthemum crystallinum) under high salinity decreased rapidly. But with an increasing amount of active osmotic material, such as sucrose and polyamine, the mRNA level recovered or even increased to a higher level.
Further intracellular biochemical details can be acquired by investigating the differentially expressed genomes. For example, the down-regulation of ethylene-responsive proteinase gene revealed that ethylene accumulation or antagonism might be involved in the responsive mechanism of cellular signal transduction under salt stress. It has been suggested that, under low oxygen, ethylene-induced signal transduction might improve the ability of plants to cope with adversity (Pieterse and van Loon, Reference Pieterse and van Loon1999), but it remained unknown whether ethylene would mediate and regulate plant cellular responses at high salinity.
The findings of the present study will provide further insight into the stress-response mechanism. Meanwhile, they suggest that complicated gene regulatory networks remain to be elucidated. It was interesting that prp31 gene, a pre-mRNA splicing factor, occurred in the differentially expressed gene groups, indicating that alternative splicing (AS) was also involved in this important transcriptional regulation network. Different mRNA and transcriptional products could be obtained via alternative splicing and consequently the diversity of gene products could be improved; this is a widespread phenomenon in multicellular organisms (Kazan, Reference Kazan2003; Ast, Reference Ast2004). Much effort should be focused on the correlations between post-transcriptional mechanisms and salt stress in the future.
Finally, we detected many functionally unknown genes in this study (more than 2/3 of the obtained genes), especially the four up-regulated genes. Further investigation of these genes would help to explore pathways of the plant's active response to salt stress.
Acknowledgements
This work was supported by the Development and Research Foundation of Yunnan Tobacco Corporation of CNTC, under Grant No. 0515; and the National Natural Science Foundation of China, under Grant No. 30560062.
We would like to thank Dr. Rick Rochester and his organization, International College of China Agricultural University, for proofreading the English manuscript of this paper.