


1 Introduction
The interactions between fluid flow and flexible structures are ubiquitous in our daily life as the fluid–structure interaction (FSI) problems, e.g. fish swimming in the water with fins, birds flying in the sky with wings. The filament or flag movement in fluid flow is a typical FSI problem in which the filament represents the flexible body of the biological species. A single filament setting in a two-dimensional flow has also been studied experimentally (Zhang et al. Reference Zhang, Childress, Libchaber and Shelley2000) and numerically (Huang, Shin & Sung Reference Huang, Shin and Sung2007; Zhu, He & Zhang Reference Zhu, He and Zhang2014b ). Numerous studies for two tandem flags (Ristroph & Zhang Reference Ristroph and Zhang2008; Alben Reference Alben2009; Zhu Reference Zhu2009; Kim, Huang & Sung Reference Kim, Huang and Sung2010) were also carried out. It is found that for tandem flexible flags, the rear flag experiences a drag enhancement compared to an isolated one (Ristroph & Zhang Reference Ristroph and Zhang2008; Kim et al. Reference Kim, Huang and Sung2010). And for multiple flexible flags, the rear flags may achieve a drag reduction (Tian et al. Reference Tian, Luo, Zhu and Lu2011; Uddin, Huang & Sung Reference Uddin, Huang and Sung2013). Experimental study of hydrofoils in a side-by-side and an in-line configuration were also carried out (Boschitsch, Dewey & Smits Reference Boschitsch, Dewey and Smits2014; Dewey et al. Reference Dewey, Quinn, Boschitsch and Smits2014). The mechanism of constructive and destructive vortices merging was applied to explain the relevant phenomena (Kim et al. Reference Kim, Huang and Sung2010; Uddin et al. Reference Uddin, Huang and Sung2013). Moreover, the tandem arrangement for the self-propelled flexible bodies was also studied (Zhu, He & Zhang Reference Zhu, He and Zhang2014a ) and the optimal distance for efficient self-propulsion is achieved.
An energy harvesting system using the conventional flapping flexible plate (head of the plate is fixed) with a piezoelectric material attached to its surface was proposed by Michelin & Doaré (Reference Michelin and Doaré2013). Recently, to improve the energy harvesting by using flexible oscillating structures, a configuration of an inverted flexible plate in a uniform flow with Reynolds number
 $Re\approx 10\,000$
has been proposed and studied experimentally (Kim et al.
Reference Kim, Cossé, Cerdeira and Gharib2013). It is found that the inverted flag can flap with large amplitude and more bending energy can be achieved. The study was followed by a series of numerical studies. Ryu et al. (Reference Ryu, Park, Kim and Sung2015) and Tang, Liu & Lu (Reference Tang, Liu and Lu2015) studied the three-dimensional and two-dimensional inverted flags numerically at
 $Re\approx 200$
, respectively. In these studies four different modes for the flag are found, including the straight, flapping, deflected and deflected–flapping modes. Both Kim et al. (Reference Kim, Cossé, Cerdeira and Gharib2013) and Gurugubelli & Jaiman (Reference Gurugubelli and Jaiman2015) have found that the mass ratio has a negligible influence on the value of bending stiffness
 $K$
where flapping is initiated. Sader et al. (Reference Sader, Cossé, Kim, Fan and Gharib2016a
) and Sader, Huertas-Cerdeira & Gharib (Reference Sader, Huertas-Cerdeira and Gharib2016b
) investigated the stability of the inverted flag and found that the flapping of the inverted flag is a vortex-induced vibration. Recently, Shoele & Mittal (Reference Shoele and Mittal2016) coupled the two-dimensional inverted flag simulation with the piezoelectric mechanism at
 $Re\approx 200$
. Orrego et al. (Reference Orrego, Shoele, Ruas, Doran, Caggiano, Mittal and Kang2017) explored an inverted piezoelectric flag experimentally for harvesting ambient wind energy efficiently and made the practical application for inverted flags plausible.
However, it is still unknown whether the energy harvesting performance can be enhanced when coupled inverted flags are arranged properly. Here, the configurations of flags in two rows are explored, and address the issues regarding how far the flags in the front and rear rows should be placed and what the proper staggered gap in the lateral direction is. As far as we know, it is the first time that the collective performance of inverted flags has been investigated.
The paper is organized as follows: the physical problem and mathematical formulation are described in § 2.1, the numerical method and validation are presented in §§ 2.2 and 2.3, the results are discussed in § 3, and concluding remarks are addressed in § 4.
2 Computational model
2.1 Physical problem and mathematical formulation
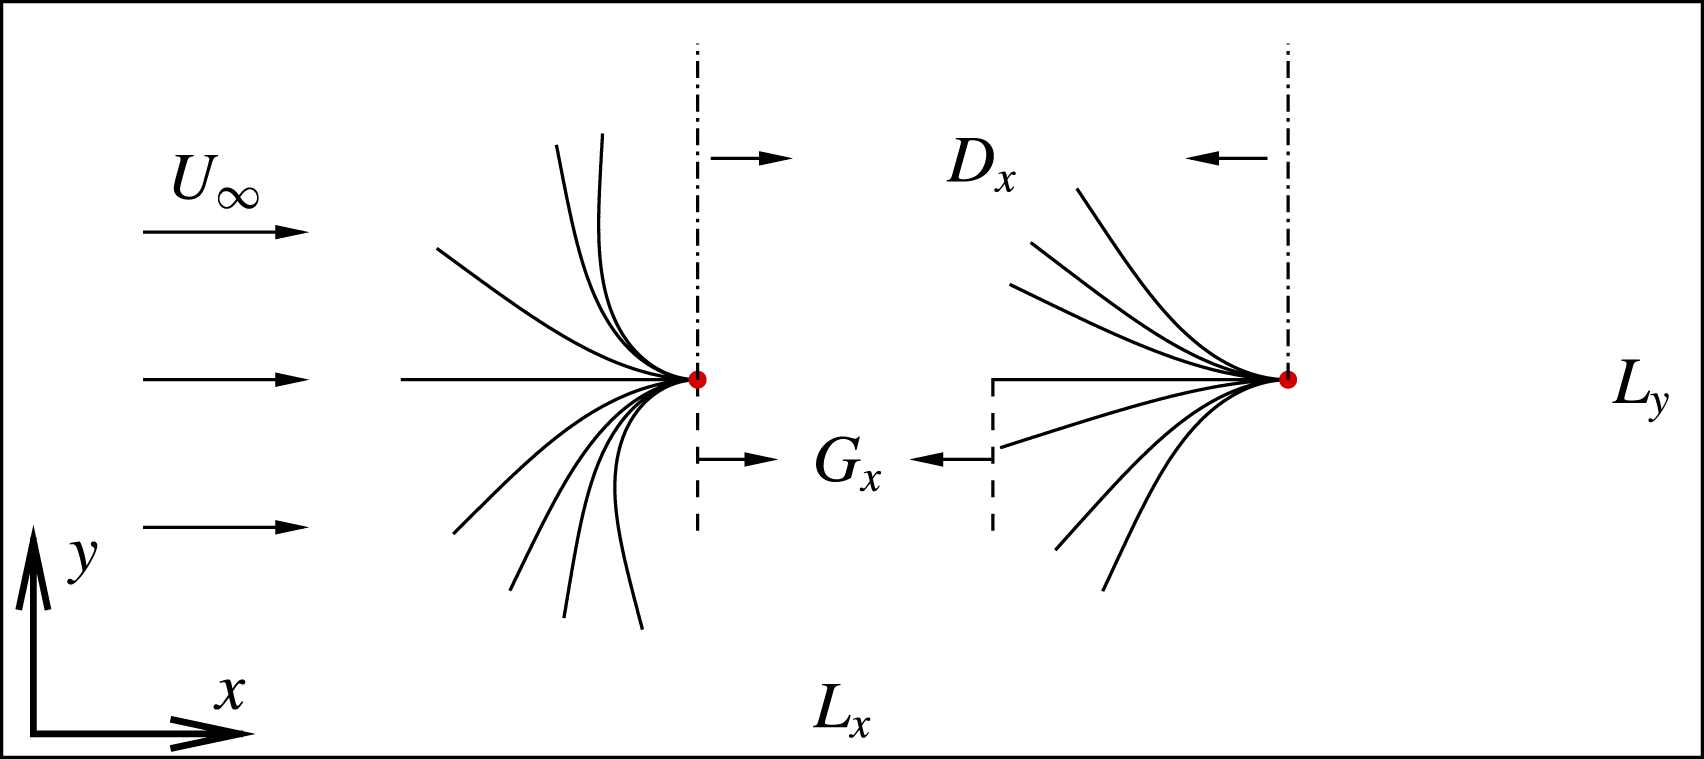
A schematic of the tandem inverted flexible flags system is shown in figure 1. The computational domain is
 $L_{x}\times L_{y}$
, where
 $L_{x}$
and
 $L_{y}$
are the domain sizes along the
 $x$
- and
 $y$
-directions, respectively, and the incoming flow velocity is
 $U_{\infty }$
. The trailing edges of the flags are fixed but the leading edges of the flags are free. The horizontal gap distance
 $G_{x}$
is defined as the horizontal distance between the two inverted flags.
Schematic diagram of two flexible tandem flags in a uniform flow with incoming velocity
 $U_{\infty }$
. The ends of the flags are fixed and
 $L$
is the initial length of each flag.
 $D_{x}$
is the distance between the fixed points along the
 $x$
-direction and
 $G_{x}=D_{x}-L$
. Each flag is represented by a beam model.
The incompressible viscous Navier–Stokes (NS) equations that govern the fluid are
 $$\begin{eqnarray}\displaystyle & \displaystyle \frac{\unicode[STIX]{x2202}\boldsymbol{v}}{\unicode[STIX]{x2202}t}+\boldsymbol{v}\boldsymbol{\cdot }\unicode[STIX]{x1D735}\boldsymbol{v}=-\frac{1}{\unicode[STIX]{x1D70C}}\unicode[STIX]{x1D735}p+\frac{\unicode[STIX]{x1D707}}{\unicode[STIX]{x1D70C}}\unicode[STIX]{x1D6FB}^{2}\boldsymbol{v}+\boldsymbol{f}, & \displaystyle\end{eqnarray}$$
 $$\begin{eqnarray}\displaystyle & \unicode[STIX]{x1D735}\boldsymbol{\cdot }\boldsymbol{v}=0, & \displaystyle\end{eqnarray}$$
where
 $\unicode[STIX]{x1D70C}$
is the fluid density,
 $\boldsymbol{v}$
is the velocity,
 $p$
is the pressure,
 $\unicode[STIX]{x1D707}$
is the dynamic viscosity of the fluid and
 $\boldsymbol{f}$
is the body force term.
To describe the deformation of the flag in a Lagrangian coordinate system, the structure equation is employed,
 $$\begin{eqnarray}\displaystyle \unicode[STIX]{x1D70C}_{s}h\frac{\unicode[STIX]{x2202}^{2}\boldsymbol{X}}{\unicode[STIX]{x2202}t^{2}}=\frac{\unicode[STIX]{x2202}}{\unicode[STIX]{x2202}s}\left[Eh\left(1-\left(\frac{\unicode[STIX]{x2202}\boldsymbol{X}}{\unicode[STIX]{x2202}s}\boldsymbol{\cdot }\frac{\unicode[STIX]{x2202}\boldsymbol{X}}{\unicode[STIX]{x2202}s}\right)^{-1/2}\right)\frac{\unicode[STIX]{x2202}\boldsymbol{X}}{\unicode[STIX]{x2202}s}-\frac{\unicode[STIX]{x2202}}{\unicode[STIX]{x2202}s}\left(EI\frac{\unicode[STIX]{x2202}^{2}\boldsymbol{X}}{\unicode[STIX]{x2202}s^{2}}\right)\right]+\boldsymbol{F}_{L}+\boldsymbol{F}_{g}, & & \displaystyle\end{eqnarray}$$
where
 $\unicode[STIX]{x1D70C}_{s}$
is the density of the flag,
 $h$
is the thickness,
 $s$
is the Lagrangian coordinate along the flag,
 $\boldsymbol{X}$
is the position of the flag and
 $\boldsymbol{F}_{L}$
is the Lagrangian force exerted on the flag by the fluid.
 $\boldsymbol{F}_{g}=\unicode[STIX]{x1D70C}_{s}h\boldsymbol{g}$
is the gravity force, and
 $g=|\boldsymbol{g}|$
is the acceleration due to gravity. If not specified, usually gravity is not considered, i.e.
 $\boldsymbol{F}_{g}=0$
.
 $Eh$
and
 $EI$
are the stretching and bending stiffness, respectively.
The boundary conditions of the flag at the free head are
 $$\begin{eqnarray}1-\left(\frac{\unicode[STIX]{x2202}\boldsymbol{X}}{\unicode[STIX]{x2202}s}\boldsymbol{\cdot }\frac{\unicode[STIX]{x2202}\boldsymbol{X}}{\unicode[STIX]{x2202}s}\right)^{-1/2}=0,\quad \frac{\unicode[STIX]{x2202}^{2}\boldsymbol{X}}{\unicode[STIX]{x2202}s^{2}}=(0,0),\quad \frac{\unicode[STIX]{x2202}^{3}\boldsymbol{X}}{\unicode[STIX]{x2202}s^{3}}=(0,0),\end{eqnarray}$$
which mean no tension force, no bending moment and no shearing force acting at the free end, respectively. At the fixed end we have
 $$\begin{eqnarray}\boldsymbol{X}=\boldsymbol{X}_{o},\quad \frac{\unicode[STIX]{x2202}\boldsymbol{X}}{\unicode[STIX]{x2202}s}=(-1,0),\end{eqnarray}$$
where
 $\boldsymbol{X}_{o}=(0,0)$
for the case of an isolated flag.
The reference quantities density
 $\unicode[STIX]{x1D70C}$
, velocity
 $U_{\infty }$
and length
 $L$
are chosen to normalize the above formulations. The non-dimensional parameters are listed as follows: the Reynolds number
 $Re=\unicode[STIX]{x1D70C}U_{\infty }L/\unicode[STIX]{x1D707}$
, the bending coefficient
 $K=EI/\unicode[STIX]{x1D70C}U_{\infty }^{2}L^{3}$
, the tension coefficient
 $S=Eh/\unicode[STIX]{x1D70C}U_{\infty }^{2}L$
and the mass ratio of the flag to the fluid
 $M=\unicode[STIX]{x1D70C}_{s}h/\unicode[STIX]{x1D70C}L$
.
2.2 Numerical method
The governing equation (2.1) for the fluid flow is solved by the lattice Boltzmann method (LBM) (He, Shan & Doolen Reference He, Shan and Doolen1998). The flag deformation equation (2.3) is solved by the nonlinear finite element method (FEM) with the large-displacement deformation problem handled by co-rotational scheme. The detailed description of the method can be found in Doyle (Reference Doyle2013). The immersed boundary method (Goldstein, Handler & Sirovich Reference Goldstein, Handler and Sirovich1993) is used to couple the LBM and FEM (Huang et al.
Reference Huang, Shin and Sung2007; Hua, Zhu & Lu Reference Hua, Zhu and Lu2014). The Lagrangian force between the fluid and structure
 $\boldsymbol{F}_{L}$
can be calculated by the penalty scheme (Goldstein et al.
Reference Goldstein, Handler and Sirovich1993),
 $$\begin{eqnarray}\displaystyle \boldsymbol{F}_{L}=\unicode[STIX]{x1D6FC}\int _{0}^{t}[\boldsymbol{V}_{f}(s,t^{\prime })-\boldsymbol{V}_{s}(s,t^{\prime })]\,\text{d}t^{\prime }+\unicode[STIX]{x1D6FD}[\boldsymbol{V}_{f}(s,t)-\boldsymbol{V}_{s}(s,t)], & & \displaystyle\end{eqnarray}$$
where
 $\unicode[STIX]{x1D6FC}$
and
 $\unicode[STIX]{x1D6FD}$
are negative large penalty parameters which are selected based on previous studies (Hua et al.
Reference Hua, Zhu and Lu2014; Tang et al.
Reference Tang, Liu and Lu2015; Ye et al.
Reference Ye, Wei, Huang and Lu2017; Zhang, Huang & Lu Reference Zhang, Huang and Lu2017),
 $\boldsymbol{V}_{s}=\unicode[STIX]{x2202}\boldsymbol{X}/\unicode[STIX]{x2202}t$
is the velocity of Lagrangian material point of the flag. And
 $\boldsymbol{V}_{f}$
is the fluid velocity at the position
 $\boldsymbol{X}$
obtained by interpolation
 $$\begin{eqnarray}\displaystyle \boldsymbol{V}_{f}(s,t)=\int \boldsymbol{v}(\boldsymbol{x},t)\unicode[STIX]{x1D6FF}(\boldsymbol{x}-\boldsymbol{X}(s,t))\,\text{d}\boldsymbol{x}. & & \displaystyle\end{eqnarray}$$
Then the body force
 $\boldsymbol{f}$
on the Eulerian points is
 $$\begin{eqnarray}\displaystyle \boldsymbol{f}(\boldsymbol{x},t)=-\int \boldsymbol{F}_{L}(s,t)\unicode[STIX]{x1D6FF}(\boldsymbol{x}-\boldsymbol{X}(s,t))\,\text{d}s. & & \displaystyle\end{eqnarray}$$
The numerical strategy used here has been successfully applied to a wide range of FSI problems (Hua et al. Reference Hua, Zhu and Lu2014; Tang et al. Reference Tang, Liu and Lu2015; Ye et al. Reference Ye, Wei, Huang and Lu2017; Zhang et al. Reference Zhang, Huang and Lu2017), such as the dynamics of fluid flow over a circular flexible plate (Hua et al. Reference Hua, Zhu and Lu2014), and the dynamics of an inverted flexible plate (Tang et al. Reference Tang, Liu and Lu2015).
2.3 Validation
To validate our numerical methods, two problems for the flexible flag are considered. One is the lateral displacement of the trailing edge of a conventional flag in a uniform flow. The other is the lateral displacement of an inverted flag in a uniform flow. In both simulations, the computational dimensions are
 $[-15,45]\times [-15,15]$
with a grid size of
 $1920\times 960$
. The fixed point of the flag is located at
 $(0,0)$
, and there are 128 Lagrangian nodes along the flag.
Validations for cases: (a) the lateral displacement of the trailing edge of a conventional flag in a uniform flow with
 $Re=200$
,
 $K=0.0015$
,
 $M=1.5$
and
 $Fr=0.5$
; (b) the lateral displacement of the leading edge of an inverted flag in a uniform with
 $Re=250$
,
 $K=0.25$
,
 $M=1.0$
and
 $T=1.0$
.
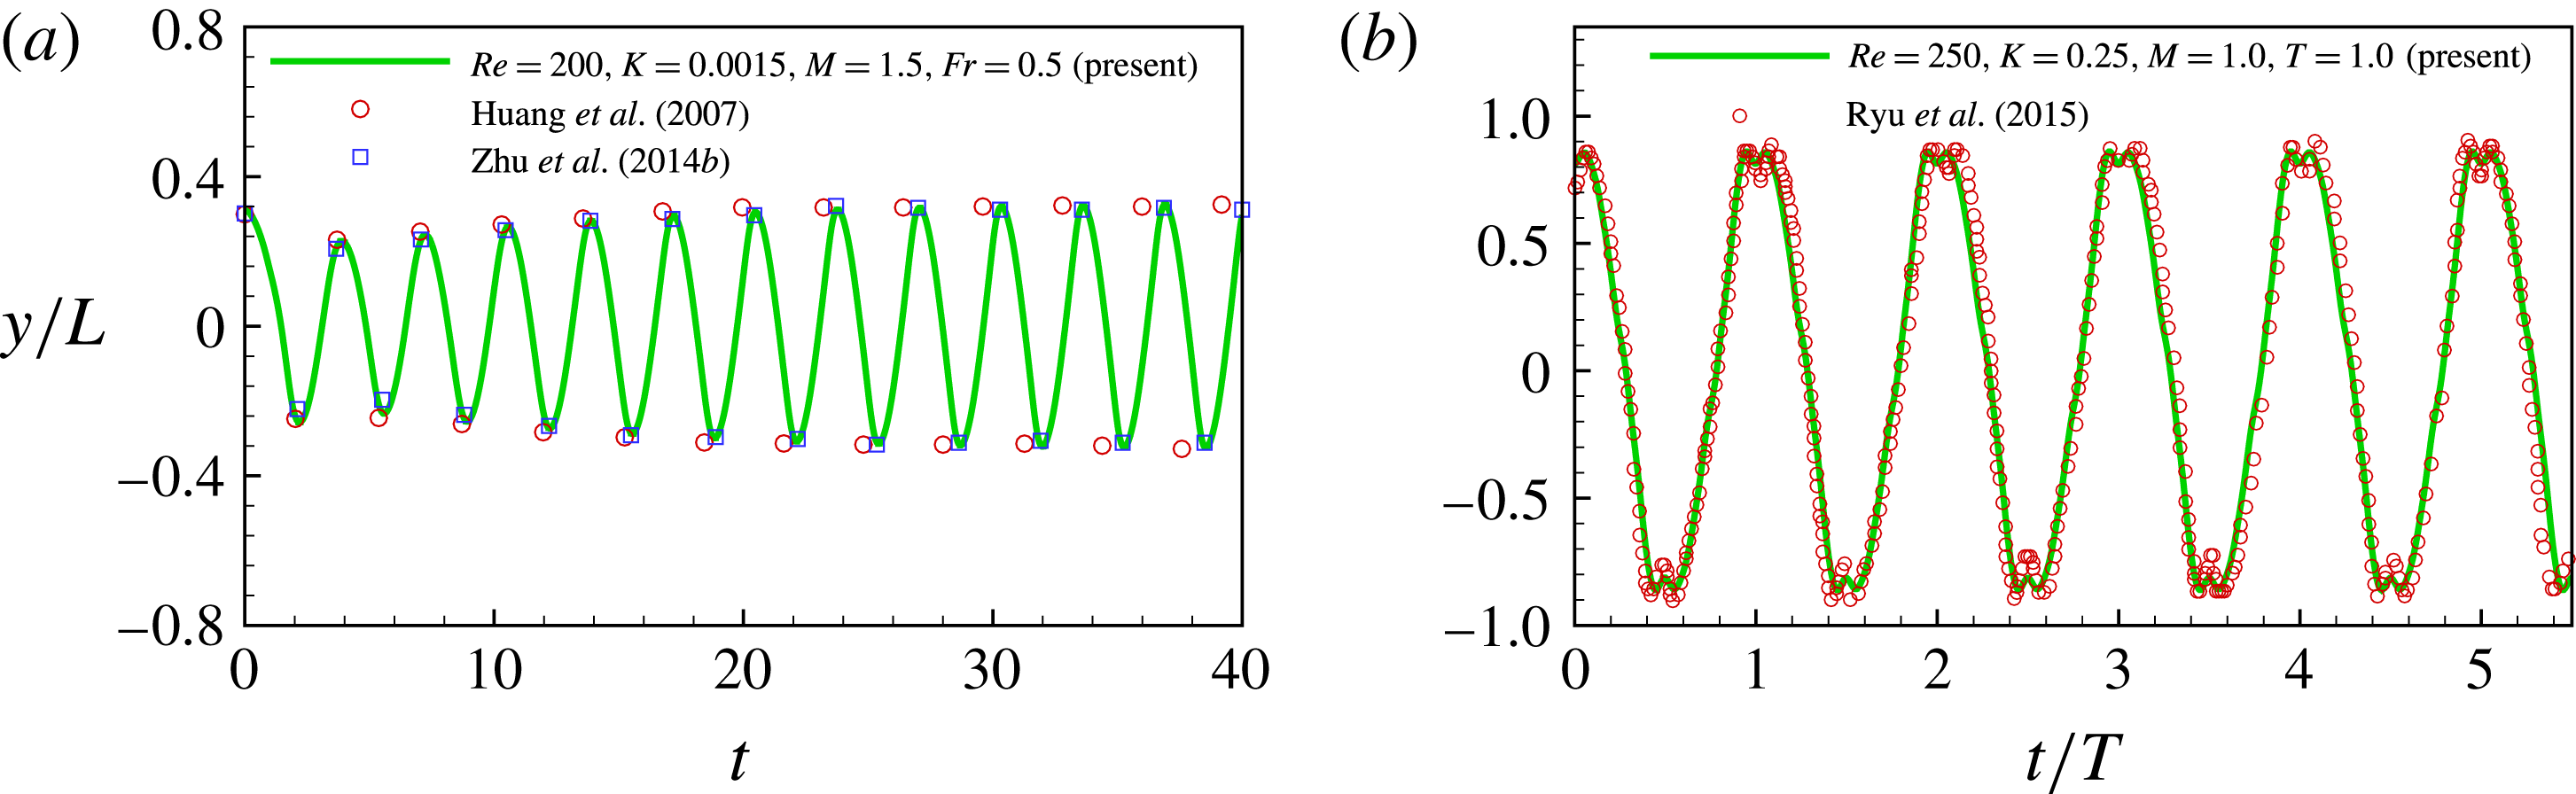
In the first validation, the non-dimensional parameters are
 $Re=200$
,
 $K=0.0015$
,
 $M=1.5$
, Froude number
 $Fr=gL/U_{\infty }^{2}=0.5$
and the gravity force is along the
 $x$
-axis. The result is shown in figure 2(a). It is seen that our result agrees well with those in the literature (Huang et al.
Reference Huang, Shin and Sung2007; Zhu et al.
Reference Zhu, He and Zhang2014b
). In the second validation, the non-dimensional parameters are
 $Re=250$
,
 $K=0.25$
,
 $M=1.0$
and
 $T=1.0$
. From figure 2(b), it is seen that the lateral displacement of the leading edge of the inverted flag is very consistent with that in Ryu et al. (Reference Ryu, Park, Kim and Sung2015).
3 Results and discussion
In our study, the flag is unstretchable because the stretching stiffness is very large, i.e.
 $S=1000$
. The parameters
 $Re=200$
and
 $M=2.9$
in Tang et al. (Reference Tang, Liu and Lu2015) are adopted here and they are fixed in our simulations. The bending coefficient
 $K$
and the gap distances
 $G_{x}$
and
 $L_{y}$
are allowed to vary to seek for the best arrangement mode of the two flags which is able to achieve more bending energy.
For the case of an isolated flag and the cases of simple two tandem flags, the Dirichlet boundary condition
 $\boldsymbol{v}=(U_{\infty },0)$
is applied in the upper and lower boundaries, which is referred to as the far field boundary condition. Convergence tests for different computational domains show that the computation domain size
 $L_{x}\times L_{y}=[-15,45]\times [-15,15]$
is large enough to eliminate the effect of the boundary condition. Therefore this domain size is adopted in the simulations. For the simple tandem case, the fixed point of the front flag is located at
 $(0,0)$
and the rear flag is placed at different positions. A uniform velocity
 $U_{\infty }$
is specified in the incoming flow boundary of the computational domain. A Neumann boundary condition
 $\unicode[STIX]{x2202}\boldsymbol{v}/\unicode[STIX]{x2202}x=0$
is specified at the outlet boundary. The Eulerian grid size is
 $1920\times 960$
and for each flag there are 128 Lagrangian points. For the cases of periodic arrangements, the setting is introduced in § 3.3.
The drag coefficient
 $C_{d}$
and the bending energy
 $E_{b}$
are defined as
 $$\begin{eqnarray}C_{d}=\frac{F_{x}}{\frac{1}{2}\unicode[STIX]{x1D70C}U_{\infty }^{2}L},\quad E_{b}=\frac{K}{2}\int _{0}^{L}\frac{\unicode[STIX]{x2202}^{2}\boldsymbol{X}}{\unicode[STIX]{x2202}s^{2}}\boldsymbol{\cdot }\frac{\unicode[STIX]{x2202}^{2}\boldsymbol{X}}{\unicode[STIX]{x2202}s^{2}}\,\text{d}s,\end{eqnarray}$$
respectively, where
 $F_{x}$
is the spatial integrated fluid force acting on flag projection along the
 $x$
-direction and
 $K$
is the bending coefficient.
The mean drag coefficient
 $\overline{C}_{d}$
and the mean bending energy
 $\overline{E}_{b}$
are defined as
 $\overline{C}_{d}=(1/T)\int _{t_{0}}^{t_{0}+T}C_{d}\,\text{d}t$
and
 $\overline{E}_{b}=(1/T)\int _{t_{0}}^{t_{0}+T}E_{b}\,\text{d}t$
, respectively, where
 $T$
is the flapping period.
3.1 Flapping modes for an isolated flag
First we would like to present a brief review on the behaviour of an isolated inverted flag with different bending stiffness
 $K$
in a uniform flow. Based on the previous studies (Kim et al.
Reference Kim, Cossé, Cerdeira and Gharib2013; Gurugubelli & Jaiman Reference Gurugubelli and Jaiman2015; Ryu et al.
Reference Ryu, Park, Kim and Sung2015; Tang et al.
Reference Tang, Liu and Lu2015; Sader et al.
Reference Sader, Cossé, Kim, Fan and Gharib2016a
; Shoele & Mittal Reference Shoele and Mittal2016), the flapping modes of an isolated inverted flag in a uniform flow can be approximately classified into the following four modes: straight mode, flapping mode, deflected mode and deflected–flapping mode, which depend on the bending stiffness
 $K$
. Those studies concluded that only in the flapping mode can the bending energy be effectively achieved (Ryu et al.
Reference Ryu, Park, Kim and Sung2015; Tang et al.
Reference Tang, Liu and Lu2015; Shoele & Mittal Reference Shoele and Mittal2016).
Flapping amplitude (with the full-body profile) of the flag versus
 $K$
. The key parameters are
 $Re=200$
,
 $M=2.9$
and
 $S=1000$
. The amplitude is measured from the magnitude of the transverse displacement of the flag’s head.

In the simulations, the key parameters
 $Re=200$
,
 $M=2.9$
and
 $S=1000$
are fixed and the bending stiffness
 $K$
is variable. The flapping amplitude of the inverted flag as a function of
 $K$
is shown in figure 3. It is found that when
 $K>0.4$
, the flag is in the straight mode and the amplitude is small and approaches zero. When
 $K\in (0.15,0.35)$
, the flag adopts the flapping mode, the flapping amplitude as well as the bending energy of the flag is larger. When
 $K<0.15$
, the amplitude of the flag decreases and the flag adopts the deflected mode. By further decreasing the
 $K$
, when
 $K<0.05$
, due to the low flexibility, the flag is curved to the rear with small flapping, and the amplitude is slightly larger than that of the deflected mode. This regime is referred to as the deflected–flapping mode (Gurugubelli & Jaiman Reference Gurugubelli and Jaiman2015; Tang et al.
Reference Tang, Liu and Lu2015). Previous works on the inverted flag have also shown that the flapping mode is able to achieve larger bending energy than the other modes (Gurugubelli & Jaiman Reference Gurugubelli and Jaiman2015; Ryu et al.
Reference Ryu, Park, Kim and Sung2015; Tang et al.
Reference Tang, Liu and Lu2015), therefore the flapping mode is preferred for energy applications.
3.2 Simple tandem configuration
As discussed in the above section, when
 $K\in (0.15,0.4)$
, the flag adopts the flapping mode, which is preferred for energy applications. Hence, in the study of simple two tandem inverted flags, to allow both flags to work in the flapping mode, the bending stiffness
 $K\in (0.15,0.4)$
is adopted. In particular, the typical result of
 $K=0.3$
is presented in detail. In the simulations, the two key parameters are fixed (i.e.
 $Re=200$
,
 $M=2.9$
). The effect of gap distance
 $G_{x}$
will be investigated in detail.
(a) The mean drag coefficients (
 $\overline{C}_{d}$
) and the mean bending energies (
 $\overline{E}_{b}$
) of the flags as functions of gap distance. The horizontal dashed line and dash-dotted line represent
 $\overline{C}_{d}$
and
 $\overline{E}_{b}$
of an isolated flag, respectively. The key parameters are
 $Re=200$
,
 $M=2.9$
and
 $K=0.3$
. (b) Instantaneous shapes (full-body profile) with
 $K=0.3$
for case
 $G_{x}=2.0$
. (c) The phase difference between the flapping of the two flags (
 $\unicode[STIX]{x0394}\unicode[STIX]{x1D719}/\unicode[STIX]{x03C0}$
) as a function of
 $G_{x}$
. (d) Instantaneous vorticity contours for the case in (b), where the solid and dashed lines represent the positive (anticlockwise) and negative (clockwise) vortices, respectively.

The mean drag coefficient
 $\overline{C}_{d}$
and bending energy
 $\overline{E}_{b}$
for
 $K=0.3$
as functions of
 $G_{x}$
are shown in figure 4(a). It is seen that as
 $G_{x}$
increases,
 $\overline{C}_{d}$
and
 $\overline{E}_{b}$
of the rear flag gradually increase and eventually approach those of the isolated flag. Variations of
 $\overline{C}_{d}$
and
 $\overline{E}_{b}$
of the front flag are a little more complex. For short gap distance, e.g.
 $G_{x}\leqslant 2.0$
, the rear flag has a smaller drag coefficient than that of an isolated flag. Figure 4(b) shows an example of flapping shapes for the case of the two tandem inverted flags with
 $G_{x}=2.0$
. It is seen that due to the interaction of the two flags, the flapping amplitude of the rear flag reduces significantly. Hence, smaller flapping amplitude, which means smaller area directly facing the incoming flow, leads to smaller drag force. This is consistent with the theory that the magnitude of the drag is determined mainly by the flapping amplitude (Ristroph & Zhang Reference Ristroph and Zhang2008; Kim et al.
Reference Kim, Huang and Sung2010).
The phase difference between the flappings of the two flags
 $\unicode[STIX]{x0394}\unicode[STIX]{x1D719}/\unicode[STIX]{x03C0}$
as a function of
 $G_{x}$
is shown in figure 4(c). It is a piecewise function where each segment is almost linear. Here, the phase difference was measured from the transverse displacements of the two flags’ heads (see the small schematic diagram in figure 4
c). The phase difference between the two flapping flags dictated the phase in which the rear flag encountered the vortices (Kim et al.
Reference Kim, Huang and Sung2010). Hence, the phase difference depends linearly on
 $G_{x}$
. This trend is not strongly correlated with the variation of
 $\overline{C}_{d}$
in figure 4(a). Hence, phase difference is not critical for determining the drag or bending energy.
When
 $1.0\leqslant G_{x}\leqslant 2.0$
, the inherent mechanism for the small amplitude of the rear flag may be the destructive vortices merging mode (Kim et al.
Reference Kim, Huang and Sung2010; Uddin et al.
Reference Uddin, Huang and Sung2013). The instantaneous vorticity contours for the case
 $G_{x}=2.0$
is shown in figure 4(d). It is seen that at the moment, the rear flag encounters a pair of vortices
 $(A)+(B)$
shedding from the front flag. The positive vortex (
 $A$
) will pass around the rear flag, while the negative vortex (
 $B$
) will impact the flag and interact with the positive vortex generated from the leading edge of the rear flag, resulting in destructive vortices merging. That will decrease the flapping amplitude of the rear flag (Alben Reference Alben2009; Kim et al.
Reference Kim, Huang and Sung2010). Meanwhile the former flag is almost no longer affected by the rear flag, flapping as an isolated flag.
On the other hand, it is seen that when
 $G_{x}<1.0$
the drag force of the front flag is also reduced. The possible reason is that due to the close presence of the rear flag, the pressure between the flags increases or the pressure behind the front flag increases. Hence the drag force experienced by the front flag will decrease.
At other
 $K\in (0.15,0.4)$
, the trends of the curves for drag force
 $\overline{C}_{d}$
and bending energy
 $\overline{E}_{b}$
are similar to those of
 $K=0.3$
, which is discussed above (figure 4). Actually both the drag force and bending energy are proportional to the flapping amplitude of the flag facing the incoming flow or the maximum bending deformation. Smaller flapping amplitude of the rear flag leads to smaller bending energy. Hence, compared to the two isolated inverted flags, the simple tandem arrangement is not a good choice since the bending energy of the rear flag reduces significantly. However, if coupled tandem inverted flags are placed side by side along the
 $y$
-axis, the performance of energy applications may be improved. In the following, coupled inverted flags are proposed to be arranged as two rows and flags in the front and rear rows are in-line or staggered. The performance of the in-line and the staggered arrangements will be investigated in detail.
3.3 Periodic arrangement
In order to achieve more bending energy from the inverted flags, a periodic tandem arrangement in the
 $y$
direction is proposed. In the arrangement, the inlet and outlet boundary conditions are identical to those in the above simulations. However, due to the periodic arrangement, the upper and lower boundaries are set to be the periodic. The typical domain size is
 $L_{x}\times L_{y}=[-15,45]\times [-2,2]$
in the case
 $L_{y}=4.0$
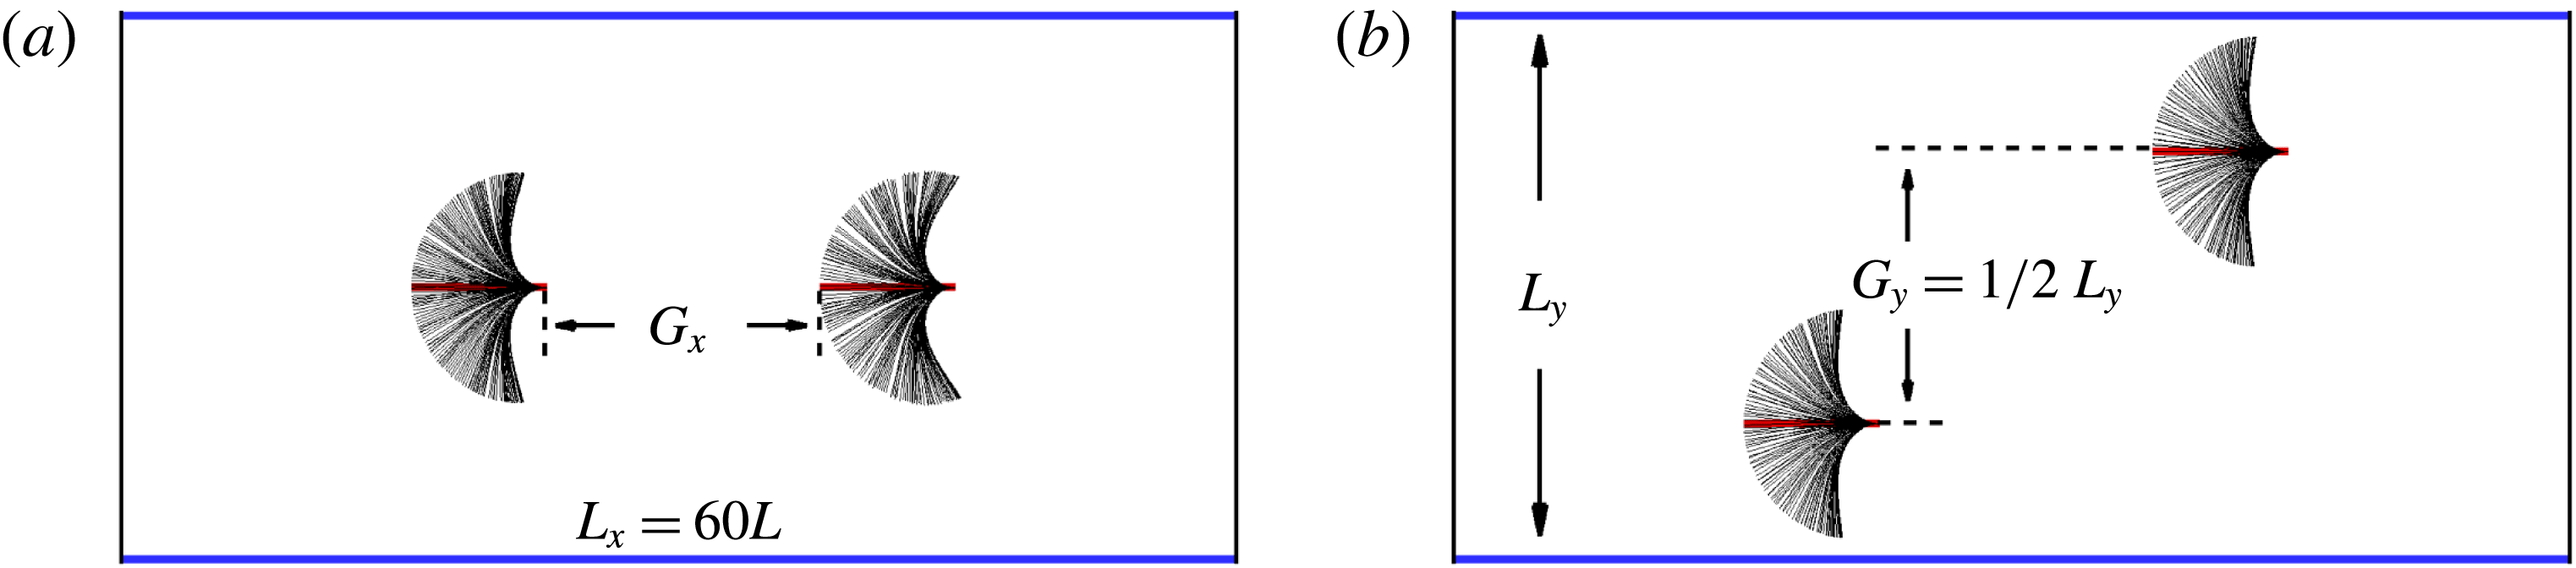
. Two typical arrangement patterns are considered: the in-line arrangement with
 $G_{y}=0$
and the staggered arrangement with
 $G_{y}=L_{y}/2$
(see figure 5). In the simulations, some parameters
 $Re=200$
,
 $M=2.9$
and
 $K=0.3$
are fixed and both
 $G_{x}$
and
 $L_{y}$
vary. The effects of
 $G_{x}$
and
 $L_{y}$
are investigated to achieve more bending energy. In this section, both the in-line arrangement (
 $G_{y}=0$
,
 $L_{y}=4.0$
) and the staggered arrangement (
 $G_{y}=L_{y}/2$
,
 $L_{y}=4.0$
) are investigated.
Instantaneous shapes (blue solid lines represent the periodic boundary) with
 $K=0.3$
,
 $G_{x}=2.0$
for cases (a) in-line mode (
 $G_{y}=0$
,
 $L_{y}=4.0$
), (b) staggered mode (
 $G_{y}=L_{y}/2=2.0$
,
 $L_{y}=4.0$
).
The mean drag coefficients and bending energies of the flags as functions of horizontal distance
 $G_{x}$
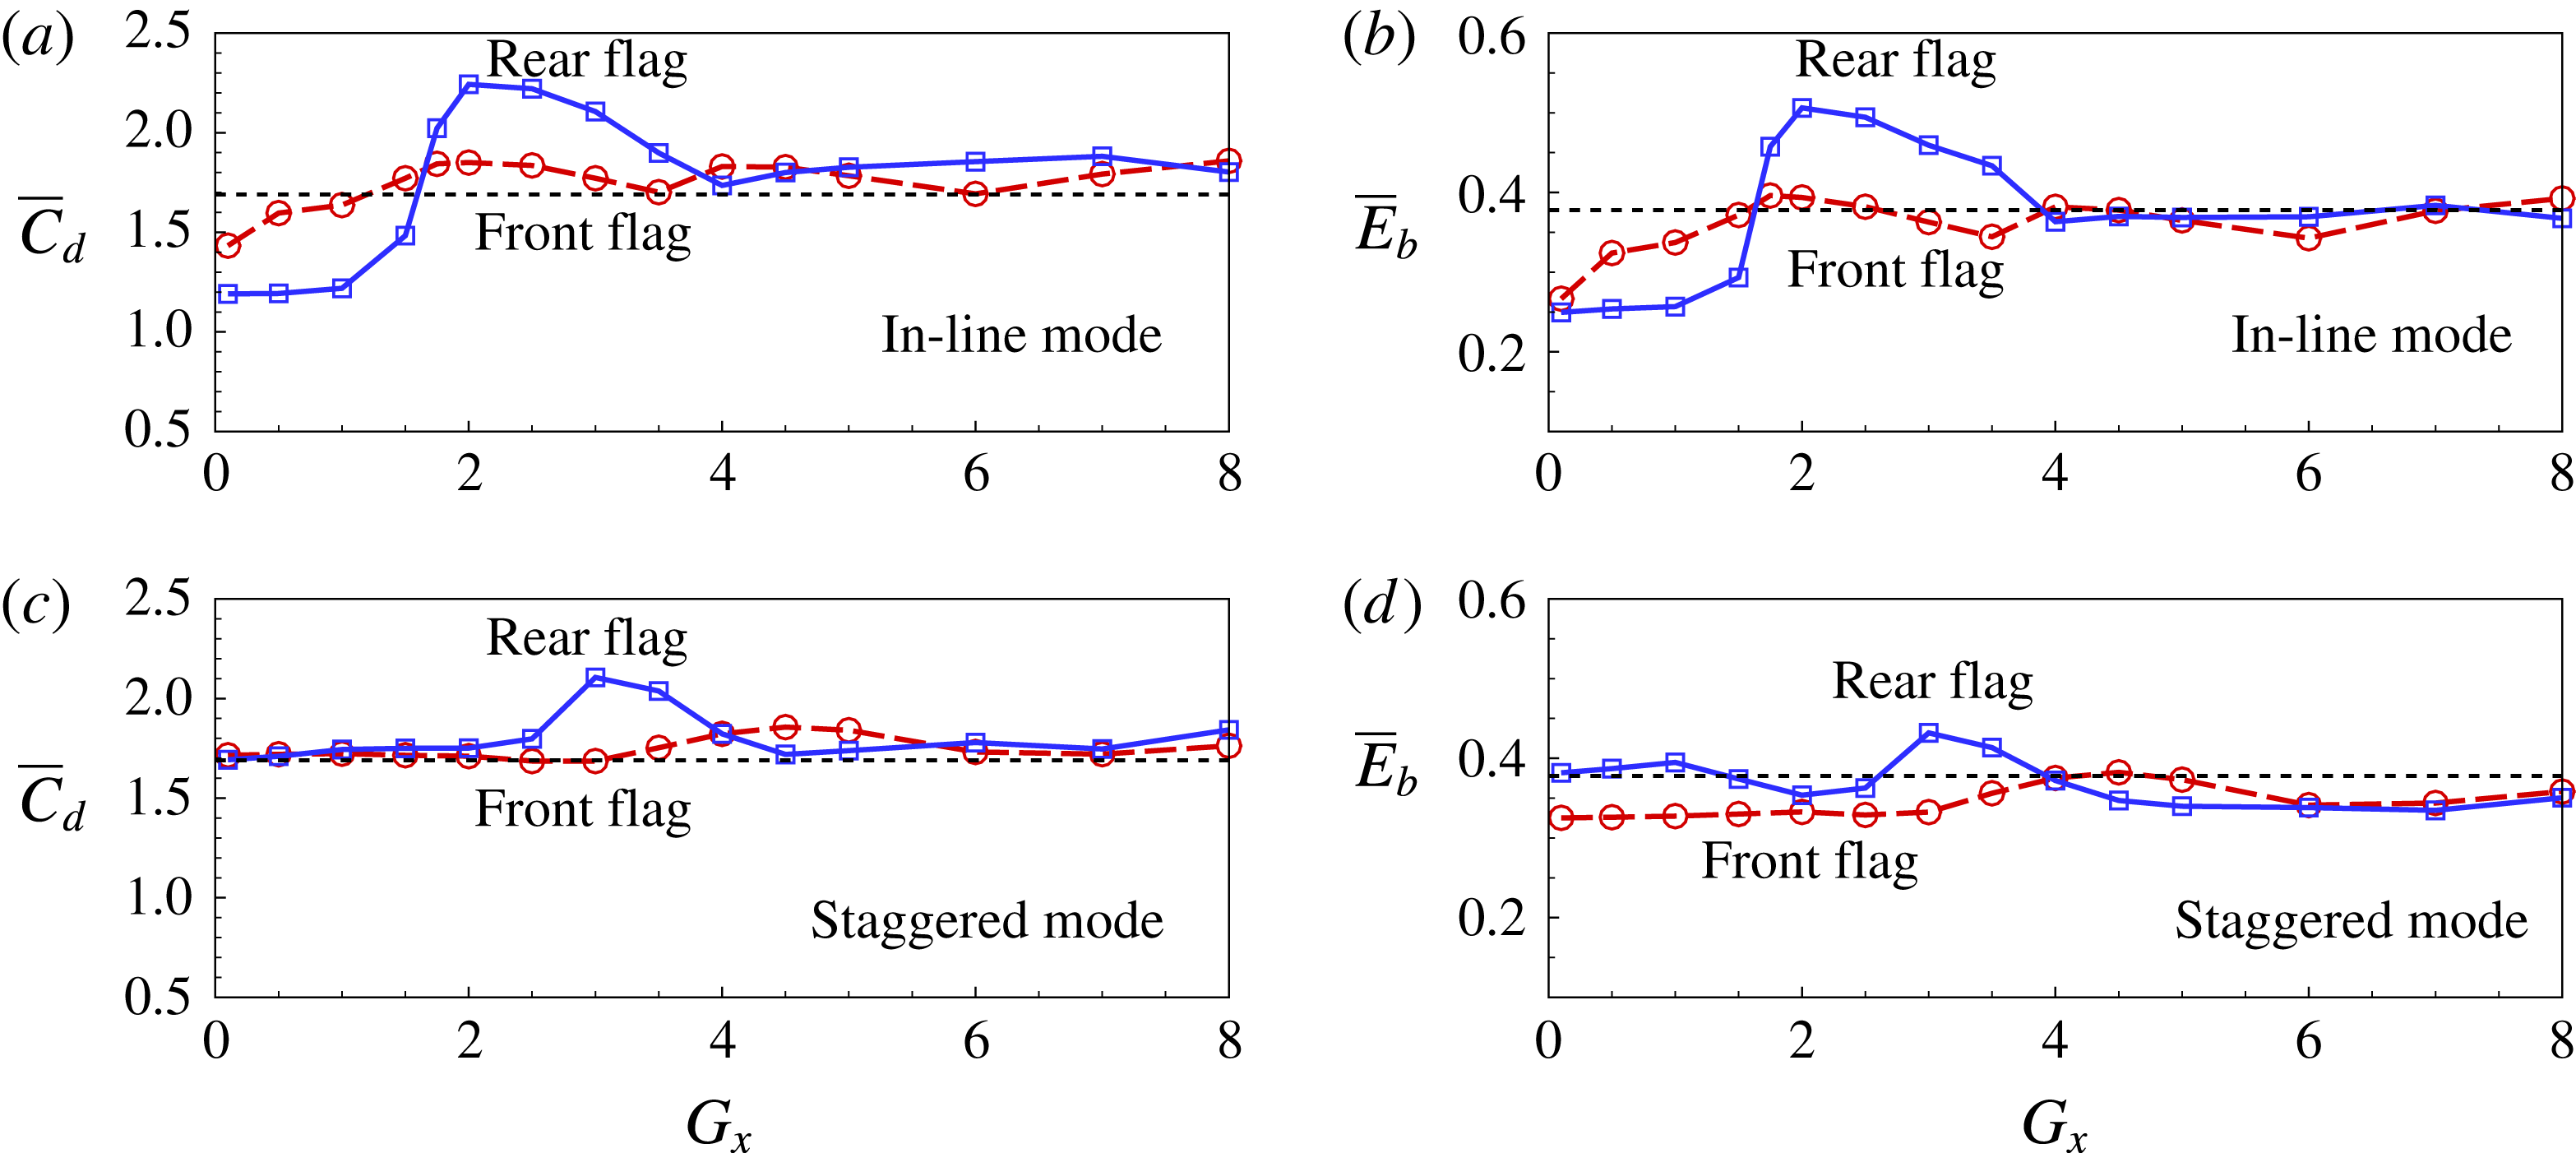
are shown in figure 6. It is seen that, compared to the case of an isolated inverted flag (black dashed line), for both arrangements the drag force and bending energy of the rear flag can be significantly improved, i.e. be higher than those in the case of an isolated inverted flag. It is also seen that the performances of the rear inverted flags reach their peaks at
 $G_{x}\approx 2.0$
and 3.0 for the in-line and staggered arrangement, respectively. Meanwhile, the performance of the front flag is close to that of an isolated flag. Therefore, periodic arrangements do improve the bending energy achieved. Compared to the situation of the simple tandem case, the significant improvement of the rear flag may be attributed to the lateral interaction among the flags.
The mean drag coefficients and bending energies of the flags as functions of
 $G_{x}$
with
 $K=0.3$
and
 $L_{y}=4.0$
, for cases (a,b) in-line mode (
 $G_{y}=0$
), (c,d) staggered mode (
 $G_{y}=L_{y}/2$
). Black dashed lines represent the drag coefficient in (a,c) and the bending energy in (b,d) of an isolated flag.
The mean drag coefficients (a) and bending energies (b) of the flags as functions of
 $L_{y}$
with
 $G_{x}=2.0$
and
 $K=0.3$
. Black dashed horizontal lines in (a) and (b) represent the drag coefficient and bending energy in the case of an isolated flag, respectively.
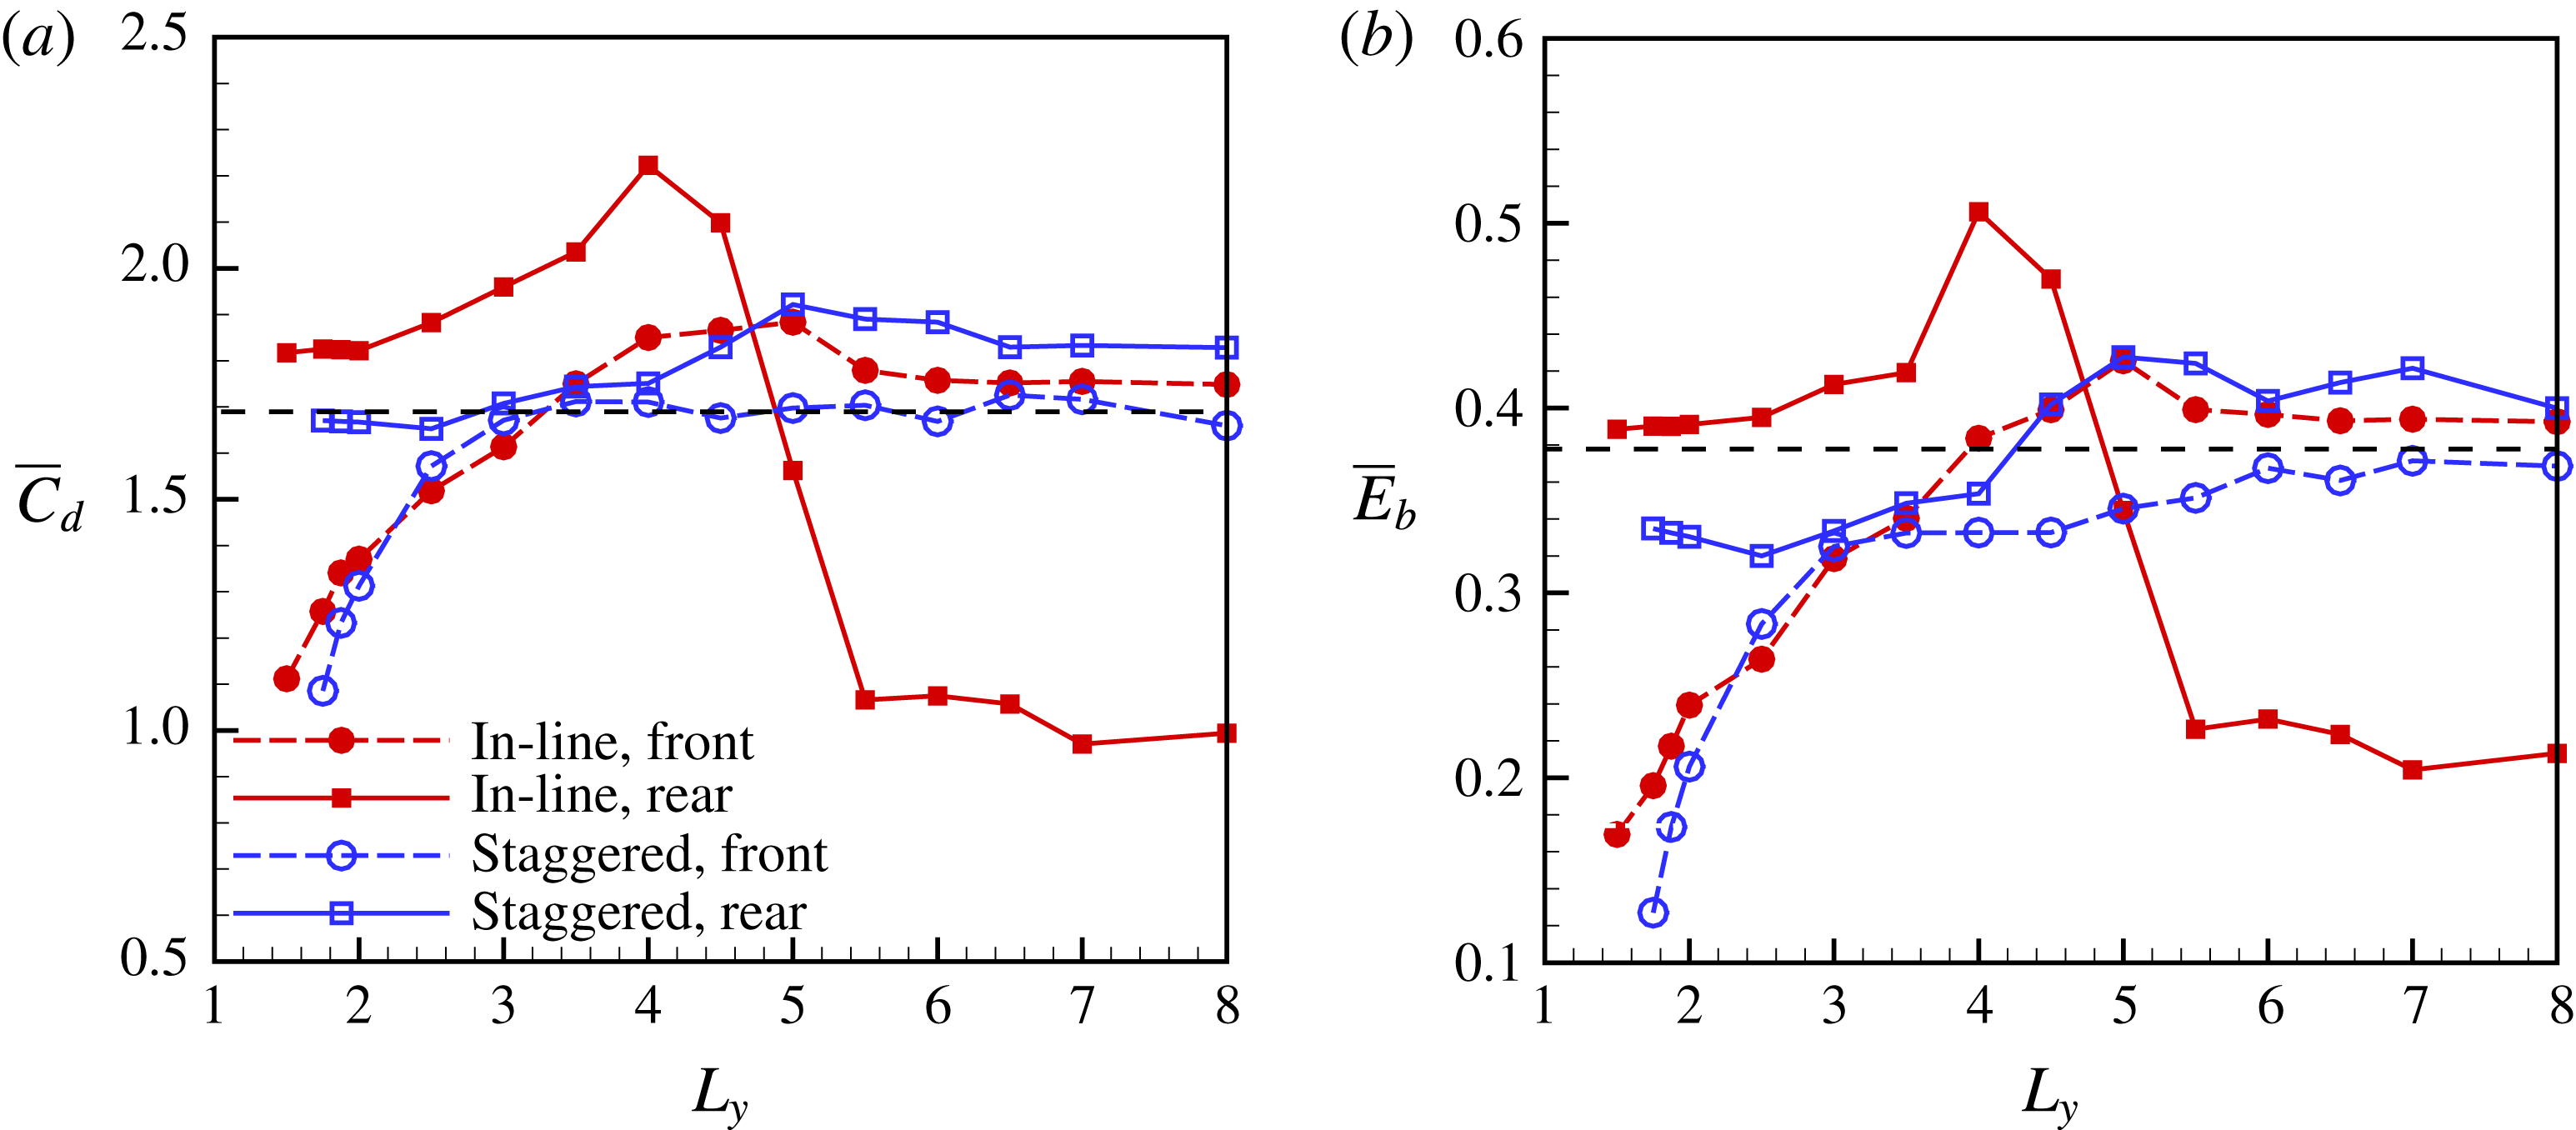
Here the effect of
 $L_{y}$
on the performance is also investigated. In the simulations, for both arrangements,
 $G_{x}=2.0$
is fixed. The mean drag coefficients and bending energies of the flags as functions of
 $L_{y}$
are shown in figure 7. The results of cases with
 $L_{y}<1.5$
are not shown here because if the lateral gap is too narrow, the neighbouring flags in the
 $y$
-direction initially look like the walls of a narrow channel and the flag’s flapping will be confined. In other words, the flags are difficult to flap in the cases with narrow gaps (see
 $\overline{C}_{d}$
and
 $\overline{E}_{b}$
of the front flag in figure 7). Besides, in practical applications the narrow gap arrangement is not preferred because flags may undergo collisions with their neighbours. It is seen that the drag force and bending energy of the rear inverted flag reach their peaks at
 $L_{y}=4.0$
and 5.0 in the in-line and staggered arrangements, respectively. As an example, the instantaneous shapes for the in-line case with the highest
 $\overline{C}_{d}$
and
 $\overline{E}_{b}$
is shown in figure 5(a). It is seen that in the in-line case the maximum bending deformation of the rear flag is significantly larger than that of the front one or the isolated one.
It is also noted that for the staggered arrangement, as
 $L_{y}$
increases, the drag force as well as the bending energy of the front and rear inverted flags will approach those of the isolated case (black dashed line). While for the in-line arrangement, as
 $L_{y}$
increases, the drag force and bending energy of the two inverted flags will approach those in the case of simple tandem inverted flags.
Instantaneous vorticity contours (blue solid lines represent the periodic boundary) at the time
 $t\approx 450$
with
 $K=0.3$
,
 $G_{x}=2.0$
and
 $L_{y}=4.0$
for cases (a) in-line mode (
 $G_{y}=0$
), (b) staggered mode (
 $G_{y}=L_{y}/2$
). The solid and dashed lines represent the positive (anticlockwise) and negative (clockwise) vortices, respectively.

The mechanism of the performance enhancement will be explored. For the in-line arrangement, the instantaneous vorticity contours are shown in figure 8(a). It is seen that the wake vortices of the front flag are concentrated in the centre area. When the pair of vortices
 $P$
(
 $A+B$
) are released, an
 $S$
vortex (
 $C$
) is also shed and the vortices mode is the
 $P+S$
mode (Ryu et al.
Reference Ryu, Park, Kim and Sung2015). The first vortex (
 $A$
) shed from the front flag will pass around the rear flag and the latter two vortices
 $(B)+(C)$
will impact the rear flag (see supplementary movie available online at https://doi.org/10.1017/jfm.2017.875). Finally the dominant negative vortex (
 $C$
) interacts with the negative vortex generated from the leading edge of the rear flag by a constructive vortex merging mechanism (Alben Reference Alben2009; Kim et al.
Reference Kim, Huang and Sung2010), which enhances the leading edge vortex of the rear flag. Because the leading edge vortex is generally attributed to the flapping (Gurugubelli & Jaiman Reference Gurugubelli and Jaiman2015), the enhanced leading edge vortex results in a significant increase in the flapping amplitude or the maximum bending deformation of the rear flag. As we discussed in § 3.2, the situation of simple tandem inverted flags is totally different due to the destructive vortices merging.
In the staggered arrangement, figure 8(b) shows the instantaneous vorticity contours. It is seen that due to the staggered arrangement, the first two vortices
 $(A)+(B)$
shed from the front flag can impact the rear flag, and the third vortex (
 $C$
) will pass around the rear flag. For the vortices
 $A$
and
 $B$
, the positive vortex (
 $B$
) shed from the front flag is dominant and interacts with the positive vortex shed from the leading edge of the rear flag, which leads to the constructive vortices merging. Hence, in both arrangements, the leading edge vortex of the rear flag always merges constructively with the vortex shed from the front flag. This kind of constructive vortex merging mechanism can amplify the flapping amplitude or the maximum bending deformation and the bending energy of the rear flag.
Instantaneous vorticity contours (blue solid lines represent the periodic boundary) with
 $K=0.3$
for cases (a) in-line mode (
 $G_{x}=1.0$
,
 $L_{y}=4.0$
), (b) in-line mode (
 $G_{x}=2.0$
,
 $L_{y}=2.0$
). The solid and dashed lines represent the positive (anticlockwise) and negative (clockwise) vortices, respectively.

The other typical interactions among vortices, which are significantly different from the constructive merging mode, are shown in figure 9. It is seen from figure 9(a) that in the case with
 $G_{x}=1.0$
and
 $L_{y}=4.0$
, due to the short longitudinal space, the vortex generated by the front flag encounters the rear flag before it is shed. It may transport along the rear flag. Hence, the rear flag is not able to take advantage of the constructive vortex merging mode and the flapping of the rear flag is inhabited. It is also seen from figure 6(a,b) that the flapping of the front flag is close to that of the isolated one.
On the other hand, from figure 9(b), it is seen that when
 $L_{y}$
is small, due to the confinement effect from the neighbouring flags in the
 $y$
-direction, the front flag experiences less drag and its flapping amplitude decreases (see figure 7). Similar to the case with
 $G_{x}=2.0$
and
 $L_{y}=4.0$
, in this case (
 $G_{x}=2.0$
,
 $L_{y}=2.0$
) the vortex merging mode is constructive, which may induce a large flapping for the rear flag. For the rear flag, the negative effect due to the confinement is partially cancelled by the positive effect due to the constructive vortices merging. Hence, the performance of the rear flag is close to that of the isolated flag, which is much better than that of the front flag (see figure 7).
In the above discussion, optimal
 $G_{x}$
and
 $L_{y}$
for the best performance of the rear flag could be identified. The two periodic arrangements are able to enhance the bending energy of the rear flag significantly. Meanwhile, the bending energy of the front flag is close to that of an isolated inverted flag.
3.4 Multiple groups of tandem configuration
The above periodic arrangement in the
 $y$
-direction allows us to mimic an infinite number of flags along the
 $y$
-axis which are assumed to be locked in an in-phase synchronization. On the other hand, in reality, the flags are finite and it is not obvious that several flags in parallel arrangement should be in phase. The phase difference of two conventional parallel flags has been studied in the literature (Alben Reference Alben2009; Mougel, Doaré & Michelin Reference Mougel, Doaré and Michelin2016) and seems to depend on the lateral spacing between flags (i.e.
 $L_{y}$
here).
In this section, first it is necessary to carry out simulations with multiple inverted flags to see whether the greater the number of flags, the closer the bending energy is to that in the periodic arrangement. Second, we also investigate whether the flapping phase difference would affect the performances of the flags.
In the following descriptions, each tandem configuration is referred to as a group. Multiple groups of tandem flags placed laterally inside a large computational domain are simulated. The domain is large enough to eliminate the effect of the boundary condition. The inverted flags were placed in the central region of the domain. The far field boundary condition is applied in the upper and lower boundary of the computational domain. The inlet and outlet boundary conditions are identical to those in § 3. The typical domain size is
 $L_{x}\times L_{y}=[-15,45]\times [-45,45]$
in the case of 12 groups with
 $L_{y}=4.0$
.
Since the largest
 $\overline{E}_{b}$
can be achieved in the in-line case (
 $G_{y}=0$
) with
 $G_{x}=2$
,
 $L_{y}=4$
and
 $K=0.3$
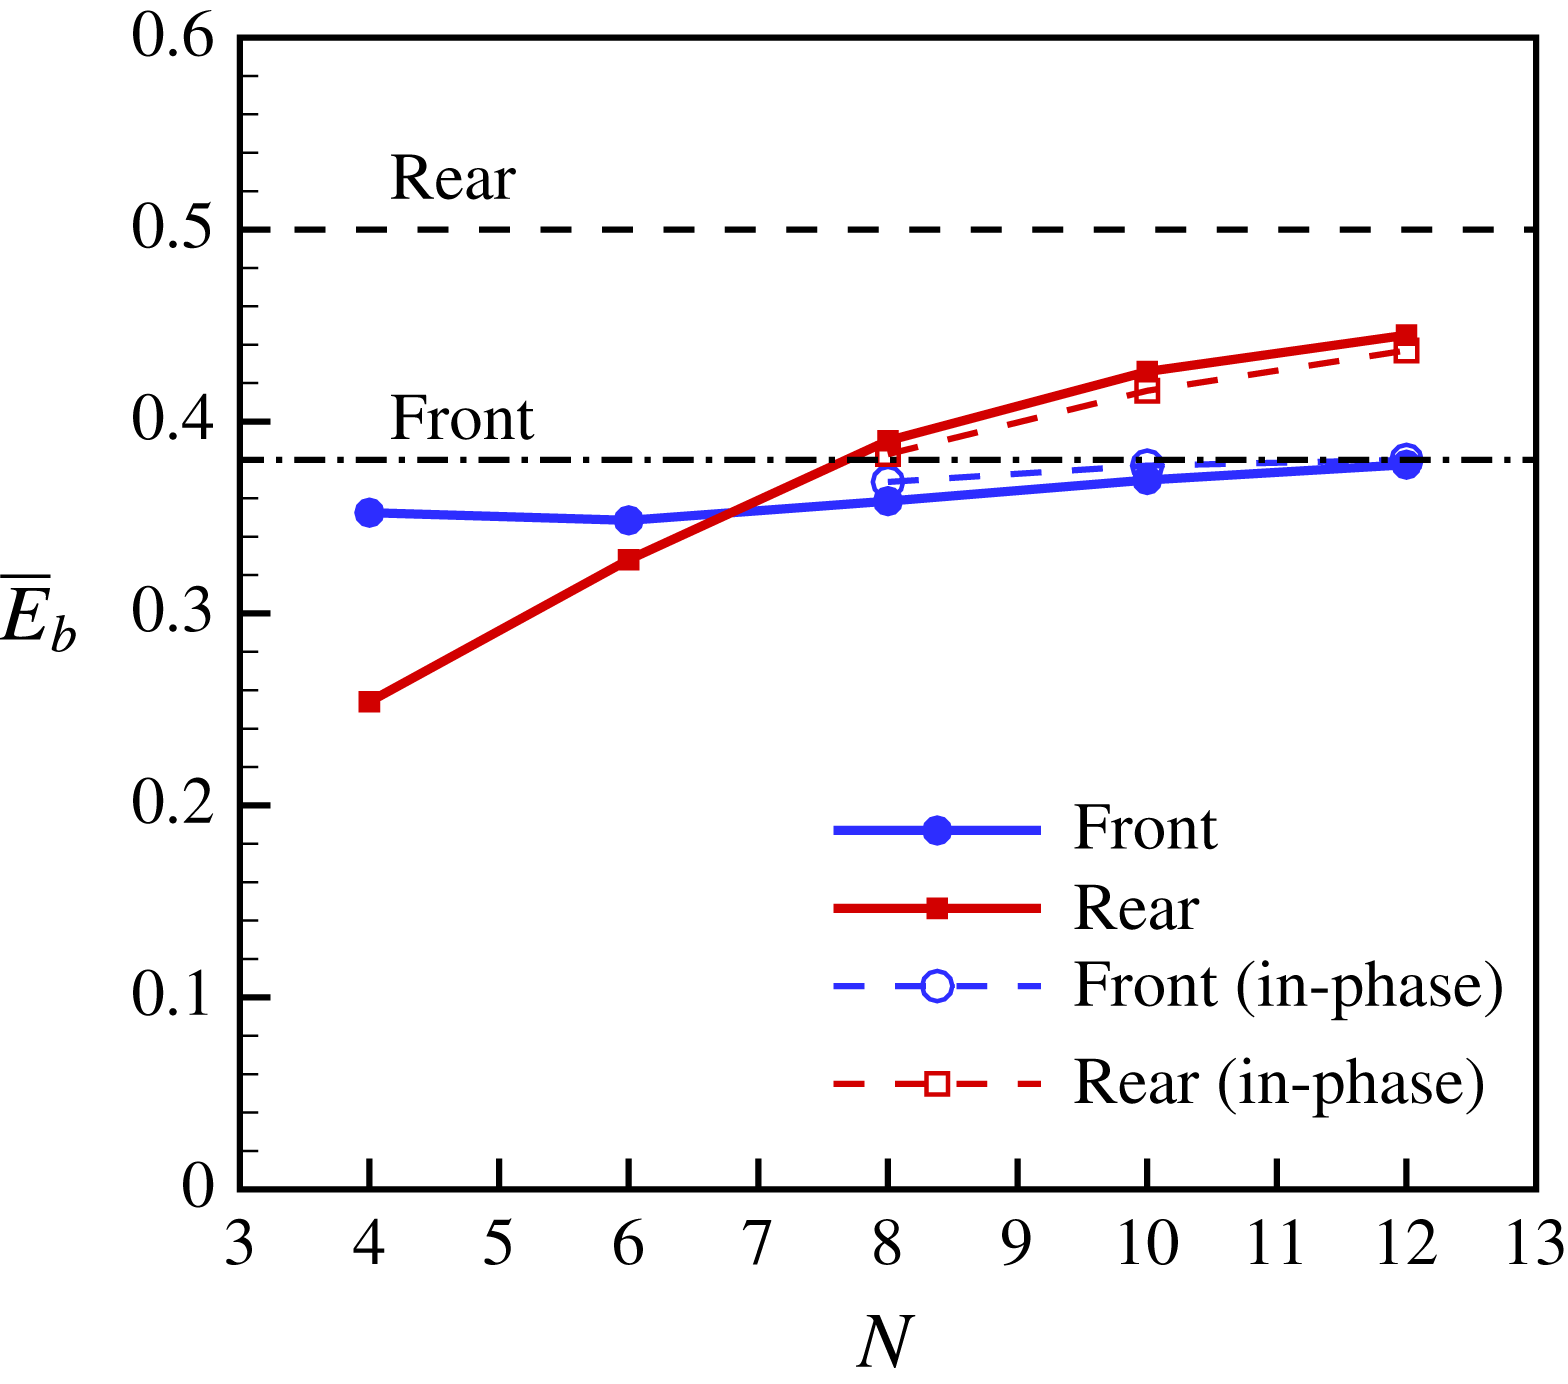
according to the above study (see figure 7), these parameters were adopted in this section. Cases with 4, 6, 8, 10 and 12 groups of tandem flags are simulated. The bending energy of the middle group as a function of group number
 $N$
is presented in figure 10. It is seen that when
 $N$
increases, the bending energies of the front and rear flags in the middle group approach those in the infinite case, i.e. the periodic case. It is noted that in the cases with finite groups, the bending energies of the middle groups are larger than those of the outer groups.
Bending energy of the middle flags as a function of the number of groups. In all cases,
 $G_{x}=2.0$
,
 $L_{y}=4.0$
,
 $K=0.3$
. The upper and lower horizontal lines denote the bending energy of the rear and front flags in the periodic arrangement, respectively. The solid lines represent the antiphase equilibrium state. The dashed lines represent the in-phase quasi-equilibrium state.
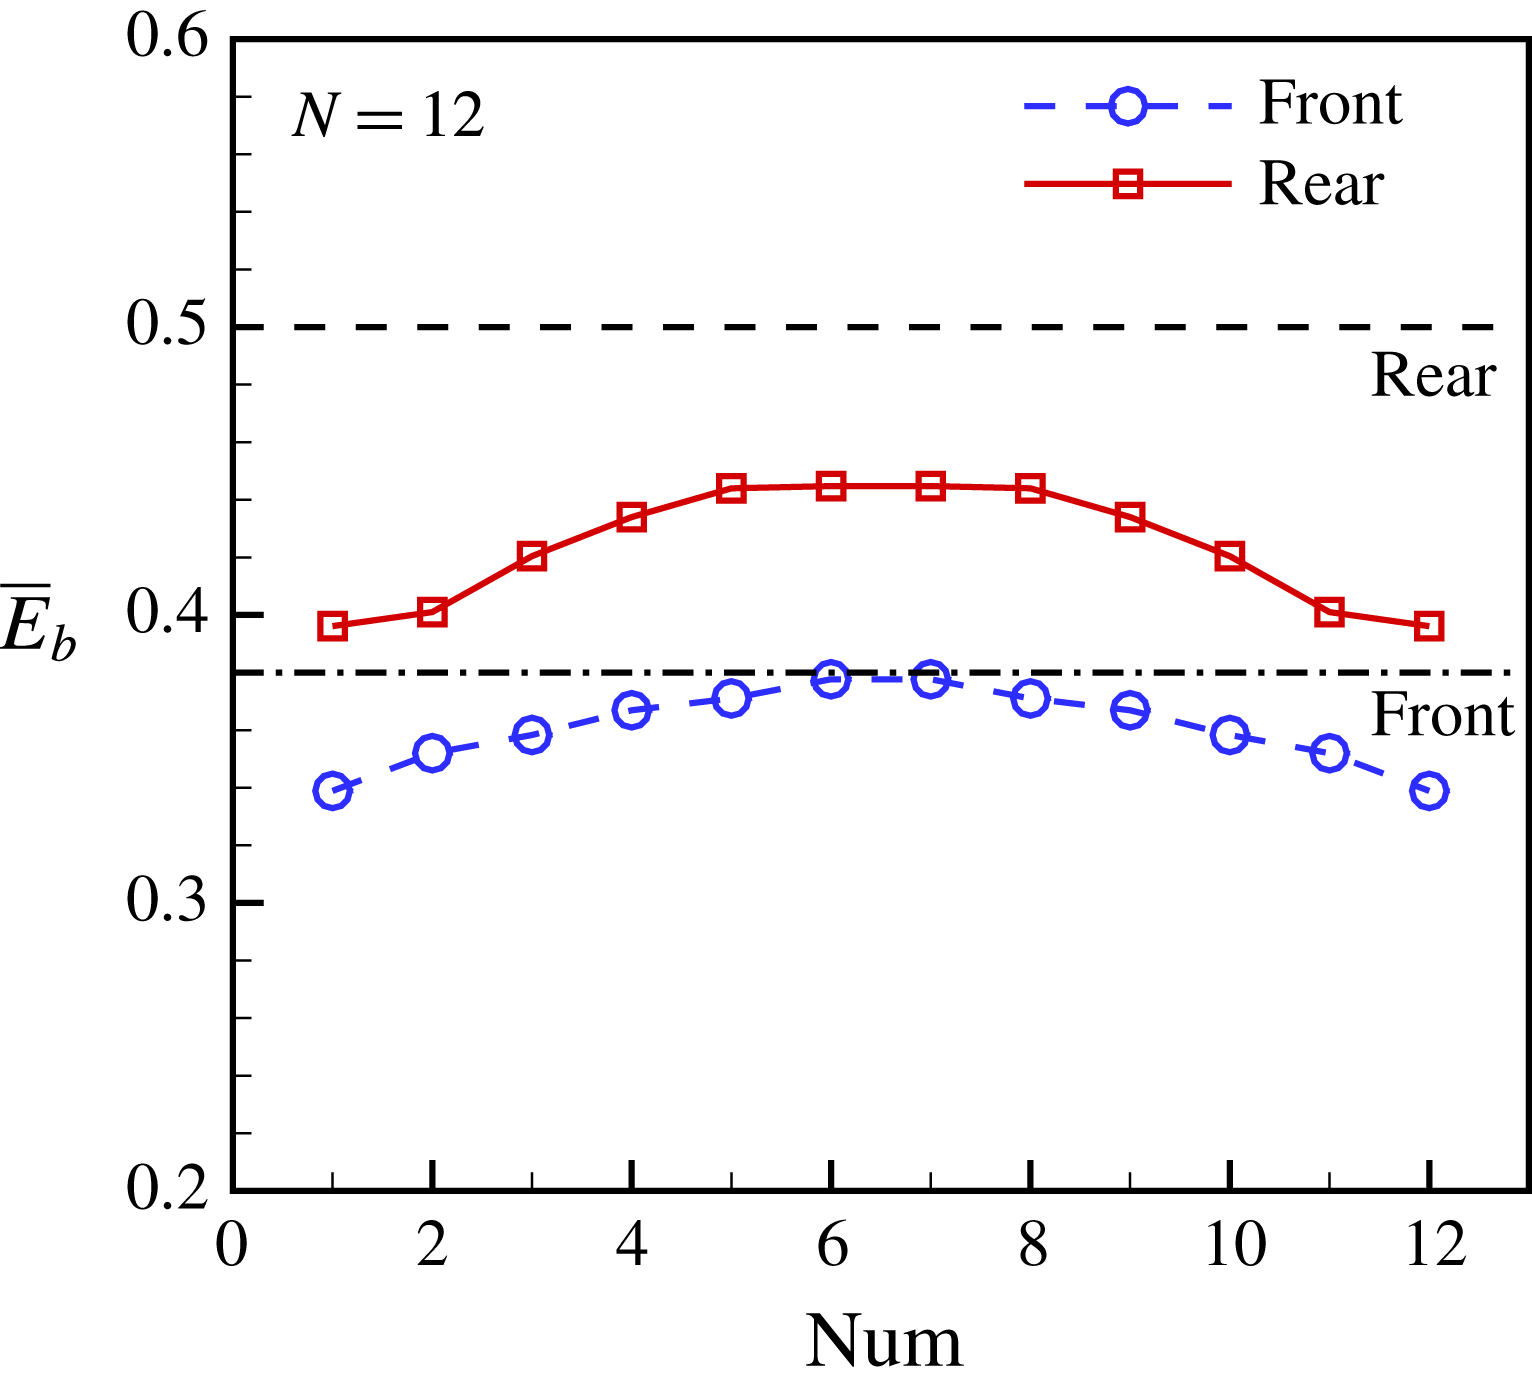
The bending energy of each flag in the case with 12 groups is shown in figure 11. It is seen that the inner groups, i.e. groups 5–8, achieve larger
 $\overline{E}_{b}$
values than the outer groups. The bending energies of the inner groups are close to those of the periodic case. This can be interpreted in the following way. Section 3.3 has shown that the periodic arrangement will enhance the performance of the flags. The inner groups are more periodic-like than the outer groups. Hence, the inner groups will take more advantage from the periodic-like arrangement than the outer groups. From figure 11, it is also seen that due to the symmetry of the flow field, the
 $\overline{E}_{b}$
distributions for the front and rear flags are all symmetric with respect to the middle position.
Performance of each flag in the case with 12 groups (
 $Num=1$
and 12 represent the bottom and top groups, respectively). In this case,
 $G_{x}=2.0$
,
 $L_{y}=4.0$
,
 $K=0.3$
. The upper and lower horizontal lines denote the bending energy of the rear and front flags in the periodic arrangement, respectively.
It is noticed that in figure 10, for the rear row, from
 $N=10$
to
 $N=12$
, the increase of
 $\overline{E}_{b}$
is approximately 4.4 %. The increase is essentially reasonable because in the incompressible flow field, a small disturbance may induce a significant difference for the flow field (Huang et al.
Reference Huang, Olson, Kerekes and Green2006). Due to the limited computational resources, simulations with more groups were not performed. However, the more groups there are, the closer the situation is to the case of infinite groups. It is believed that the performance of the inner groups would be identical to that of the infinite case if the group number
 $N$
is large enough.
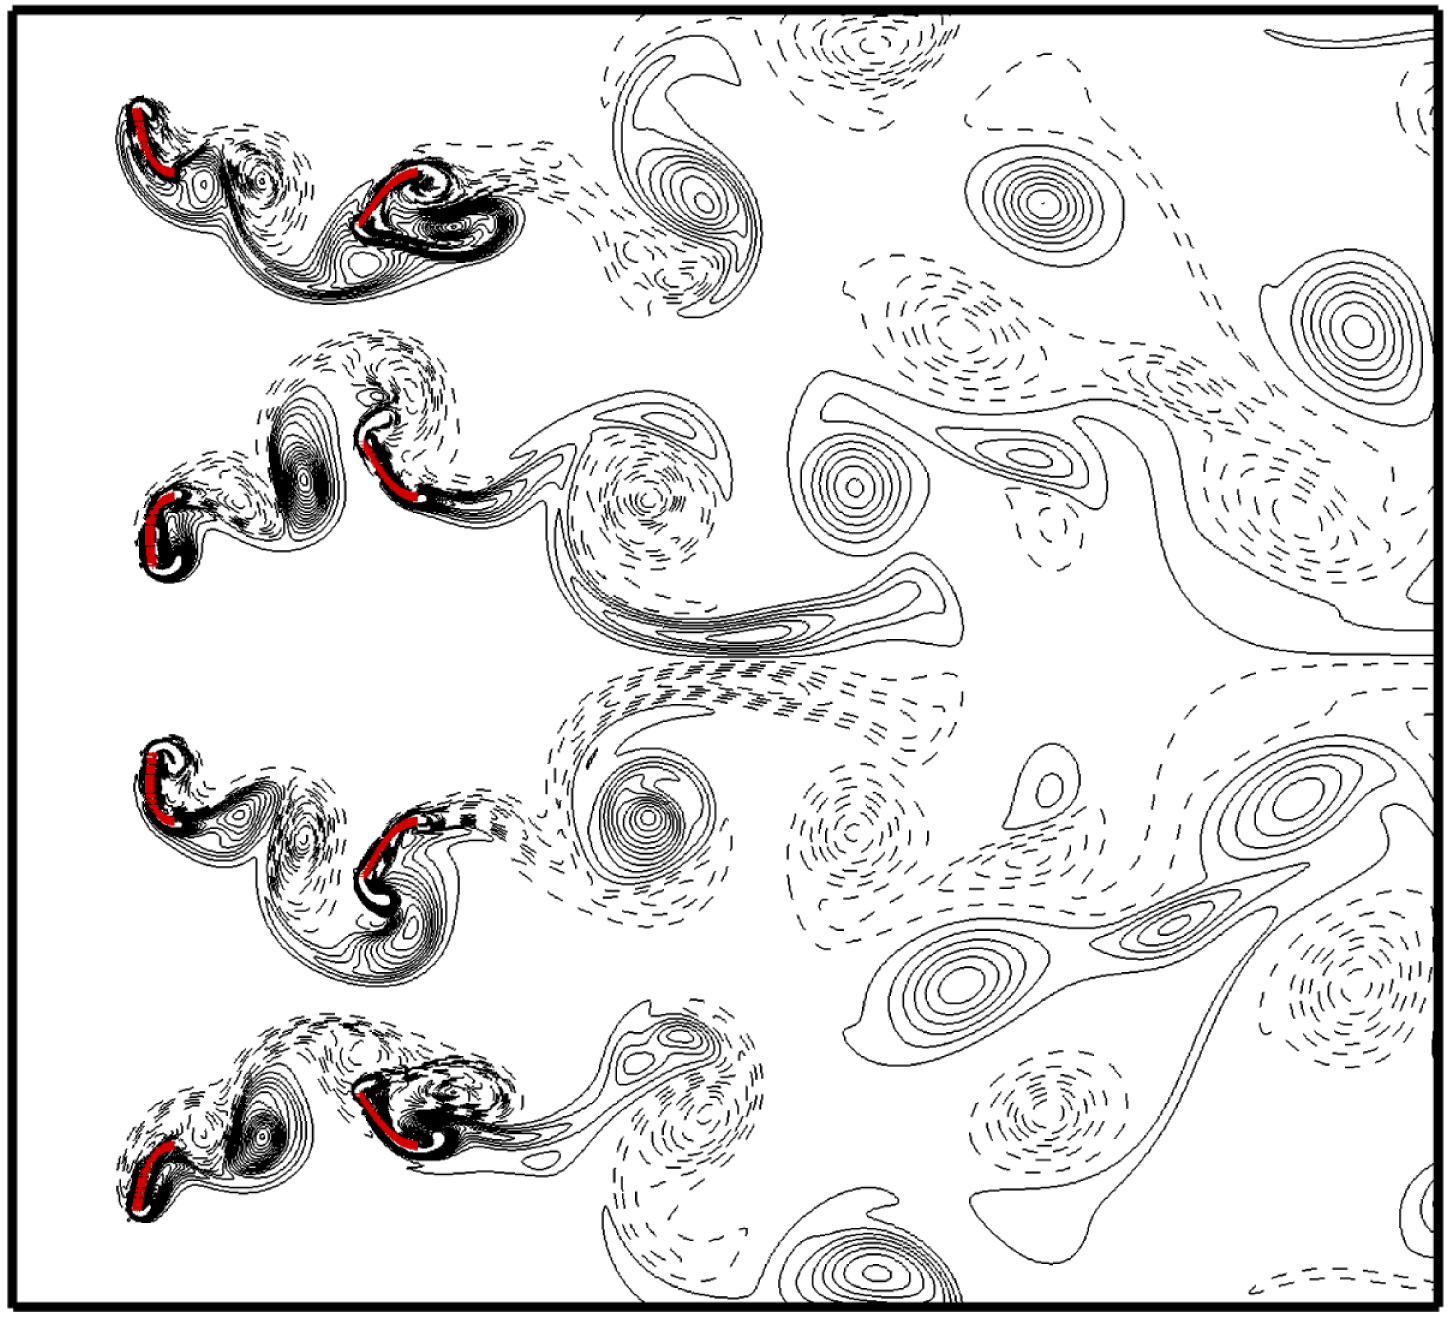
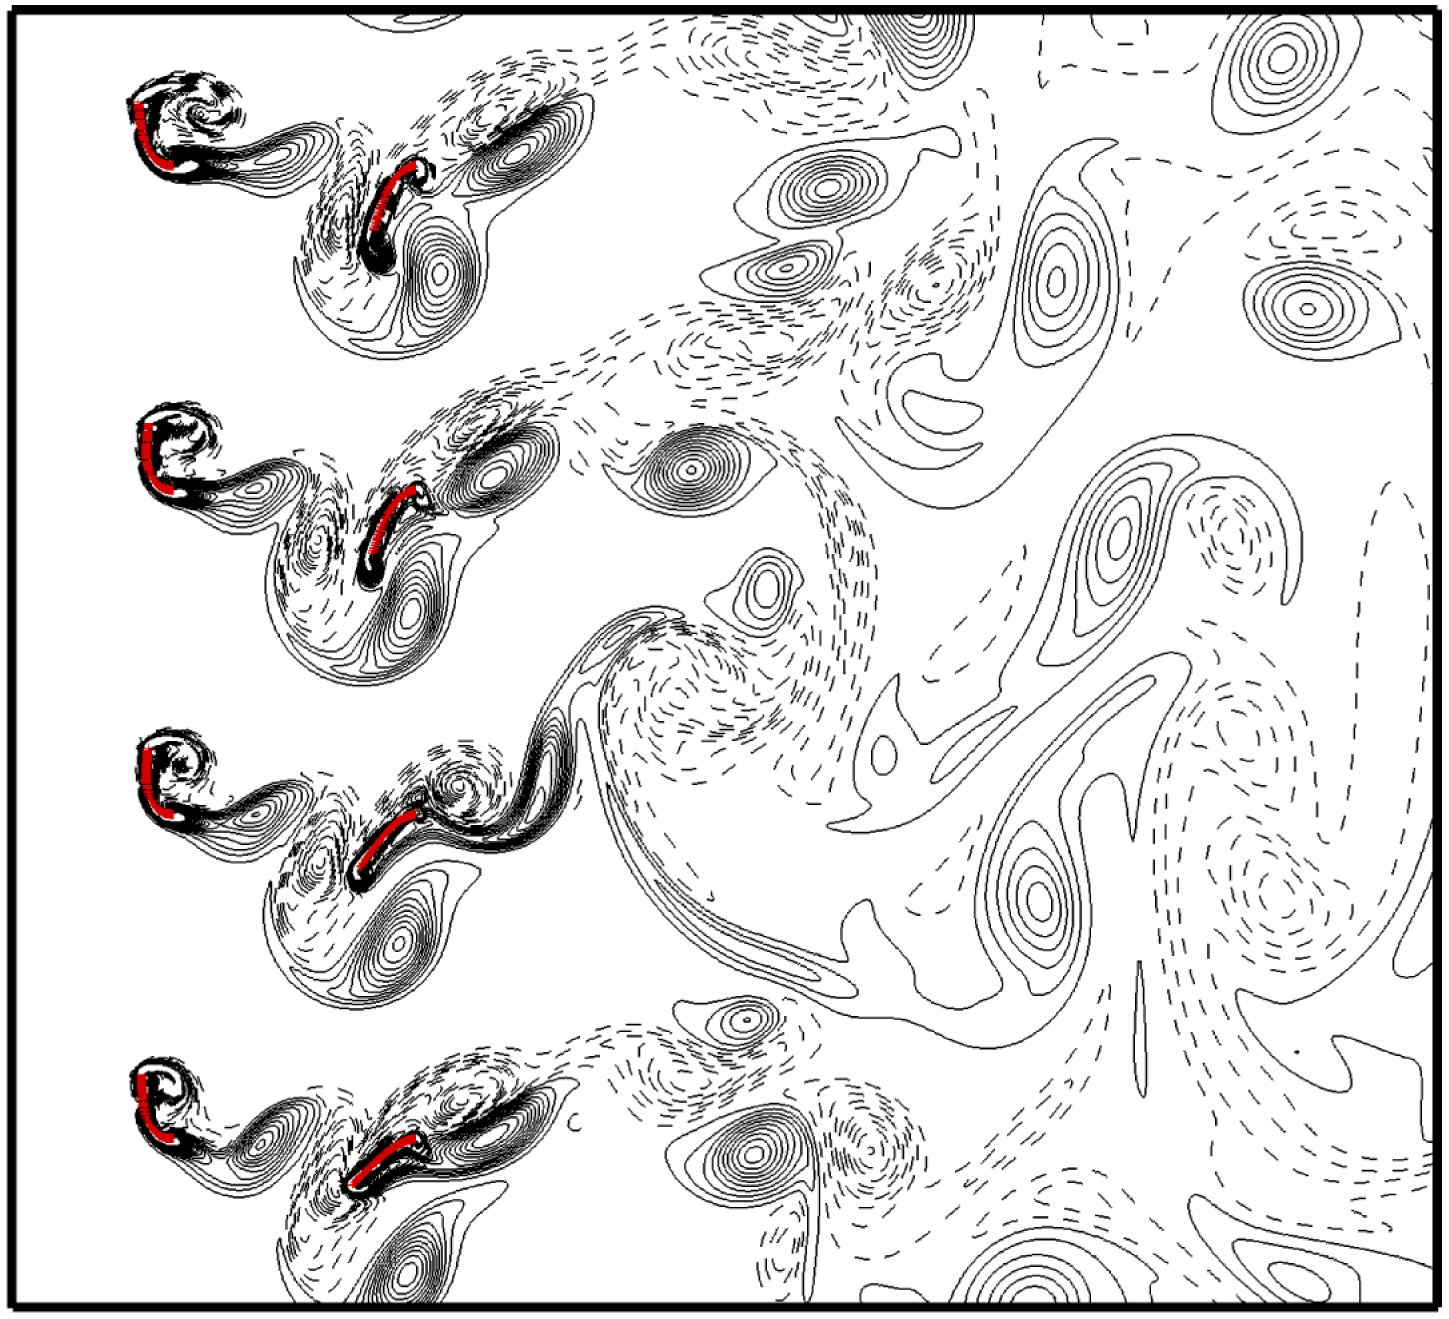
It is noticed that in the above simulations with different group numbers, at the equilibrium state, the flapping flags of neighbouring groups are usually in antiphase. Instantaneous vorticity contours in the inner four groups for the case with
 $N=12$
are shown in figure 12. It is seen that at the equilibrium state, the flapping flags of any two neighbouring flags in the
 $y$
-direction are antiphase. The state is naturally formed since initially all the flags are flat and the flags gradually evolve to the equilibrium state with antiphase flappings. It is also seen from figure 12 that the wake far away from the rear flags is no longer regular. However, the constructive vortex merging mode between the front and rear flags in each group can be identified clearly, which is similar to the mode in figure 8(a).
Vorticity contours for the inner four groups in the case with
 $G_{x}=2.0$
,
 $L_{y}=4.0$
,
 $K=0.3$
, and total group number
 $N=12$
. The solid and dashed lines represent the positive (anticlockwise) and negative (clockwise) vortices, respectively.
On the other hand, if all of the flags in the simulation were initially specified by a small identical in-phase deformation, the flapping of the flags may approach the in-phase state for a long time, e.g. 20 periods, then gradually approach the terminal antiphase equilibrium state. The in-phase flapping may be regarded as a quasi-equilibrium state. The vorticity contours at the quasi-equilibrium state (the in-phase flapping) for the inner four groups are shown in figure 13. It is seen that the in-phase flapping is not so perfect, especially for the row of rear flags. However, for each group, the vortex merging mode is identical to that in the periodic arrangement (see figure 8 a). Hence, the performances of the front and rear flags in figure 13 should also be close to those in the periodic arrangement. Data for in-phase flappings at the quasi-equilibrium state are also presented in figure 10. It is seen that bending energies of the rear and front flags in the in-phase state are very close to those in the antiphase state. Hence, the phase difference of neighbouring groups does not affect the performance of the inverted flags.
Vorticity contours at the quasi-equilibrium state (the in-phase flapping) for the inner four groups in the case with
 $G_{x}=2.0$
,
 $L_{y}=4.0$
,
 $K=0.3$
and
 $N=12$
. The solid and dashed lines represent the positive (anticlockwise) and negative (clockwise) vortices, respectively.
4 Conclusion
The interaction of inverted flexible flags with
 $M=2.9$
in a uniform flow with
 $Re$
of order 200 is investigated numerically. Although the Reynolds number here is much lower than that in the experiments (Kim et al.
Reference Kim, Cossé, Cerdeira and Gharib2013), important insights are made. First the flapping modes of an isolated inverted flag which depend on
 $K$
are reviewed. Proper parameters for the flapping mode are adopted in our studies. Secondly, the drag force and bending energy of simple two tandem inverted flags as functions of gap distance
 $G_{x}$
are investigated. It is found that for a smaller
 $G_{x}$
, the drag force and the bending energy of the rear flag may be greatly reduced due to the interaction of the tandem flags, which may be due to the destructive vortex merging mode.
In order to achieve more bending energy of the inverted flags, cases of infinite flags with a periodic boundary condition were simulated. In these cases, two periodic arrangements for coupled tandem flags were investigated: in-line and staggered arrangements. It is found that in both arrangements, the flapping amplitude or maximum bending deformation and bending energy of the rear flag are greatly improved and the energy reaches a peak at certain positions, such as
 $G_{x}=2.0$
and
 $L_{y}=4.0$
for the in-line arrangement and
 $G_{x}=3.0$
and
 $L_{y}=5.0$
for the staggered arrangement. The bending energy obtained from the rear flag is significantly higher than that from the isolated case. Meanwhile, the energy achieved from the front flag is close to that of the isolated inverted flag. Hence, an enhancement effect is achieved. It is also found that the better performance of the two arrangements may be attributed to the constructive vortex merging mode.
Actually, in the case of an infinite number of flags, due to the lateral periodic boundary condition, the in-phase synchronization in each row is imposed. In § 3.4, results for cases of finite multiple flags without such constraint were presented. It is found that antiphase synchronization is preferred for the cases of multiple flags, which is different from that in the infinite cases. However, bending energies of the rear and front flags in the in-phase state are very close to those in the antiphase state. In other words, the phase difference of neighbouring groups does not affect the performance of the inverted flags. In addition, when the group number is large enough, the bending energies of the front and rear flags in the inner groups would be close to those in the infinite case. The idea here may trigger further innovative designs for better energy harvesting device using the inverted flags.
Acknowledgements
X.-Y.L. is supported by National Natural Science Foundation of China (NSFC) grant nos. 11372304 and 11621202. H.H. is supported by NSFC grant no. 11772326.
Supplementary movie
A supplementary movie is available at https://doi.org/10.1017/jfm.2017.875.



