INTRODUCTION
Species-level designation is commonly used to describe and characterize feeding habits of fish species (e.g. piscivore and insectivore). However, most fish species present a gradual change in their diet along ontogeny; therefore a single species can be divided into lower ecological functional units (Livingston, Reference Livingston1988, Reference Livingston2003; Vieira, Reference Vieira2006).
Ontogenetic changes in feeding habits can be related to fish movements along different environments and seasonal variations (Wheeler & Allen, Reference Wheeler and Allen2003; Scharf et al., Reference Scharf, Manderson, Fabrizio, Pessutti, Rosendale, Chant and Bejda2004; Szedlmayer & Lee, Reference Szedlmayer and Lee2004). Nevertheless, when geographical or temporal segregation is not present and several size-classes of one species share a common area and resources, selective predation along ontogeny can be an important means by which species reduce intraspecific overlap (Schoener, Reference Schoener1974; Werner & Guilliam, Reference Werner and Guilliam1984; Dopman et al., Reference Dopman, Sword and Hillis2002). Selective predation can be reflected as changes in predator–prey size relationships and changes in prey species number and richness (Buckel & McKown, Reference Buckel and McKown2002; Wheeler & Allen, Reference Wheeler and Allen2003; Rudershausen et al., Reference Rudershausen, Tuomikoski and Buckel2005).
In southern Brazilian estuaries, the most abundant sea catfish (Ariidae) is the white sea catfish (Genidens barbus Lacepède, 1803), which is second in overall abundance after the white-mouth croaker (Micropogonias furnieri (Desmarest, 1823) (Vieira et al., 1998; Ramos & Vieira, Reference Ramos and Vieira2001; Vieira, Reference Vieira2006; Mendoza-Carranza & Vieira, Reference Mendoza-Carranza and Vieira2008). Nevertheless, information about its population structure and feeding habits has been generated only for Patos Lagoon Estuary bottom fish assemblages (Vieira, Reference Vieira2006). In Patos Lagoon estuary the G. barbus population is composed of two age groups (1 and 2 years old), which can be identified clearly as a bimodal size–frequency distribution (Reis, Reference Reis1986a; Vieira, Reference Vieira2006; Velasco et al., Reference Velasco, Reis and Vieira2007). White sea catfish are generalistic benthophagous feeders, consuming fish, molluscs, polychaetes and crustaceans (Araújo, Reference Araújo1984; Reis, Reference Reis1986b). However, the literature does not give details about ontogenetic dietary changes (Araújo, Reference Araújo1984). Since prey–predator relationships are recognized as very important factors in the interactions within and among species, our first objective was to examine the predator–prey size relationship in southern Brazilian estuarine white sea catfish populations. We also tested differences between diet of the two recognized size–age groups using two niche feeding dimensions (species richness and size of prey). Finally we evaluated if this pattern is observed in all estuaries of Rio Grande do Sul, southern Brazil.
MATERIALS AND METHODS
Study area
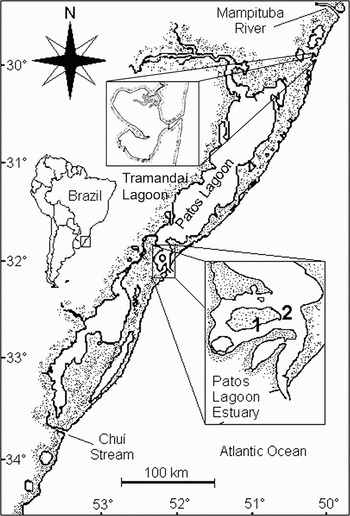
Chuí (33°44′S), Patos Lagoon (32°10′S), Tramandaí (30°02′S) and Mampituba (29°12′S) estuaries are located along the Rio Grande do Sul coastline, southern Brazil (Figure 1). Chuí Stream is located at the border between Brazil and Uruguay. It is 60 km long and is connected with the sea by a narrow channel (60 m wide); its channel depth ranges from 1.5 to 3 m. Chuí estuarine zone is relatively small (0.3 km2), reaching approximately 1 km upriver (Pereira et al., Reference Pereira, Ramos and Pontes1998). The brackish area of Patos Lagoon is restricted to the southern portion of the lagoon (~10% of total area (201,626 km2)), where it is connected with the sea by a single inlet about 4 km long and 740 m wide at the mouth (Asmus, Reference Asmus, Seeliger, Odebrecht and Castello1996). Tramandaí Lagoon is a small coastal lagoon (1800 km2) connected with the sea by a channel 1.5 km long and 0.3 km wide, with an average depth of 1.5 m in the lagoon and 5 m in its channel (Schwarzbold & Schäfer, Reference Schwarzbold and Schäfer1984). This lagoon is largely influenced by abrupt changes in wind velocity and direction; the estuarine area is extended across the entire lagoon (Seeliger, Reference Seeliger, Seeliger and Kjerfve2001). Mampituba River is located at the northern limit of Rio Grande do Sul state. This river is 8 km long and 300 m wide and average depth in its estuarine zone is 8 m. The estuarine area is estimated to be approximately 0.5 km2.
The coastline of Rio Grande do Sul state, Brazil, showing the four studied estuaries: Chuí Stream, 33°44′S 53°22′W; Patos Lagoon Estuary, 32°10′S 52°15′W (1: Porto Rei and 2: Marambia estuarine beaches); Tramandaí Lagoon, 30°05′S 50°11′W; Mampituba River, 29°12′S 49°43′W.

Sampling methods
Fish were caught using a beam trawl (4.20 m wide, 0.80 m high and with 10 mm mesh size). Each haul lasted five minutes with a velocity of approximately 3–4 km/h. The depth of trawling in all estuaries ranged from 1.5 to 2.0 m, except in Tramandaí channel (5 m) and Mampituba River (8 m).
At Chuí, six hauls were made bimonthly from January 1999 to March 2000. All hauls started at the estuary's mouth and proceeded upstream. At Patos Lagoon estuary, samples were collected in front of the Porto Rei and Marambaia estuarine beaches, where the white sea catfish is the second most abundant species following Micropogonias furnieri (Chao et al., Reference Chao, Pereira, Vieira and Yáñez-Arancibia1985; Vieira et al., Reference Vieira, Castello, Pereira, Seeliger, Odebrecht and Castello1998). Six hauls were conducted at these locations each month from January 1999 to March 2000. At Tramandaí, 32 hauls were conducted (15 in March and 17 in August of 1999). At Mampituba fish were caught during March (7 hauls) and August (10 hauls) of 1999. In both Tramandaí and Mampituba environment hauls started in the mouth of the river and finished 3 km upriver.
Fish collected in each tow were stored in separate plastic bags and fixed in 10% formaldehyde buffered with sodium borate. In the laboratory fish were identified (following Menezes & Figueiredo, Reference Menezes and Figueiredo1980; Higuichi et al., Reference Higuichi, Reis and Araújo1982), and measured (total length (TL)) to the nearest millimetre below.
Stomach content and data analysis
A total sample of 929 individuals was collected for stomach analysis (516 for Chuí Stream, 320 for Tramandaí Lagoon and 93 for Mampituba River) that contained at least one identifiable item. We were unable to collect white sea catfish at the two sample locations in Patos Lagoon estuary. This species likely migrated to upper regions of the lagoon to avoid the strong saline intrusion, which occurred in this year as a result of ‘La Niña’ conditions (Garcia et al., Reference Garcia, Vieira and Winemiller2001, Reference Garcia, Vieira and Winemiller2003).
Stomachs were extracted, by cutting out at the oesophagus and pylorus area. Prey items were identified to the lowest taxonomic level possible and counted. The volume (mm3) of entire prey was estimated using the Capitoli (Reference Capitoli1992) volumetric plates method and when prey were too big to use this method, we calculated prey volume based on its approximate geometric form. For subsequent analyses prey items were grouped into higher-level taxonomic categories.
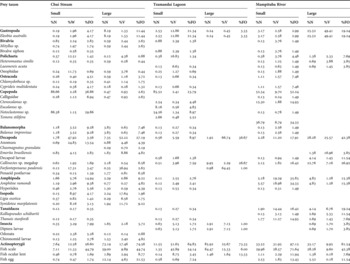
The number, volume and occurrence of the three more important taxa (copepods, fish and decapods) and the rest of preys grouped in a simple category (see Table 1) were used for analysis of ontogenetic variation in diet of white sea catfish in each sampled estuary. Stomachs were pooled by estuary and placed in 1 cm size-classes; in some cases, stomach data for some adjacent size-classes were grouped, since the number of stomachs was low (≤2 stomachs). These data were then clustered using the Ward method (minimum variance cluster) with Euclidean distances (Ludwig & Reynolds, Reference Ludwig and Reynolds1988). In all cases, data of prey were log (x+1) transformed (Mendoza-Carranza & Vieira, Reference Mendoza-Carranza and Vieira2008). We used a minimum of 40% of dissimilarity to separate the size-groups (Bock, Reference Bock2005). Significant differences within diet of the size-classes of groups determined by cluster analysis, in each estuary were tested using the G statistic based in the numbers of preys (Crow, Reference Crow, Cailliet and Simenstad1982; Zar, Reference Zar1984). General diet descriptions of groups, identified by cluster analysis, were based in the per cent number of preys (%N), per cent of volume (%V) and frequency of occurrence (%FO; Hyslop, Reference Hyslop1980). The resultant size–predator groups were then considered using posterior analyses.
Specific prey composition of white sea catfish Genidens barbus in Rio Grande do Sul, Brazil estuaries.

Diet overlap among fish size–predator groups identified by cluster analyses (small and large fish) within each estuary was determined using the simplified Morisita's overlap index (Krebs, Reference Krebs1989; Hall et al., Reference Hall, Raffaelli, Basford, Robertson and Fryer1990):

where C ik = simplified Morisita's overlap index for predators i and k; pij and pkj, proportions of predator i and k with prey j in their stomachs. Diet overlap increases as Morisita's index increases from 0 to 1. Overlap is generally considered to be biologically significant when the value exceeds 0.60 (Wallace, Reference Wallace1981; Labropoulou & Eleftheriou, Reference Labropoulou and Eleftheriou1997). Bias-corrected bootstrap 95% confidence intervals (CI) based on 200 simulations was used to estimate the reliability of this index (Hall et al., Reference Hall, Raffaelli, Basford, Robertson and Fryer1990; Labropoulou & Eleftheriou, Reference Labropoulou and Eleftheriou1997). We used a one sample t-test for bootstraps to verify if the Morisita overlap was greater than or equal to 0.60 (Efron & Tibshirani, Reference Efron and Tibshirani1993; Labropoulou & Eleftheriou, Reference Labropoulou and Eleftheriou1997). To compare white sea catfish diets among the three estuaries, we employed the simplified Morisita's similarity index (Krebs, Reference Krebs1989).
We employed the ‘bio-volume curve’ to compare the size-range of prey ingested by each fish size-class. The bio-volume curve was generated based on the volume frequency distribution of prey in each predator size-class. Prey volume was log-transformed before calculating statistics. Statistical comparison among curves was performed by ANOVA, following tests for normality (Kolmogorov–Smirnov test) and homogeneity of variances (Levine test). When these assumptions were not fulfilled we tested for differences using the Kolmogorov–Smirnov two sample test (Sokal & Rohlf, Reference Sokal and Rohlf1981; Zar, Reference Zar1984).
To examine possible seasonal effects in total diet comparisons, we perform the simplified Morisita's ovelap index and bio-volume curve comparisons among predator groups identified by cluster analyses, including only monthly data where possible.
Quantile regression analysis was applied to establish relationships among prey size (volume mm3) and white sea catfish size (total length (TL)) in each estuary (Cade & Noon, Reference Cade and Noon2003; Cade et al., Reference Cade, Noon and Flather2005) Unpublished data (Valerin-Solano & Viera) show a good relationship among total length and mouth width of white sea catfish (mouth width = 0.0878+(TL)−0.4595, R2 = 0.96, N = 165). A bootstrap resampling procedure was employed to estimate 95% confidence intervals of 95th, 90th, 85th, 80th and 50th regression quantiles (Gould, Reference Gould1992). Based on confidence intervals and F tests, which compared regression coefficients, we selected the quantile that best reflected the relationship in each estuary. We also compared the regression coefficients selected for each of the three estuaries (Scharf et al., Reference Scharf, Juanes and Sutherland1998).
RESULTS
Cluster analysis and general diet description
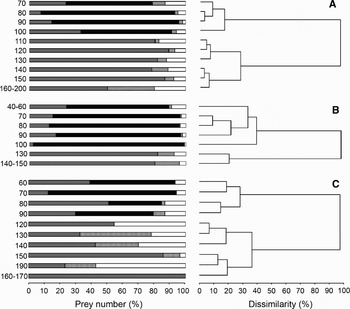
Cluster analyses identify almost two size-groups in Chuí Stream (small fish from 7 to 10 cm TL and large fish from 11 to 20 cm TL), Tramandaí Lagoon (small fish from 4 to 10 cm TL and large fish from 13 to 15 cm TL) and Mampituba River (small fish from 6 to 9 cm TL and large fish from 12 to 17 cm TL; Figure 2). In the three estuaries 1 cm size-groups of small fish were characterized by highest number of copepods, instead 1 cm size-groups of large fish were characterized by high number of fish (Figure 2). No significant differences were observed within diet of the size-classes of groups determined by cluster analysis in all cases.
Cluster analysis (right panel) and per cent number of principal preys by size-classes (left panel) in juvenile of Genidens barbus in: (A) Chuí Stream; (B) Tramandaí Lagoon; and (C) Mampituba River.

White sea catfish diet comprised 12 main taxonomic categories: Gastropoda, Bivalvia, Polychaeta, Ostracoda, Copepoda, Balanomorpha, Decapoda, Amphipoda, Isopoda, Tanaidacea, Insecta and Actinopterygii (Table 1). In the three estuaries, the most abundant prey for small white sea catfish was copepods (Chuí = 86.66%N, Tramandaí = 85.52%N and Mampituba = 52.34%N), however fish consumption had highest values of frequency of occurrence (FO) in the three estuaries (Chuí: 56.60%FO, Tramandaí: 64.85%FO and Mampituba: 97.15%FO; Table 1). For the small catfish in Chuí, per cent volume contribution was dominated by decapods (47.92%V), whereas fish comprised the highest values of biomass in Tramandaí and Mampituba (51.65 and 31.95%V respectively; Table 1).
In large white sea catfish the most abundant and frequent prey across all estuaries were fish (Chuí: 73.19%N and 74.56%FO, Tramandaí: 85.92%N and 73.33%FO; and Mampituba: 35.17%N and 61.54%FO). Decapods had the highest contribution to prey volumes in Chuí (%V = 52.52) and Tramandaí (%V = 66.74), whereas gastropods had the highest contribution to prey volume in Mampituba (49.41%; Table 1).
Diet comparisons among predator size-groups
In both Chuí Stream and Tramandaí Lagoon, Morisita's overlap index between fish size-classes was low (0.10±0.08 CI and 0.12±0.04 CI, respectively; Table 2). The highest overlap value between size-classes was observed for Mampituba (0.40±0.19 CI; Table 3), but like Chuí and Tramandaí, this overlap value was not significantly greater than or equal to 0.60 (P < 0.03 for Mampituba, P < 0.001 for Chuí and Tramandaí).
Values of Morisita's similarity (medium typeface) and overlap (bold typeface) indexes among size-classes of white sea catfish Genidens barbus in Rio Grande do Sul, Brazil estuaries.

* Overlap value significantly greater than 0.60 (P < 0.001).
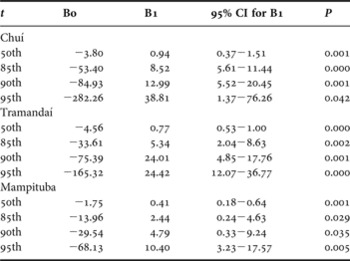
Quantile regression estimates of Bo and B1, 95% confidence intervals for B1 and P for Ho: B1 = 0 for four upper regression quantiles between white sea catfish Genidens barbus total length (cm) and prey volume (mm3) in Rio Grande do Sul, Brazil estuaries.

When comparing among estuaries all values of Morisita's similarity index for comparisons between the same size-classes were significantly greater than 0.60 (P < 0.001). The highest value was between the small size-classes of Chuí and Tramandaí (1.0±0.02), and the lowest value was observed between Tramandaí and Mampituba large size-classes (0.64±0.13). In contrast, comparisons between different size-classes among estuaries showed low similarity values (from 0.07±0.07 between Chuí small and Mampituba large size-classes, to 0.54±0.13 between Chuí large and Mampituba small size-classes; Table 2).
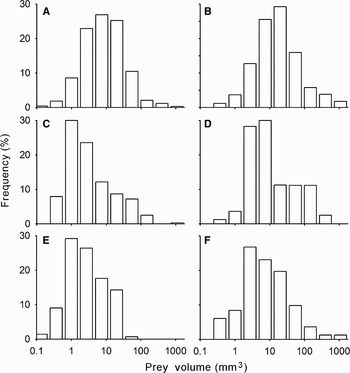
The average volume of prey of the small size-class in Chuí Stream was 13.50±53.31 SD mm3 and the larger fish had an average prey volume of 39.31±138.11 SD mm3 (Figure 3). Significant difference among curves was observed (ANOVA test, F = 105.77, P < 0.001). In Tramandaí Lagoon, average volumes of small and large size-classes were 13.31±57.70 SD and 40.64±82.95 SD mm3, respectively (Figure 3). Significant difference among bio-volume curves was observed (ANOVA test, F = 52.33, P < 0.001). In Mampituba River, average prey volumes of small and large size-classes were 5.37±7.15 SD and 36.53±129.39 SD mm3, respectively (Figure 3). Significant difference among bio-volume curves was also observed (ANOVA test, F = 31.40, P < 0.05).
Prey bio-volume curves of small and large size-classes (left and right panels respectively) of white sea catfish Genidens barbus in Chuí Stream (A, B) Tramandaí Lagoon (C, D) and Mampituba River (E, F).

No significant differences were observed among bio-volume curves of the small size-class across the three estuaries (ANOVA test, F = 0.41, P = 0.65). Likewise, no significant differences were observed among the three estuaries for the large size-class (ANOVA test, F = 2.19, P = 0.11).
Seasonal comparison
In Chuí Stream, white sea catfish were present during the austral summer months (January to April). Both small and large fish were present jointly only during March and April of 1999. The Morisita overlap index was high during March (0.83±0.09 CI). Average prey volumes for small and large size-classes were 3.54±3.78 mm3 and 11.30±5.21 mm3, respectively. Significant differences among bio-volume curves were observed (Kolmogorov–Smirnov test D = −0.31, P < 0.01). During April 1999, Morisita's overlap index was low (0.02±0.01 CI), and average prey volumes for small and large size-classes were 2.61±6.32 mm3 and 62.66±14.38 mm3, respectively. Significant differences among bio-volume curves were observed (Kolmogorov–Smirnov test D = −0.58, P < 0.01). Only individuals from the smaller size-classes were present during March 2000, and only large individuals were present during January 1999 and January 2000.
At Tramandaí Lagoon, both size-groups of white sea catfish were present together only during March 1999, in August only individuals of the small group were present. The Morisita overlap index was high (0.74±0.16 CI), and the average prey volumes for small and large size-classes were 2.00± 4.17 mm3 and 10.65±4.59 mm3, respectively. Significant differences among bio-volume curves were observed (Kolmogorov–Smirnov test D = −0.48, P < 0.01). At Mampituba River, seasonal values are the same as the total comparison because the white sea catfish was only present in March 1999.
Predator–prey size relationships
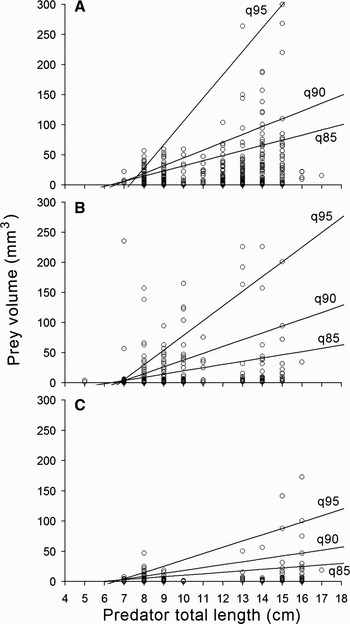
In Chuí and Tramandaí, no significant differences were observed among regression coefficients of 85th, 90th and 95th quantiles (F (2, 862) = 1.48, P > 0.2275 and F (2, 612) = 6.40, P > 0.0018 respectively). In Mampituba, significant differences were observed among the three quantile slopes at the 95% confidence interval (F (2, 316) = 3.03, P < 0.0498). Post hoc comparison showed that differences were between the 90th and 95th quantile slopes. In all cases, the 90th regression quantiles estimated the white sea catfish TL–volume prey with the greatest precision (Figure 4A–C; Table 3).
White sea catfish Genidens barbus total length versus prey volume relationship in: (A) Chuí Stream; (B) Tramandaí Lagoon; and (C) Mampituba River, illustrating estimates of upper slopes generated by the quantile regression technique.

Comparison between 90th quantiles of the three estuaries showed significant differences among quantile coefficient regression (F (2, 1790) = 20.62, P < 0.000). Nevertheless, volume of prey increased significantly with increasing predator size (TL) at highest quantiles in all three estuaries (Figure 4A–C; Table 3). The minimum prey size changed relatively little along predator sizes in the three estuaries. No significant increase was observed in all cases (quantiles: 5th, 10th and 15th).
DISCUSSION
In Patos Lagoon estuary, most juvenile fish species feed on benthic invertebrates. These species change their prey type according to the age and size of predator (Vieira et al., Reference Vieira, Castello, Pereira, Seeliger, Odebrecht and Castello1998). This observation suggests that dietary descriptions to the level of predator are not adequate to explain how species partition their alimentary resources in a common area or habitat (Livingston, Reference Livingston1988, Reference Livingston2003). Eggold & Motta (Reference Eggold and Motta1992) and Livingston (Reference Livingston2003) suggest that one species is composed of a number of trophic subunits called ‘ontogenetic trophic units’ differentiated by its change in trophic habits as it increases in age and size. These changes in feeding habits are the result of ontogenetic modifications in morphology and behaviour (Cook, Reference Cook1996; Adriaens et al., Reference Adriaens, Aerts and Verraes2001).
The annual co-occurrence of two to three size-classes of white sea catfish in estuaries of Rio Grande do Sul state, Brazil, has been suggested based on studies from the large estuarine area (201,626 km2) of Patos Lagoon (Vieira et al., Reference Vieira, Castello, Pereira, Seeliger, Odebrecht and Castello1998; Vieira, Reference Vieira2006; Velasco et al., Reference Velasco, Reis and Vieira2007). In the present study, we present evidence that juvenile populations of this species also maintain a similar pattern in other smaller estuaries of southern Brazil. We typically found two size-classes of white sea catfish in the sampled estuaries.
Cluster analysis and diet comparison between size-groups of white sea catfish revealed that intraspecific trophic partitioning occurs in two dimensions: richness and size of prey, and the same pattern is replicated across different habitats and prey availabilities in southern Brazilian estuaries (Rosa- Filho & Bemvenuti, Reference Rosa-Filho and Bemvenuti1998; Mendoza-Carranza & Vieira, Reference Mendoza-Carranza and Vieira2008). The nature of these interactions is critically important to understand species life histories, the dynamic of species interactions and the structure of the estuarine communities in which they are embedded (Werner & Guillian, 1984). In addition to size shifts, temporal segregation of those trophic units also plays an important role in reducing trophic overlap and competition in the estuaries sampled where differential use of benthic habitats play a critical role in trophic partitioning among size-classes (Stehlik & Meise, Reference Stehlik and Meise2000; Szedlmayer & Lee, Reference Szedlmayer and Lee2004).
We observed significant ontogenetic increases in prey size for the white sea catfish, with differences being more evident at maximum prey sizes. In spite of this, small preys are consumed by all sizes of white sea catfish; this trend is usual in fish where larger individuals continued to consume small prey but include large prey also (Scharf et al., Reference Scharf, Juanes and Rountree2000; Floeter & Temming, Reference Floeter and Temming2003; Rudershausen et al., Reference Rudershausen, Tuomikoski and Buckel2005).
We observed two principal tendencies in the trophic strategies of juvenile white sea catfish: the small size-class consumes mainly zooplankton (high %N and %FO) and the large size-class was characterized by high frequency of occurrence of nekton and epifauna. Changes in optimal or preferred prey size often result in changes in the taxonomic composition of the diet (Zahorcsak et al., Reference Zahorcsak, Silvano and Sazima2000), but, aside from these differences among size-groups, all size-classes, in the three estuaries, show high frequency of occurrence of fish-scales, which have not been reported for this species until now (Araújo, Reference Araújo1984). The average size of scales (8 mm) and the presence of ectoparasitic copepods (Calligidae) in stomach contents indicate that white sea catfish are lepidophagus, which has been reported for other marine catfish also (Hoese, Reference Hoese1966; Sazima & Uieda, Reference Sazima and Uieda1980; Sazima, Reference Sazima1983; Chaves & Vendel, Reference Chaves and Vendel1996).
Based on our results we can affirm that ontogenetic diet shifts are an important means to reduce intra- and interspecific competition in estuarine fish with size-structured populations such as the white sea catfish (Zahorcsak et al., Reference Zahorcsak, Silvano and Sazima2000; Denny & Schiel, Reference Denny and Schiel2001). Precise descriptions of ecological patterns are fundamental to create hypotheses about the mechanisms generating them (Petrik & Levin, Reference Petrik and Levin2000); our results show that ecological patterns based on ‘species’ category are not always appropriate as the smallest ecological entity (Polis, Reference Polis1984; Gelwick, Reference Gelwick1990; Vieira, Reference Vieira2006).
Future studies should consider the interactions of Genidens barbus with other abundant species in southern Brazilian estuaries such as whitemouth croaker (Micropogonias furnieri) and catfish (Genidens genidens (Cuvier, 1829) (Sardiña & Lopez, Reference Sardiña and Lopez2005; Mendoza-Carranza & Vieira, Reference Mendoza-Carranza and Vieira2008). Similarly, it is important to know the structure and dynamic of prey communities (Rudershausen et al., Reference Rudershausen, Tuomikoski and Buckel2005; Galarowicz et al., Reference Galarowicz, Adams and Wahl2006). Analyses of isotopic ratios (i.e. carbon, nitrogen and sulphur) and stomach contents might enhance the assessment of ontogenetic trophic shifts and overlap (Kelly, Reference Kelly2000; Araújo et al., Reference Araújo, Bolnick, Machado, Giaretta and Reis2007).
ACKNOWLEDGEMENTS
We thank Kirk Winemiller for reviewing an early draft. We thank David Hoeinghaus for revision of our English and critical revision. Thanks to Ângela Milach, Ricardo Marcelo Geraldi and Marcelo Raseira for field and laboratory assistance. The first author received a doctoral fellowship from Banco de México and Coordenadoria de Aperfeiçoamento de Pessoal de Nível Superior—CAPES (Brazil). We are also grateful to two anonymous referees who contributed valuable comments.