Introduction
The effects of migration have been studied for over 100 years, beginning with the works of Fishberg and Boas (quoted by Lasker & Mascie-Taylor, Reference Lasker, Mascie-Taylor, Mascie-Taylor and Lasker1988). Migration impacts on both recipient and donor populations and movement may be selective or random (Mascie-Taylor & Little, Reference Mascie-Taylor and Little2004). Selective migration promotes or maintains differences between groups or regions (maintains heterogeneity) whereas random migration reduces differences (promotes homogeneity). Mascie-Taylor (Reference Mascie-Taylor and Turner1985) showed that migration for IQ is selective while for ABO blood groups it appears to be random.
In general migration studies show that body height is greater in people who change their place of residence (Kobyliansky & Arensburg, Reference Kobyliansky and Arensburg1977; Kim, Reference Kim1982; Wheeler & Tan, Reference Wheeler and Tan1983; Bernis, Reference Bernis1984; Steegmann, Reference Steegmann1985; Singh & Harrison, Reference Singh and Harrison1996). However, some researchers have not found a connection between body height and migration (Lasker, Reference Lasker1954; Malina et al., Reference Malina, Buschang, Aronson and Selby1982; Zielińska, Reference Zielińska1991). Migrants have also been shown to have more advanced sexual maturation and higher body mass index (BMI) than non-migrants (Garnier et al., Reference Garnier, Simondon, Hoarau and Benefice2003; Nagel et al., Reference Nagel, Wabitsch, Galm, Berg, Brandstetter and Fritz2009).
This paper examines regional variation in anthropometric traits and the effects of intra- and inter-generational geographical migration on height, weight and BMI within Britain.
Methods
The sample comprised the fathers and sons who were members of the National Child Development Study (NCDS). The NCDS commenced in 1958 when all children born in England, Wales and Scotland in the week 3–9th March were examined. The children and their families were periodically re-studied in 1965, 1969 and 1974. Thereafter the index child was followed up into adulthood and there were re-studies at 33 and 40 years of age. This paper focuses on the 2090 father–son pairs for whom there were complete data on weight and height (see Krzyżanowska & Mascie-Taylor, Reference Krzyżanowska and Mascie-Taylor2011, for additional information). The few pairs from ethnic minorities were excluded from the analyses.
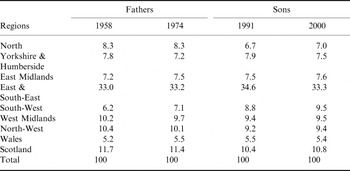
In these studies families were placed into one of the nine standard regions comprising North, Yorkshire & Humberside, East Midlands, East & South-East, South-West, West Midlands, North-West, Wales and Scotland (see Fig. 7A). Thirty-three per cent of the fathers came from the East & South-East region and only 5.2% (in 1958) and 5.5% (in 1974) came from Wales. Most of the sons came from the East and South-East (34.5% in 1991) and, similarly to fathers, only 5.5% (in 1991) and 5.4% (in 2000) came from Wales (Table 1).
Percentages of inhabitants in the nine regions

The extent of geographical mobility was determined intra-generationally for the fathers (between 1958 and 1974) and for the sons (between 1991 and 2000), as well as inter-generationally between fathers and sons (between 1958 and 2000). Geographical mobility was categorized as none (no change in place of residence), in-migrants (in-migration into another region) and out-migrants (emigration from one region to another). Univariate analysis of variance was the main statistical tool used with Hochberg's or Games-Howell's post-hoc tests.
Results
Mean anthropometric traits by regions
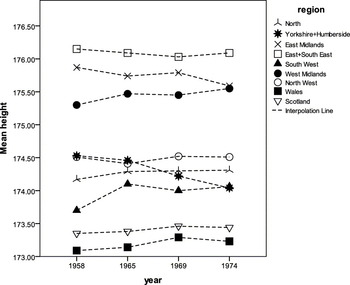
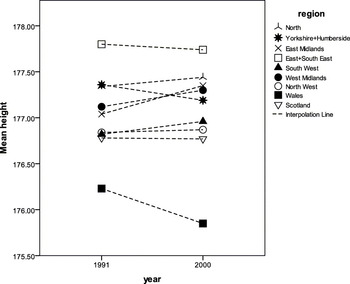
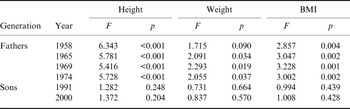
Figures 1 and 2 present the mean height of fathers by region on four occasions and that of sons by region on two occasions. Highly significant differences in regional mean heights were found only in fathers (Table 2). The greatest mean height was in the East & South-East region, while the lowest mean was in Wales. The overall mean height difference between regions ranged from about 2.7 cm to 3.1 cm in fathers.
Fathers' height variation by region.

Sons' height variation by region.

ANOVA for regional variation of height, weight and BMI
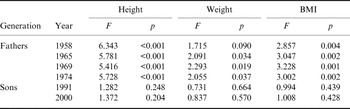
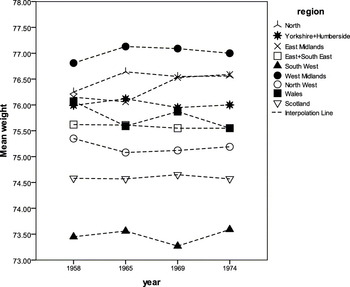
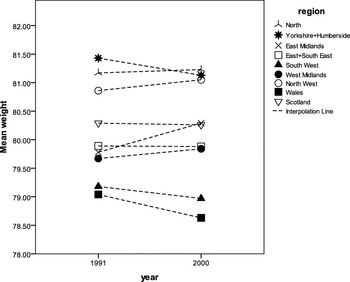
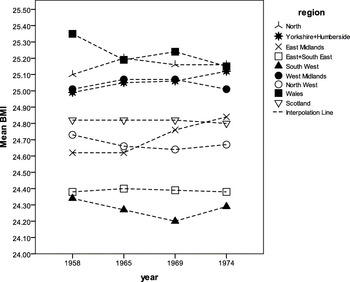
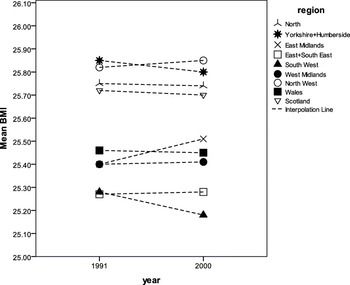
There was much less difference in mean weight between regions (Figs 3 and 4) but much more in BMI (Figs 5 and 6). In fathers the greatest mean weight was generally in the West Midlands, while the lowest was in the South-West (maximum difference about 3.5 kg). For BMI the greatest mean value was in Wales and the North, and the lowest in the South-West (maximum difference about 1 kg m−2). There was no significant regional variation in weight or BMI in the sons' generation (Table 2).
Fathers' weight variation by region.

Sons' weight variation by region.

Fathers' BMI variation by region.

Sons' BMI variation by region.

Intra- and inter-generational migration
Fathers were classified as non-migrants if they remained in the same region between 1958 and 1974, and migrants if they moved to another region over this time period. The same classification was used for sons between 1991 and 2000 and also for father–son migration between 1958 and 2000.
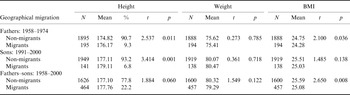
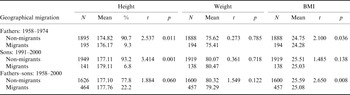
Table 3 presents the results of the analyses for height, weight and BMI between geographically mobile and non-migrant groups. Intra-generational regional migration was 9.3% for fathers and 6.7% for sons, while inter-generational regional migration was 22.2%. There was a general trend for intra-generational migrants to be taller than non-migrants, by on average from 1.4 cm in fathers to 2 cm in sons. The inter-generational difference was 0.66 cm and was borderline significant. There were no significant differences in mean weights between migrants and non-migrants in either geographically mobile groups either intra- and inter-generationally. For BMI migrating fathers had, on average, a lower BMI than sedentes, but there was no significant intra-generational difference for sons although the directionality was maintained. Analysis of the inter-generational migration revealed that migrants had, on average, a lower BMI (Table 3).
Mean height, weight and BMI for non-migrants and migrants: Student's t-test results
Intra- and inter-generational migration in respect of in- and out-migrants
The pattern of migration was examined further by distinguishing between in- and out-migrants. The mean differences in height, weight and BMI between in-migrants and non-migrants and out-migrants and non-migrants in height, weight and BMI were analysed and the net effect of migration (the difference between in- and out-migrants) was also calculated.
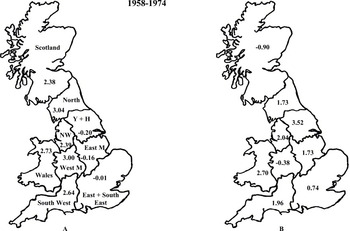
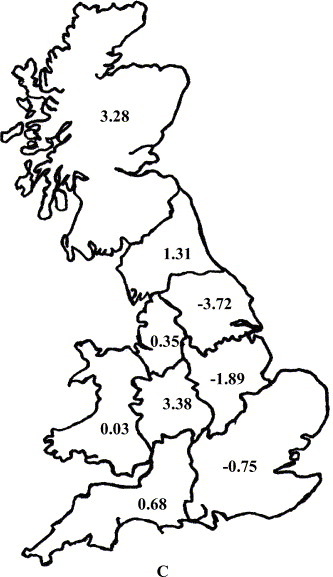
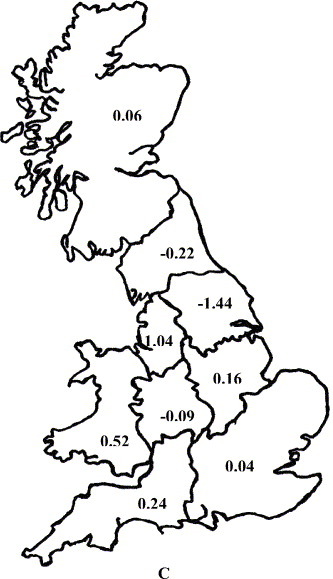
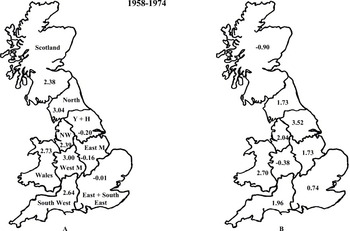
Figures 7–10 summarize these analyses for height and BMI (as there were no significant differences for weight, no figures are shown). A positive sign indicates that migrants were taller or had a higher BMI, on average, than non-migrants or that the net effect of in- and out-migration was positive. For fathers, in-migrants for height were taller, on average, in six of the nine regions, with the greatest difference being in the North and West Midlands regions. The tallest in-migrants among fathers came into the North region (3.0 cm above non-migrants, Fig. 7A); the tallest out-migrants among fathers came from Yorkshire & Humberside (3.5 cm taller, on average, than non-migrants) and the shortest came from Scotland (0.9 cm below non-migrants) (Fig. 7B). The net effect of migration (Fig. 7C) revealed that the largest positive gain on fathers' height was in the West Midlands region and Scotland (3.38 cm and 3.28 cm, respectively), while negative effects were found in the Yorkshire & Humberside, East Midlands and East & South-East regions by between 0.75 cm and 3.72 cm.
Mean difference in fathers' height among in- (A) and out-migrants (B) and the net effect (C). (Y+H=Yorkshire & Humberside; East M=East Midlands; West M=West Midlands; NW=North-West).

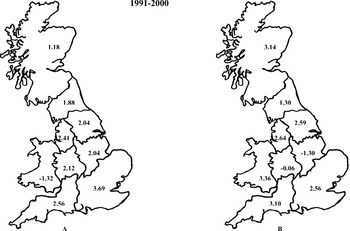
Mean difference in sons' height among in- (A) and out-migrants (B) and the net effect (C).


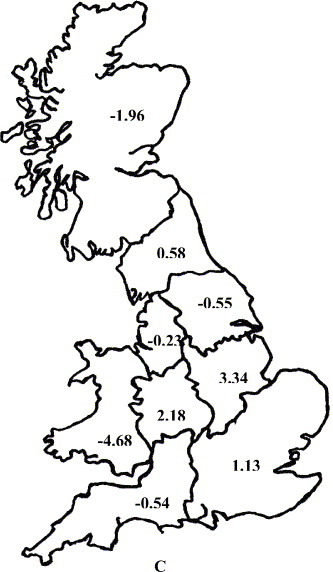
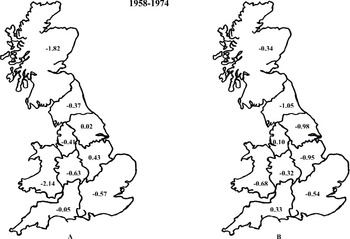
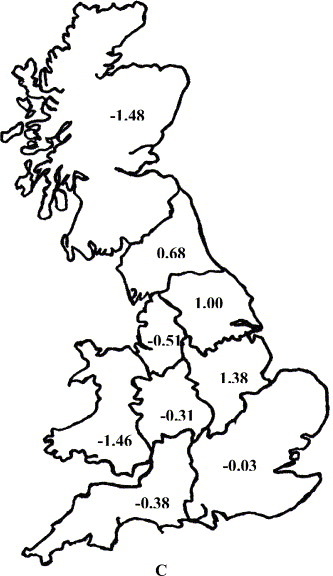
Mean difference in fathers' BMI among in- (A) and out-migrants (B) and the net effect (C).


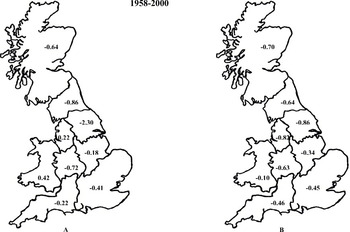
Mean difference in sons' BMI among in- (A) and out-migrants (B) and the net effect (C).


For sons (Fig. 8A) in-migrants were, on average, taller in all regions except Wales, with the largest differences between in-migrants and non-migrants being in London and the South-East (+3.69 cm) and South-West (+2.56). For out-migrants (Fig. 8B), the tallest (3.36 cm above sedentes) sons came from Wales, while the shortest (1.3 cm below non-migrants) came from the East Midlands region. The net effect of migration showed that the North, East Midlands, East & South-East and West Midlands regions were net gainers (Fig. 8C) while Wales and Scotland, in particular, were net losers.
For BMI among fathers, in-migrants (Fig. 9A) in seven of the nine regions were, on average, of lower BMI than non-migrants, particularly in Wales and Scotland (−2.14 and −1.82 kg m−2, respectively). For out-migrant fathers (Fig. 9B), the North-West (+0.10 above the mean for sedentes) and South-West regions (+0.33 above) were the only two regions showing positive values, with the largest negative values being found in the East Midlands and Yorkshire & Humberside regions (−0.95 and −0.98, respectively). The net effect of migration (Fig. 9C) indicated that in four regions there was a positive effect, the largest gains being in the East Midlands and Yorkshire & Humberside regions (+1.38 and 1.00, respectively) and largest losses in Scotland (−1.48) and Wales (−1.46).
For sons the results of inter-generational migration for BMI are shown in Fig. 10. In-migrating sons into the North-West (0.22 greater) and Wales (0.42 greater) had higher BMI, on average, than sedentes, while in-migrants into Yorkshire & Humberside were, on average, 2.30 lower in BMI (Fig. 10A). In all regions out-migrants had lower BMI than non-migrants, from −0.10 in Wales to −0.86 in Yorkshire & Humberside (Fig. 10B). The net effect of migration revealed that six of the nine regions were net gainers, particularly the North-West (+1.04), while Yorkshire & Humberside was a net loser (−1.44, Fig. 10C).
Discussion
Geographical variation in anthropometric traits has been described in many countries: Canada (Reeder et al., Reference Reeder, Chen, MacDonald, Angel and Sweet1997; Shields & Tjepkema, Reference Shields and Tjepkema2006), Finland (Jokela et al., Reference Jokela, Kivimäki, Elovainio, Viikari, Raitakari and Keltikangas-Järvinen2009), India (Dey & Debray, Reference Dey and Debray2003), Peru (Shin, Reference Shin2007), Poland (Hulanicka et al., Reference Hulanicka, Gronkiewicz and Ziętkiewicz1999), Sweden (Rasmussen et al., Reference Rasmussen, Johansson and Hansen1999), Turkey (Iseri & Arslan, Reference Iseri and Arslan2009), United States (Jackson et al., Reference Jackson, Doescher, Jerant and Hart2005) as well as Great Britain (Rona & Altman, Reference Rona and Altman1977; Rosenbaum et al., Reference Rosenbaum, Skinner, Knight and Garrow1985; Scarborough & Allender, Reference Scarborough and Allender2008).
This study's findings showed highly significant regional variation in height in the fathers' generation. Men from the East & South-East region were the tallest, while the shortest came from Wales. The overall mean height difference between regions ranged from about 2.7 cm to 3.1 cm (Fig. 1). The geographic variation in height found in this study is consistent with earlier research (Mascie-Taylor, Reference Mascie-Taylor and Boyce1984; Mascie-Taylor & Boldsen, Reference Mascie-Taylor and Turner1985), which showed that the shortest males were in Wales and Scotland and the tallest in the South-East together with the Southern and Eastern regions. Geographical variation in height has also been reported in the British National Cohort (NCDS) by Strachan et al. (Reference Strachan, Rudnicka, Power, Shepherd, Fuller and Davis2007), as well as in other British data (Knight & Eldridge, Reference Knight and Eldridge1984; Elford et al., Reference Elford, Phillips, Thomson and Shaper1990). In these surveys men examined in the South were taller on average than those from Scotland. Men from the North, Midlands and Wales were of intermediate height. The present study's findings are also in agreement with the Rosenbaum et al. (Reference Rosenbaum, Skinner, Knight and Garrow1985) study. People living in Wales were shorter than others; those living in Scotland were the second shortest group, but those living in the East of England and South-East were around 1 cm taller than those living in the North.
Regional differences in BMI have been investigated by Waldhör et al. (Reference Waldhör, Schober and Rami2003), Ekblom et al. (Reference Ekblom, Oddsson and Ekblom2004), Schober et al. (Reference Schober, Rami, Kirchengast, Waldhör and Sefranek2007) and Strachan et al. (Reference Strachan, Rudnicka, Power, Shepherd, Fuller and Davis2007). Higher mean BMI was reported in small towns or the countryside in Sweden (Ekblom et al., Reference Ekblom, Oddsson and Ekblom2004). A clear east–west gradient in BMI was observed in Austria (Waldhör et al., Reference Waldhör, Schober and Rami2003; Schober et al., Reference Schober, Rami, Kirchengast, Waldhör and Sefranek2007). There were some areas in the south and north-west of Spain with a higher BMI than the rest of the country (Gutiérrez-Fisac et al., Reference Gutiérrez-Fisac, Rodríguez Artalejo, Guallar-Castillon, Banegas and del Rey Calero1999). However, there are some examples where an ‘obesogenic environment’ seems to be similar across different degrees of urbanization (Gast et al., Reference Gast, Frenken, van Leest, Wendel-Vos and Bemelmans2007; Peytremann-Bridevaux & Santos-Egglma, Reference Peytremann-Bridevaux and Santos-Egglma2007) or across geographical areas (Lahti-Koski et al., Reference Lahti-Koski, Taskinen, Similä, Männistö, Laatikainen, Knekt and Valsta2008). In the present study there were much greater differences in mean BMI between regions (Figs 5 and 6) and less in weight (Figs 3 and 4). The highest mean weight was generally in the West Midlands, while the lowest was in the South-West region. For BMI the highest mean value was in Wales and the North, and the lowest, similar to weight, in the South-West region. Strachan et al. (Reference Strachan, Rudnicka, Power, Shepherd, Fuller and Davis2007) found the greatest BMI in Wales and Scotland. Similar results, especially for BMI, were reported by Rosenbaum et al. (Reference Rosenbaum, Skinner, Knight and Garrow1985). Rennie & Jebb (Reference Rennie and Jebb2005) observed small regional differences in overweight and obesity within England. They noticed that the prevalence of obesity in Scotland and Wales was greater than in England.
Studies on the relationship between geographical migration and body height are well known (Kobyliansky & Arensburg, Reference Kobyliansky and Arensburg1977; Kim, Reference Kim1982; Wheeler & Tan, Reference Wheeler and Tan1983; Bernis, Reference Bernis1984; Steegmann, Reference Steegmann1985; Singh & Harrison, Reference Singh and Harrison1996) and many researchers have found that both internal and international migrants are taller than non-migrants (Bernis, Reference Bernis1984; Mascie-Taylor, Reference Mascie-Taylor and Boyce1984; Danubio et al., Reference Danubio, Amicone and Vargiu2005; Szklarska et al., Reference Szklarska, Lipowicz, Łopuszańska, Bielicki and Kozieł2008), which was clearly confirmed in the present study. Migrants were taller, on average, than non-migrants by 1.4 cm in fathers and 2 cm in sons (Table 3). Similar results on NCDS data were reported by Mascie-Taylor (Reference Mascie-Taylor and Boyce1984) and Strachan et al. (Reference Strachan, Rudnicka, Power, Shepherd, Fuller and Davis2007).
The relation between geographical migration and BMI has also been studied but the results are not consistent between studies. For example, Danubio et al. (Reference Danubio, Amicone and Vargiu2005) pointed out that Italian immigrants to the USA had a higher prevalence of obesity than the contemporary US sample, while Park et al. (Reference Park, Myers, Kao and Min2009) found a lower chance of obesity among all immigrants. Tunisian migrants into France were found to be less overweight than the French (Méjean et al., Reference Méjean, Traissac, Eymard-Duvernay, El Ati, Delpeuch and Maire2007), while migrant children of Turkish, Russian and Polish origin had a higher prevalence of overweight and obesity than those native-born in Germany (Will et al., Reference Will, Zeeb and Baune2005). Similarly, internal Senegalese migrants had a higher BMI than non-migrants (Garnier et al., Reference Garnier, Simondon, Hoarau and Benefice2003). The present study did not show any differences in weight between geographically mobile groups in either fathers and sons, but migrating fathers had a lower BMI than sedentes. The results among fathers are consistent with a previous study on the NCDS (Strachan et al., Reference Strachan, Rudnicka, Power, Shepherd, Fuller and Davis2007).
The results on father–son pairs confirm that there is selective migration in relation to height and BMI. It appears that people who were geographically mobile within Britain in the second half of the twentieth century tended to be taller and have lower BMI than non-migrants.