Liberal democracy derives a large part of its appeal from the promise that citizen preferences determine the content and direction of policy making.Footnote 1 In other regimes the political elite might also adopt policies that are consistent with majority opinion, but democratic government guarantees policy responsiveness to public preferences through the use of competitive elections. Either politicians anticipate defeat and move towards the median or mean voter – i.e., ‘rational anticipation’ – or, if they do not, lose their jobs to those who did – i.e., ‘electoral turnover’.Footnote 2 Thus, John May defines democracy as the ‘necessary correspondence between acts of governance and the wishes with respect to those acts of the persons who are affected’.Footnote 3 This article takes that definition as the point of departure to analyse political representation in the United Kingdom. Does British government policy follow public preferences and, if so, through which mechanism (rational anticipation, electoral turnover, or perhaps both)? And if elections really do force politicians to pay closer attention to the public’s demands, then what is the effect of electoral pressure on the opinion–policy link? In other words, is the degree of policy responsiveness conditional on the electoral vulnerability of the incumbent government?
A vast literature demonstrates the existence of policy responsiveness across different countries and policy domains.Footnote 4 Most studies of political representation, however, relate public preference variables to some indicator of elite behaviour at the same point in time.Footnote 5 But does policy then follow opinion, or the other way around? Causal statements are more convincing if they are backed by models that incorporate the temporal priority of the main variables. The reciprocal, or ‘thermostatic’, nature of the opinion–policy link makes this issue all the more pressing.Footnote 6
An alternative approach, known as ‘dynamic representation’, is advanced by James Stimson, Michael Mackuen and Robert Erikson: ‘We may say that if, by knowing about earlier changes in public sentiment, we can improve the prediction of public policy over what we could have done from knowing only the history of public policy itself, then opinion causes policy, and this is dynamic representation’.Footnote 7 The strength of this statement lies in its sequential treatment of the key variables. Hence, dynamic representation requires public preferences at time t−1 to have an impact on policy at time t, while controlling for lagged values of policy. Unfortunately, these types of models require longer time-series measures of policy and opinion to pursue regression methods comfortably. Due to the sparseness of suitable longitudinal variables, scholars have only very recently begun to apply this otherwise powerful paradigm to the British case. Stuart Soroka and Christopher Wlezien have examined to what extent British government spending is sensitive to changing public preferences in various issue domains.Footnote 8 Sara Hobolt and Robert Klemmensen and Will Jennings and Peter John analyse the influence of public opinion on government issue priorities.Footnote 9
This shift of focus to Britain was long overdue. While Stimson and his colleagues chose to test the theory of dynamic representation in the United States, the Westminster model in fact should be considered its paradigmatic case. Horizontal separation of powers, as outlined in the American Constitution, enables divided government, which in turn obscures lines of responsibility, and, in doing so, jeopardizes mandate politics. Stimson, MacKuen and Erikson test their theory separately for the Presidency, the Senate, the House of Representatives and the Supreme Court, since each of these institutions plays a different role in shaping policy outputs.Footnote 10 In contrast, in the United Kingdom, the governing party ‘wields vast amounts of political power to rule as the representative of and in the interest of a majority’.Footnote 11 The Westminster system, therefore, provides a much clearer and more parsimonious example of the dynamic representation framework, since one institution, namely the cabinet, ultimately determines the direction of public policy.
This article provides a comprehensive test of the dynamic representation framework in the United Kingdom. It seeks to establish to what extent and through what mechanisms public preferences are translated into government policy. Previous research, both in the United Kingdom and elsewhere, has often focused on one or two of the pathways of representation. In this article, all links will be systematically examined. It is generally accepted that political competition in Britain occurs along a one-dimensional left–right axis, where the substantive meaning of the political left and right is linked to ‘whether one supports or opposes social change in an egalitarian direction’,Footnote 12 but existing studies have failed to measure policy and public preferences on this metric with enough time points to model their relationship in a truly dynamic fashion. The policy data used below are particularly unique – prior to this study, long time series of the policy content of government policy have simply not been available for regression purposes.
The article begins with an outline of the dynamic representation model and four concomitant hypotheses. Then, the key variables – government policy and public preferences – are described. For the former, a government policy variable is used that was constructed through the content analysis of government speeches.Footnote 13 For the latter, the left–right self-placement item from the Eurobarometer Surveys features as a proxy for voter ideology. Finally, dynamic regression methods are employed to test whether government policy moves as a consequence of public preferences; whether representation occurs through electoral turnover, rational anticipation or both; and whether the degree of government responsiveness is conditional on electoral pressures. Anticipating the main conclusion, it is revealed that, despite its undoubted deficiencies, the Westminster system fulfils the requirements of dynamic representation rather well.
Pathways of Representation
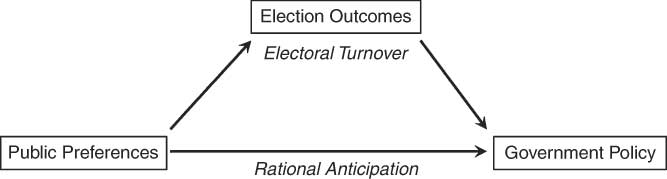
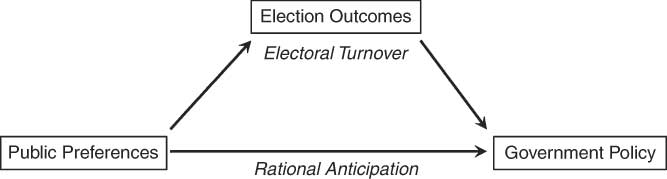
Public preferences are at the heart of democratic governance. But these preferences are by no means static. Rather, the public shifts to the left or right, depending on its environment. Changing public preferences are then expected to result in policy change in the same direction. This section describes how policy change is related to public preferences, both directly and indirectly. It is theorized that parties compete in elections by offering different policy packages to the electorate. A right-wing party will emerge victorious during right-wing public moods, after which it implements its right-wing election pledges. However, anticipating defeat, the government may also directly adjust its policy position to that of the electorate. The basic dynamic representation framework is outlined in Figure 1.
The dynamic representation framework
Electoral Turnover
As Figure 1 shows, the mechanism of electoral turnover is a two-stage process that bears close resemblance to what Bingham Powell calls the ‘chain of responsiveness’.Footnote 14 If either one of the arrows is broken, representation will suffer. The first stage involves the correspondence between public preferences and election outcomes. Put simply, a right-wing electorate is expected to elect a right-wing party, which, in the British context, means that a rightward shift in preferences will generally result in the replacement of a Labour government by a Conservative government. Micro-level research has consistently found that, controlling for a host of other factors, ideological proximity to a party increases the likelihood of voting for that party.Footnote 15 On the macro-level, John Bartle examines the relationship between voter ideology and election outcomes and finds that Labour’s vote share increases as public attitudes become left-wing.Footnote 16
The second stage requires that parties, once in power, fulfil the pledges on the basis of which they were elected. If a left-wing public mood results in the election of a left-wing party, but that party pursues right-wing policies while in office, the chain of responsiveness is broken. Richard Rose writes that ‘most of the things that parties say ought to be done are “do-able”, and both Conservative and Labour governments carry out most of their pledges’.Footnote 17 According to Richard Hofferbert and Ian Budge, ‘British parties can be assumed to carry through most of their election priorities into government and to impose them, at least in a broad sense, upon the state apparatus’.Footnote 18 Terry Royed, too, finds that the Conservative party fulfilled most of its 1979 and 1983 election pledges in subsequent years.Footnote 19
Moreover, since spatial models base vote choice on party differentials, a meaningful offer has to be put forth for the electorate to decide upon. Stefano Bartolini calls this the ‘decidability of the political offer’.Footnote 20 Indeed, expert surveys and the Comparative Manifesto Project confirm that British parties have always occupied divergent positions on the left–right scale, also seen in their election pledges.Footnote 21 Combined with the fact that promises are usually fulfilled, parties in government can, therefore, be expected to make a difference with respect to actual policy outcomes. The partisan influence on policy in majoritarian governments such as Britain is well documented.Footnote 22 Conservative governments, for example, spend considerably less in domestic policy domains than Labour governments.Footnote 23 Thus, extant research on both stages of the ‘electoral turnover’ mechanism leads to the following two hypotheses:
HYPOTHESIS 1. A right-wing public mood results in Conservative party election victories.
HYPOTHESIS 2. A replacement of the Labour party by the Conservatives at time t−1 causes a rightward shift in government policy at time t.
Rational Anticipation
Electoral turnover is the conventional pathway to political representation. Still, Figure 1 shows that a direct connection from public preferences to policy is available as well. As Stimson and his associates write, ‘in a world of savvy politicians, rational anticipation produces dynamic representation without the need for actual electoral defeats’.Footnote 24 Losing elections is never particularly appealing, but in some institutional contexts its effects are more dramatic than others. The winner-takes-all nature of the electoral system provides British parties with an additional incentive to closely monitor public opinion and adjust to it where possible, since small shifts in public preferences are likely to be magnified in terms of parliamentary seats.
The concept of rational anticipation has a long pedigree in political science. Anthony Downs, for example, argues that parties adapt to the median voter to ensure (re)election: ‘parties formulate policies in order to win elections rather than win elections in order to formulate policies’.Footnote 25 And, to Carl Friedrich, ‘the influence of public opinion … upon the conduct of government affairs is devoid of ascertainable manifestations … because the person or group which is being influenced anticipates the reactions of him or those who exercise the influence’.Footnote 26 Of course, politicians sometimes interpret public mood swings incorrectly, or are genuinely surprised by its magnitude, in which case public influence certainly does have ‘ascertainable manifestations’, namely the proper replacement of officeholders after elections.
A prime example of rational anticipation in real life was New Labour’s belief that ‘parties must adapt to the voters, rather than persuading voters to adapt to the party’.Footnote 27 Thus, after suffering four straight election defeats from 1979 to 1992, the Labour party carried out a radical overhaul of its ideological profile. According to British election lore, Blair declared his goal of recapturing middle Britain when he spotted a man polishing his Ford and decided that this was the kind of young middle-income homeowner whom Labour needed to win over from the Conservatives. The biggest step, at least symbolically, towards recapturing ‘Mondeo Man’ was the Labour party’s decision to strike Clause IV from its statutes and, with that gesture, end its commitment embodied in that clause to the wholesale nationalization of industry.
For rational anticipation to work, politicians require reasonably valid and reliable estimates of the nature of public mood. Increasingly, party elites and campaign strategists possess high-quality data on public opinion, both quantitative and qualitative, thereby facilitating rational anticipation.Footnote 28 The Labour party, for example, has had long-standing ties with Market and Opinion Research International (MORI) and has repeatedly made use of its services to gauge public attitudes. For parties in government, the possibility of anticipated reactions is even greater. In a comparison of the United States and Britain, Lawrence Jacobs outlines the existence of a large government infrastructure tracking public opinion in both countries.Footnote 29 He writes: ‘Although the apparatus was initially created to outwardly manipulate the public, its development by the postwar period had an inward recoil effect: government officials became more sensitive to what the public thought’, and, as a result, ‘have placed greater importance on anticipating the public’s reaction to policy alternatives’.Footnote 30
The incentive effect of elections constitutes the driving force behind rational anticipation.Footnote 31 Stimson, Mackuen and Erikson state: ‘Politicians create an appropriate margin of safety: those who highly value policy formulation or who feel safe at home choose policy over security; those who face competitive challenge in the next election lean towards “expediency” and security’.Footnote 32 Incumbents are thus expected to modify their policy behaviour at the margins more than they would in its absence.
Scholarship on the conditional effects of competition on political representation is largely built around the so-called ‘marginality hypothesis’, which declares that politicians elected by narrow margins are expected to follow constituency preferences more closely than those elected by larger margins. John Griffin provides a concise overview of this exclusively American literature and concludes that ‘across and within districts, the link between district liberalism and Representative roll-call liberalism is stronger among more competitive districts’.Footnote 33 In Britain, some have tested whether political competition affects policy at the local level and found no evidence for that claim.Footnote 34 However, George Boyne himself provides a convincing argument why the local political scene is unsuitable for testing Downsian hypotheses. In short, ‘local political leaders lack both the opportunity and the incentive to compete effectively’.Footnote 35
While the effect of competition on responsiveness is a mainstay of the dynamic representation approach, implicit tests are virtually absent. As a result, this assumption continues to be just that – an assumption. In addressing this matter, Hobolt and Klemmensen find ‘some indication that electoral uncertainty increases responsiveness but not across all policy areas’.Footnote 36 This article tests a similar hypothesis, albeit with the crucial difference that policy is operationalized in left–right terms rather than emphasis (see below). The two hypotheses related to rational anticipation can be formulated as follows:
HYPOTHESIS 3. Controlling for electoral turnover effects, a shift in public preferences at time t−1 causes government policy to shift in the same direction at time t.
HYPOTHESIS 4. Vulnerable incumbents are more directly responsive to public preferences than safe incumbents.
Policy-opinion on the left–right scale
Government responsiveness can be analysed across separate policy domains, such as defence, health care, immigration and so on, or, alternatively, on a higher level of aggregation by lumping policy dimensions together. Others have consistently shown that the British policy space can be represented by the left–right dimension, which has ‘dominated party confrontation throughout the postwar – and even prewar – period’.Footnote 37 Paul Webb writes that ‘there are good grounds for regarding the simple Downsian conception of a single dimension of ideological competition as appropriate in the case of modern Britain’.Footnote 38 Using data from the Comparative Manifesto Project, he shows that the socialism–capitalism dimension is ‘overwhelmingly prominent’ when compared to the libertarianism–authoritarianism dimension.Footnote 39 Factor analysis of expert surveys can also determine multi-dimensionality of the policy space. Analysing responses from fifty-seven British experts, previous writers have found that the one-factor solution explains more than 65 per cent of the variance in British party positions on a number of pre-determined dimensions.Footnote 40 In fact, of the forty-seven party systems in that particular survey, the one-factor solution only works well in Switzerland and Britain. General considerations also underlie the British public’s reaction to survey responses.Footnote 41 Respondents do not think of separate issue domains when participating in a survey, but rather of more or less government, broadly defined. Finally, there is recent cross-national evidence on welfare state outputs and public opinion which shows that representation does not occur in specific policy domains, but rather on a higher level of aggregation.Footnote 42
Britain thus seems ideally suited for testing macro-political models relating policy to the populace on a one-dimensional left–right scale. Substantively, the left advocates change in the direction of greater equality, while the right seeks to preserve a more traditional socio-economic hierarchy. This section explains how policy and the public can both be captured on the left–right scale in a longitudinal setting. The policy data which constitute the dependent variable are especially unique and warrant detailed attention. Then, a macro-model of political representation in Britain is outlined together with some econometric issues presented by the data.
The Dependent Variable: Government Policy
The measurement of the policy positions of actors has always ranked high on the political research agenda. Valid and reliable policy estimates of parties, governments and voters are indispensable for testing theories of political competition, coalition formation, policy responsiveness and cleavage politics, to name but a few. Still, it is rare to find measures that provide sufficient time points for inclusion in dynamic models. When it comes to longitudinal analysis of left–right positions of governments, the Comparative Manifesto Project (CMP) was long seen as the only game in town.Footnote 43 Still, since the CMP coding scheme is based on party election manifestos, the post-war period only provides a maximum of fifteen time points for Britain. Also, the CMP data are not annual in nature, simply because national elections tend to be held every four years or so.
As a result, more and more scholars have shifted their attention from election programmes to legislative speeches. In the British case, some have analysed the annual ‘Speech from the Throne’, which contains the government’s policy intentions for the coming year.Footnote 44 The time-series variables employed there represent the relative importance of separate policy domains, such as social services, health care, defence and so on. These studies contain annual observations for a period of at least thirty years, and therefore more sophisticated statistical tools become available to relate policy to public opinion. Still, unlike the CMP data, these approaches cannot be transformed into left–right position scores, because their coding schemes are not designed with positional purposes in mind.
The challenge, then, is to construct a long time series of the left–right policy position of government speeches with enough degrees of freedom to comfortably pursue regression techniques. The focus will be on the Budget speech, which is annually delivered by the chancellor of the exchequer to the House of Commons to outline policy in terms of spending and revenues, as well as monetary and fiscal matters. While election manifestos constitute promises that a party makes vis-à-vis the electorate, the Budget speech is more concerned with actual policy commitment for the upcoming year. It contains information on the government’s general role in shaping economic policy, and this offers potential to distinguish between speeches in terms of their left–right content.Footnote 45 One has to leave the possibility open that a discrepancy might exist between the content of these statements and actual policy outputs, but unfortunately this is near impossible to test. Suffice it to say that the Budget speech is likely to be less symbolic and more proximate to actual policy than other possible candidates such as the Queen’s Speech or party leader addresses at annual conferences. It will hopefully become clear below that the advantages of using Budget speeches greatly outweigh the disadvantages.
The objection may be raised that Budget speeches only encompass economic policies, while the left–right axis is much more general than that. This is certainly true, but the economy has been the dominant issue domain for the bulk of the post-war period in Britain.Footnote 46 As André Blais and his associates write: ‘the basic criterion distinguishing the Left from the Right concerns the role of government versus that of the market’.Footnote 47 This is the dichotomy that continuously comes to the fore in Budget speeches. Finally, in one-dimensional settings, policy positions on one issue are strongly correlated to positions on another issue.Footnote 48
Instead of using pre-existing coding schemes that had been specifically designed for party manifestos to code speeches, the dependent variable is constructed using an innovative content analysis technique known as Wordscores. According to its founders, the technique ‘breaks radically from “traditional” techniques of textual content analysis by treating texts not as discourses to be read, understood, and interpreted for meaning … but as collections of word data containing information about the position of the texts’ authors on predefined policy dimensions’.Footnote 49 At its core, Wordscores is based on simple word frequencies and has been used to analyse coalition formation in Germany, competition between presidential candidates in France, senators’ motivations in President Clinton’s impeachment trial, and longitudinal movements of parties and governments in Denmark.Footnote 50 As can be seen from the wide variety of languages, texts and topics listed above, this approach ‘offers the potential to crunch huge volumes of virgin text very rapidly indeed, with an enormous range of intriguing political science applications’.Footnote 51
The Wordscores procedure uses so-called ‘reference texts’ of which the score on a given dimension is known or can be confidently assumed to estimate the position of ‘virgin texts’ on that same dimension.Footnote 52 Virgin texts are texts of which the position estimates have yet to be calculated. As a matter of illustration, consider two speeches of equal length, one from a right-wing source such as the Conservative party, the other from a left-wing source such as Labour. Someone who reads these texts might find that certain words such as ‘business’ or ‘enterprise’ appear more frequently in the right-wing texts, while ‘equality’ or ‘social’ seem to resurface in left-wing texts. The texts make use of systematically different language. If the word ‘business’ features twenty times in the Tory (Conservative) speech, but only four times in the Labour speech, one can say that when encountering the word ‘business’ in either text, the likelihood is 0.83 that one is reading the Tory text. Suppose that – through independent sources such as expert surveys, opinion polls, the CMP, historical sources, or in the researcher’s own judgement – the Labour text receives a score of 2 and the Tory text a score of 7 on a 10-point left–right scale. Words in the reference texts can then be scored on a left–right metric, depending on the relative frequency of the word in proportion to the total number of words and the assigned left–right score of the reference texts.Footnote 53
Wordscores thus creates a dictionary file, which can be used to score texts whose position has not been estimated as yet. If these so-called ‘virgin texts’ make heavy use of left-wing words, it would probably be safe to assume that the text has left-wing content. The score of any virgin text is the mean score of all scored words on the dimension of interest, weighted by the frequency of scored words. Since commonly overlapping words in the reference texts – i.e. ‘for’, ‘and’, ‘it’, and so on – tend to pull the raw scores towards the centre of the defined interval, Laver, Benoit and Garry propose a final transformation of these raw ‘virgin’ scores to ensure that they have the same dispersion metric as the reference texts.Footnote 54 So if one decides to use CMP scores as references, the transformation of raw scores will ensure that virgin texts can be interpreted along the same CMP scale.
The Wordscores procedure is entirely automatic once the researcher has made two key decisions.Footnote 55 The first task is to identify the dimension of interest on which to score the reference texts in order to obtain virgin text scores. For the purposes of this article, this is the general left–right axis of competition. The second task is to choose a particular set of reference texts for which the position estimates are known. Laver, Benoit and Garry continuously stress the importance of the choice of reference texts to the success of Wordscores, warning that ‘garbage in’ will probably result in ‘garbage out’.
There are four guidelines to the selection of reference texts.Footnote 56 First, the researcher must have a confident estimate of reference scores on the dimension of interest through the CMP, expert surveys, his own judgement or any other source. Secondly, the reference texts should contain as many words as possible, for the sake of reliability. Thirdly, reference texts should be located at the extremes of the policy dimension of interest. Fourthly, reference texts should use the same lexicon as the virgin texts. Failure to comply with these guidelines will result in invalid and/or unreliable estimates of virgin text positions. The left–right estimates for the reference texts were taken from the CMP, since their dataset covers the entire post-war era. The policy position of, for example, the 1987 Thatcher Government as set out in the Budget statement of that year will be assumed to be identical to the policy position of the Conservative party as set out in its 1987 party manifesto. Based on the abovementioned recommendations, the 1987, 2005 and 1974 Budget speeches are selected as the right-wing, centre and left-wing references, respectively, with which to score all remaining (virgin) speeches.Footnote 57
The central difficulty, however, is that virgin estimates may be unstable as the base switches from one anchor to another.Footnote 58 In other words, results could be driven by particular combinations of reference texts rather than patterns in the textual data. This would not be an issue if there was one uniquely superior set of reference texts, but this is rarely the case. In their latest publication the CMP team provide a margin of error for the point estimates of ±4.Footnote 59 The difference in left–right score between, for example, the 1983 and 1987 texts is only 1.5, making it impossible to discern whether this difference is ‘real’ or due to measurement error. This poses a dilemma, since there is no way of determining which texts actually occupy the extreme positions on the relevant axis.
Therefore, rather than settling on the 1987–2005–1974 combination to construct the policy time series, the following strategy is adopted: the two most right-wing (1987 and 1983), two most left-wing (1974 and 1975), and two most centrist (2005 and 1971) texts were selected based on their CMP scores. There are consequently eight possible combinations of these texts, either of which would satisfy the guidelines set forth by Laver, Benoit and Garry.Footnote 60 These eight ‘reasonable’ reference sets are then used to create eight separate policy time series. The resulting eight time series track one another closely, which indicates that the left–right estimates are truly driven by differences in textual patterns between Budget speeches.Footnote 61 Since the choice for one particular reference set is difficult to justify, the mean score of the eight individual series will be used as the final policy variable.Footnote 62
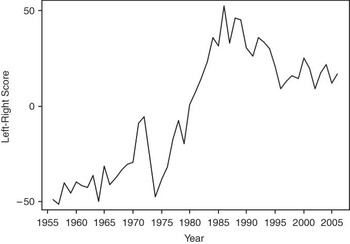
Figure 2 depicts the movement of British government policy on the left–right scale measured in this fashion from 1956 to 2006. This policy variable has a high degree of validity. First, the Wordscores measure compares well wtih expert survey data. Secondly, government policy is characterized by a general trend towards the right from the early 1970s onwards, which is consistent with reforms of the welfare state and a general move away from the post-war ‘Social Democratic Consensus’. Thirdly, government policy is found to be more right-wing for Conservative governments than Labour governments. A visual inspection of Figure 2 quickly reveals that, in the time frame under investigation, every major policy shift to the right coincides with a change from Labour to Tory rule and vice versa. Fourthly, and most importantly, the placement of individual administrations conforms to a historical account of post-war British politics.Footnote 63
Government policy in Britain

Wordscores is thus able to replicate the CMP time series with the essential advantage of providing more points of observation. The ultimate aim of the present article is to determine how much of the left–right movement in government policy can be attributed to changing public preferences.
The Independent Variable: Public Preferences
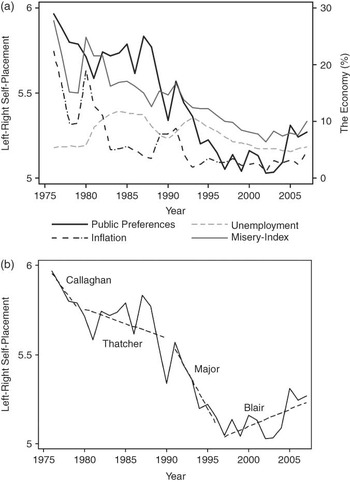
Surveys routinely ask respondents to place themselves on the left–right scale. The Eurobarometer Survey is the only available longitudinal opinion survey of more than twenty annual observations that also contains a left–right self-placement item.Footnote 64 Self-placement corresponds to ideological items, even after controlling for partisan effects: ‘the left–right scale captures attitudes towards a variety of issues and is generally an appropriate instrument for testing theories in comparative politics that have as an explanatory variable the ideological orientation of voters’.Footnote 65 Moreover, contrary to the earlier findings of the so-called Michigan School,Footnote 66 Eurobarometer respondents from eight European nations, including Britain, are generally willing and able to place themselves on this scale.Footnote 67 Thus, the annual mean value of the left–right self-placement item will be taken as a summary measure for the ideological content of public preferences (see Figure 3).Footnote 68
(a) The economy and aggregate preferences (b) Government partisanship and aggregate preferences

The mid-1970s, which eventually culminated in the election of Margaret Thatcher in 1979, have been famously dubbed ‘The Great Moving Right Show’.Footnote 69 However, during the mid-1980s and 1990s, public opinion took a turn towards the centre, and still further to the left. Nowadays, towards the halfway mark of Labour’s third consecutive term, Philip Stephens, political commentator for the Financial Times, writes that ‘the zeitgeist has changed. Middle Britain has tired of a bloated government. The pendulum has swung back to champions of a smaller state’.Footnote 70Figure 3 certainly supports Stephens’s statement on the movement of British public sentiment. This pattern of cyclicality is well established in the existing literature on macro-level mass preferences, frequently leading to its treatment as a stationary time series in statistical models.Footnote 71
The early classics of survey research, and in particular those associated with the Michigan School, argued that ordinary voters had unstable and incoherent attitudes towards political issues,Footnote 72 but public opinion at the aggregate level actually moves in quite meaningful ways. This is by no means a trivial matter, since dynamic representation would hardly be attractive if the message that the public sends to policy makers itself lacks substance. Previous scholarship has linked aggregate preference change to economic and political factors. First, Figure 3a shows that public preferences run parallel to the state of the economy, that is, economic hardship pushes public opinion to the right. A left-wing agenda is more likely to be supported by the people when the economy is flourishing, the argument being that progressive policies do not come cheap.Footnote 73 As expected, left–right self-placement is correlated with the level of unemployment, the inflation rate, and the so-called ‘Misery Index’.Footnote 74
Secondly, Figure 3b depicts a negative relationship between government partisanship and public opinion. Except for the period 1976–79, the public moves to the left during Tory rule, while moving to the right under Labour. A growing body of scholarship shows that a negative feedback occurs between what the public wants and what it gets from elected officials.Footnote 75 It is not entirely clear whether the people respond to actual policy, i.e. spending in particular domains, or to government ideology, but left–right self-placement certainly seems to adjust to political context, however defined. This is an essential feature of democratic politics, since, in the words of Soroka and Wlezien, ‘the representation of public opinion presupposes that the public actually notices and responds to what policy makers do’.Footnote 76 Without a responsive public, responsive democratic leadership cannot be expected.
While macro-level preferences measured in this fashion move in predictable ways, some have argued for the use of multiple-item scales to capture mass political attitudes rather than single indicators of left–right self-placement.Footnote 77 Geoffrey Evans and his associates suggest a composite left–right scale made up of five indicators that focus on ‘issues of inequality and exploitation’.Footnote 78 Their point is well taken, but the reality of survey research strongly works against the use of these types of scales in longitudinal research. The British Social Attitudes survey contains this composite scale from 1985 to 2006, with several years missing in between, leaving nineteen annual observations to work with. Nonetheless, to validate results obtained by operationalizing public preferences through self-placement, the analysis will be replicated using the composite scale as an independent variable instead.
Model Specification and Estimation
Policy and opinion having been captured on the same left–right dimension, their relationship can be analysed in a regression format. Dynamic representation entails that current policy outputs are a function of public preferences at previous times and past policy outputs. Some might object to the direction of causality and contend that politicians shape public opinion, not the other way round. However, Granger causality tests show that opinion ‘Granger causes’ policy, not the other way around, something which has been demonstrated throughout dynamic representation literature.Footnote 79 By including a government partisanship variable on the right-hand side of the model, the mechanism through which public opinion translates into policy can be tested.Footnote 80 If the public has an impact after controlling for which party is in power, then this points to the existence of rational anticipation. If, instead, the partisanship variable is statistically significant, while direct popular effects disappear, electoral turnover can be assumed to drive the representation process.Footnote 81 Crucially, an interaction term between public preferences and incumbency vulnerability is added to estimate whether policy responsiveness is conditional on electoral pressures. Following Hobolt and Klemmensen, incumbency security is captured by the standard vote intention question.Footnote 82 Thus, in line with Hypothesis 4, popular governments are expected to have fewer incentives to respond to public preferences than unpopular governments.Footnote 83
The justification for the inclusion or omission of variables with different time-lags is crucial. Therefore, a research strategy is adopted here of building dynamic models by moving from general to more specific specifications.Footnote 84 Surveying articles that employ dynamic analyses, Suzanna DeBoef and Luke Keele write that ‘the most common restriction – restricting contemporaneous effects of the independent variables to be zero – is often not discussed at all’.Footnote 85 The way forward is to estimate the full model and then conduct t-tests on its parameters. If the null hypothesis is rejected, the parameter in question cannot simply be omitted from the model. Doing so might bias inferences, not just of the model coefficients, but also of dynamic effects. If the null cannot be rejected, the variable can be dropped without the risk of imposing an invalid restriction. As such, a general autoregressive distributed lag (ADL) model was estimated with both contemporaneous and lagged values of the right-hand side variables using Ordinary Least Squares regression. A lagged dependent variable was also included on the right-hand side as a means of capturing autocorrelation in the policy measure. All contemporaneous effects were non-significant and their omission from the model did not affect the sign, magnitude or statistical significance of the independent variables. Additional economic controls, such as the unemployment level, rate of inflation or the Misery Index, left the results unaltered and were thus excluded to preserve parsimony as well as degrees of freedom.
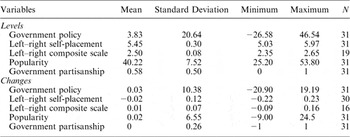
The policy measure used here contains a trend towards the right.Footnote 86 Ian Budge and Michael McDonald write that a ‘general rightwards drift can most likely be explained by the ousting of the early post-war welfare-oriented “Social Democratic Consensus” by market-oriented economics following the growth of world free trade and globalisation’.Footnote 87 They also note that similar change ‘has been resisted however by the traditionally Statist parties of continental Europe’.Footnote 88 Thus, to deal with this rightward trend, the policy variable was de-trended first. Identical results to the ones reported below are obtained by retaining the original policy variable and including a time variable on the right-hand side. As a robustness check, the model was also estimated using first differences of all the variables with very similar results.Footnote 89Table 1 outlines descriptive statistics for all the above-mentioned variables.
Descriptive Statistics, 1976–2006

Note: Government policy was de-trended first. For Goverment partisanship, 1 = Conservatives, 0 = Labour.
The restricted, and final, version of the model has the following functional form:

Lastly, as is displayed below, the error term of Equation 1 is well behaved, that is, the residuals have been successfully reduced to white noise.
Results
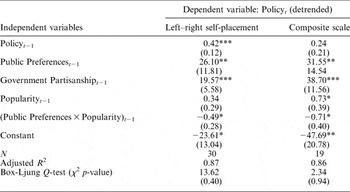
Can we predict the left–right content of government policy better with knowledge of public preferences than with past policy alone? Table 2 shows that the answer to this question is an unequivocal ‘yes’. As the British public moves right, a year later policy follows. If, for the moment, government popularity is set at its mean value, the magnitude of this effect can be calculated. Of course, the degree of responsiveness is expected to vary across different values of electoral uncertainty, but that issue will be tackled in due course. The mean static effect of public preferences on policy equals 6.39, so one standard deviation change in public preferences causes a 6-point change in government policy. Remember that this coefficient captures the direct effect of preferences on policy, that is, after controlling for which party actually governs. Considering the range in the dependent variable, the size of this effect might not seem impressive, but, as can be seen from Table 2, previous values of policy are carried over into the future. Almost 42 per cent of the shock is transmitted to the next year, 18 per cent to the one after that, 7 per cent to the one after that, and so on. All in all, in the long run, public preferences have a considerable (cumulative) impact on policy, namely 11.02 points. This effect increases further when the incumbent faces electoral pressures, as is shown below.
Dynamic Representation in Britain, 1976–2006

Note: The preference variables in both models have been standardized. The entries are unstandardized coefficients with standard errors in parentheses.
***p < 0.01, **p < 0.05, *p < 0.10 (two-tailed tests).
What about electoral turnover? Table 2 indicates a strong partisan effect in the expected direction. Since the partisanship variable is a dummy, the coefficient is readily interpretable. The replacement of Labour by the Conservatives results in a rightward policy shift of 19.57 points in the year after. In the long run, government partisanship has an effect of 33.7 points on the left–right policy content of Budget speeches, which means that the effect of turnover is about three times as large as that of rational anticipation. This is precisely as one would expect in a political system which a former lord chancellor called ‘an elective dictatorship’ and where the Cabinet determines public policy through its near-complete domination of parliament.Footnote 90
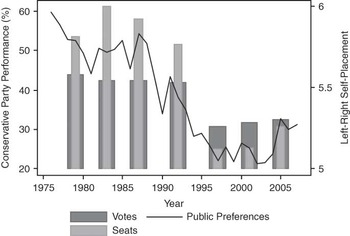
The results from Table 2 indicate that, strictly speaking, partisanship affects policy, independent of public preferences. However, as long as Conservative MPs, and consequently governments, replace Labour in times of a right-wing public sentiment, party turnover will ensure indirect representation. The time period under investigation contains just seven general elections, but Figure 4 still corroborates the strong link between macro-level preferences and election outcomes. Tory victories, in terms of both seat and vote shares, coincide with a right-wing public mood. When the public makes a rightward shift of one standard deviation, the Conservative party receives 10 per cent more seats in the House of Commons, roughly equivalent to sixty Members of Parliament (MPs).Footnote 91 The validity of the first stage of electoral turnover is thus established. In sum, both rational anticipation and election turnover ensure that policy on the left–right scale never drifts too far astray from the people’s wishes.
Public preferences and election outcomes

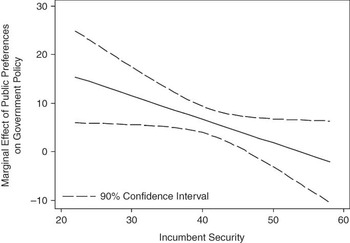
Furthermore, the marginal effect of public preferences on government policy increases as electoral pressures rise. Table 2 shows that, as governments become more popular, their direct responsiveness to the mean voter declines. The interaction term has the correct sign and is statistically significant, but the reported coefficients and standard errors only hold for the unlikely case that government popularity is zero. In the time frame under investigation, government popularity ranges from 25.2 to 53.8 per cent (see Table 1). When dealing with multiplicative interaction models, it is often useful to illustrate conditional effects graphically.Footnote 92 The downward sloping line in Figure 5 affirms that responsiveness decreases as incumbency security rises.Footnote 93 The cumulative impact of rational anticipation under maximum electoral uncertainty is therefore 24 points, which in terms of magnitude brings it very close to the turnover effect. Also, the confidence interval in Figure 5 reveals that the interaction effect is only statistically significant when popularity remains under 46 per cent. Rational anticipation thus completely collapses in the absence of a credible threat of defeat. This does not imply that representation as a whole suffers. As mentioned throughout this article, political representation occurs both directly and indirectly, and it is only the former that thrives under electoral incentives.
Electoral pressure and government responsiveness

Finally, Table 2 also reports findings where public preferences are measured by a composite left–right scale rather than self-placement. This is quite a challenging test since the composite scale spans a shorter time period and has only nineteen observations compared to thirty for the self-placement item. Generally, similar results are found in terms of the sign, magnitude and statistical significance of the key variables, with one major exception: The composite model finds an even larger partisanship effect than the self-placement model. This is most likely due to the fact that the composite left–right scale starts in 1985, during the heyday of Thatcherism, while the self-placement item starts in 1976. As Figure 2 shows, the first Thatcher government was quite moderate in its policy outputs as most of the policy proposals on privatization and individual share ownership only took shape in her second and third term in office. By omitting Thatcher’s first government, the composite model thus overestimates the turnover effects. Be that as it may, the overall conclusion is clear: rational anticipation, driven by electoral incentives, and party turnover form the two main pathways of representation and between them account for a large part of the variation in public policy outputs.
Discussion
This article has demonstrated the existence of dynamic representation in Britain. The main point to emphasize is that policy on the left–right scale never gets too far ahead of the public. The sanction of elections is a constant driving force for governments to adapt to public opinion, and, even if they do not, representation is ensured through their proper replacement.
These normatively appealing results stand in contrast to several influential large-scale comparative studies that are decidedly unfavourable to the majoritarian, winner-takes-all, systems, of which the Westminster model is frequently posited as the archetype.Footnote 94 While static representation (or ‘congruence’), measured as government–voter proximity on the left–right scale, might sometimes be poor in these countries – particularly in comparison to the so-called proportional systems – a completely different picture emerges from a dynamic viewpoint. Stimson, Mackuen and Erikson have shown as much with respect to one high-profile majoritation polity, namely the United States. The analysis presented above has yielded comparable findings with respect to another, namely Britain. Of course, this is not to say that Westminster systems have an advantage over proportional systems when it comes to dynamic representation. Such conclusions would be unfounded when based on results from merely one majoritarian case, but it does point to the necessity of distinguishing between congruence and policy responsiveness, which are both different aspects of the larger concept of political representation.
Parts of the dynamic representation framework travel to proportional systems, where, for example, centre parties ally with parties of the left or of the right. In that case, government partisanship will certainly explain policy outputs, albeit to a lesser degree than in majoritarian systems where governments have more power vis-à-vis the legislature. Rational anticipation is also possible in a multiparty context, although it is far from straightforward to export conventional reward–punishment models that work well in the British and American contexts to a coalition setting, since a coalition government weakens the incentives that drive that particular mechanism.Footnote 95 The biggest challenge, however, would be to incorporate the fact that in proportional systems voters do not decide on which parties enter the coalition government. Especially in the more fragmented party systems, several different coalitions might be formed after any election, and this invalidates the first stage of the electoral turnover mechanism. A future research agenda would certainly have to elaborate on these pathways of representation and their place in proportional democracies.
Given that the British government policy and mass opinion are systematically tied to one another, it is all the more surprising that recent polls show that only a third of British respondents actually believe they have a say in government.Footnote 96 This belief points to one limitation of the present study. Aggregation across policy domains masks cross-domain differences, and thus neglects certain salient issues on which the public certainly did not see their preferences translate into policy – European integration and the Iraq War are recent candidates.
Another limitation concerns the treatment of the public as one, while policy responsiveness is likely to differ across subgroups of the population. Even the best-known proponent of the median voter theorem concedes that ‘the division of labour and the presence of uncertainty’ guarantee that ‘rational men will be politically informed to different degrees. Thus the foundations for inequalities of power are inherent in democratic societies, even though political equality is their basic ethical premise’.Footnote 97 In a similar vein, Robert Dahl famously asked himself: ‘in a political system where nearly every adult may vote but where knowledge, wealth, social position, access to officials, and other resources are unequally distributed, who actually governs’?Footnote 98 Only recently has empirical research on representation shifted its focus from the public at large to various economic strata.Footnote 99 This important strand of scholarship indeed points to biased representation, although it must be stated that the results depend on static models rather than dynamic ones.
Policy responsiveness is not a constant. Jeff Manza and Fay Cook put their ‘contingency’ view of responsiveness as follows: ‘Although policy will tend to follow public opinion more often than not, there is sufficiently wide variation in the extent of responsiveness across different issues and at different points in time to warrant increased scholarly attention to examining the institutional and political sources of variation’.Footnote 100 A research agenda for the future has thus been set. As this study has shown, electoral pressure constitutes one such political source of variation. Political institutions constitute another.Footnote 101 While many important questions yet remain, the approach set forth in this article develops a baseline model upon which future research can be built.