1. Introduction
Introductions of invasive alien species, defined as species that become established in natural or semi-natural ecosystems or habitats, and threaten native biological diversity (IUCN, 2008), are not a new phenomenon, but can be traced back to the arrival of agriculture 10,000 years ago. Such introductions are considered to be the leading cause of species extinction (Caughley, Reference Caughley1994; Clavero and Garcia-Berthou, Reference Clavero and Garcia-Berthou2005). The typically negative economic impact of invasive species on ecosystem services can be effectively quantified (Charles and Dukes, Reference Charles, Dukes and Nentwig2007). The estimated annual costs of non-indigenous species (NIS) show a considerable variation, ranging from 3 to 344 Euro/capita across nations (Gren et al., Reference Gren, Isacs and Carlsson2009b). However, in spite of ecologists' and biologists' relatively early recognition and concern about eventual damage and social costs associated with invasive species, there exists relatively little environmental economic research on the topic (e.g., Shogren and Tschirhart, Reference Shogren and Tschirhart2005). Most of the scant research has focused on theoretical analyses concerning efficient management strategies (e.g., Knowler and Barbier, Reference Knowler, Barbier, Perrings, Williamson and Dalmazzone2000; Perrings et al., Reference Perrings, Williamson and Dalmazzone2000; Horan and Lupi, Reference Horan and Lupi2005; Shogren and Tschirhart, Reference Shogren and Tschirhart2005; Gren, Reference Gren2008), and on cost and benefit calculations of programmes preventing, controlling, or eradicating damage from species' invasion (see Born et al., Reference Born, Rauschmayer and Bräuer2005; Lovell and Stone, Reference Lovell and Stone2005; Olson, Reference Olson2006). Much less is known about the factors contributing to the occurrence of NIS across nations. The main purpose of this study is to test two main hypotheses regarding the characteristics of recipient mainland and island nations for occurrences of invasive species: the openness and the habitat degradation hypotheses.
The openness hypothesis refers to the role of openness of a country, mainly trade as a vector of NIS, which can ‘hitchhike’ with cargoes and goods or be traded in the international markets for exotic plants or animals (e.g., Perrings et al., Reference Perrings, Williamson and Dalmazzone2000). The habitat degradation hypothesis, on the other hand, emphasises the role of disturbed areas for the susceptibility of NIS in recipient nations, where disturbed areas may be related to economic activity measured by gross domestic product (GDP) and different types of land uses (e.g., Perrings et al., Reference Perrings, Williamson and Dalmazzone2000). The two hypotheses were tested by Dalmazzone (Reference Dalmazzone, Perrings, Williamson and Dalmazzone2000), who made an econometric test of the occurrence of alien species in 26 nations. Using the fraction of alien species to native species as the response variable, the results indicated that none of the hypotheses could be rejected. Similar results were obtained by Vilà and Pujadas (Reference Vilà and Pujadas2001), who reported a significant and positive correlation between imports and density of NIS in 10 European and North African nations.
This study extends the two earlier studies on causes for occurrence of invasive species in three respects. The first and main extension separates island nations from mainland nations since native species in island nations are considered to be particularly susceptible to NIS because of their development without competition with species from other regions (e.g., Reaser et al., Reference Reaser, Meyerson and Cronk2007). The second contribution employs an explorative inferential approach that combines complementary econometric methods for testing the effect of potential causes on the response expressions of NIS. The third extension compares inferential results across three different response expressions of NIS, where two expressions – NIS in relation to native species, as well as to territorial area – coincide with the studies performed by Dalmazzone (Reference Dalmazzone, Perrings, Williamson and Dalmazzone2000) and Vilà and Pujadas, (Reference Vilà and Pujadas2001). The third NIS response, the global share of a nation's NIS occurrence, is introduced in order to obtain compatibility across data sources.
This paper is organised as follows: first, a brief background is given with respect to the occurrence of NIS in different regions. Next, data are presented, which is followed by presentation of econometric methods and the associated results. This paper ends with a concluding discussion.
2. Background
In principle, species interchange occurs when biota set by physical and biological barriers are affected by, for example, climate change and alteration in the configuration of water bodies and land areas (e.g., Vermeij, Reference Vermeij1991). Alterations in natural colonisation have occurred as a response to, among others, volcanic activities and environmental changes over geological and historical time periods. For example, the establishment of land connection between South and North America during the Pliocene epoch intensified the exchange of biota between the continents. The rate of spread of species has increased during the last 50,000 years due to human colonisation of different parts of the world (Gaston et al., Reference Gaston, Jones, Hanel and Chown2003). It is also predicted that current climate change may cause drastic change in biota due to a warmer Arctic ocean similar to that in the Pliocene epoch (Vermeij and Roopnarine, Reference Vermeij and Roopnarine2008).
The interchange of species is most often asymmetric with dominant donor and recipient regions, such as the movement of rain forest organisms from south to north in the great American interchange during the Pliocene epoch, and the transport of marine organisms in the Atlantic from east to west in the same epoch. One reason for such patterns of asymmetric invasions is that species can travel long distances by using ocean currents or winds, such as spread of cattle egret from Asia to Europe and North America. Other hypotheses rest on superiority of donor biota providing species with respect to productivity, competition and defence as compared to the recipient biota. Evidence of this is oceanic islands’ susceptibility to predation and diseases carried by invaders from continents. However, the rare interchange between species in biodiversity rich tropical marine biota and less productive temperate zones point at other explanations such as the functioning and the quality of biota prior to invasion (Vermeij, Reference Vermeij1991).
Human induced spread of species is, in principle, caused by alterations in habitats and by movements of species (Vermeij, Reference Vermeij1991). An example of the former is the construction of the Suez channel in the 1960s, which caused significant spread of fish and mollusc from the Red Sea to the Mediterranean. Trade is regarded as the most important factor for intentional and unintentional spread of species (e.g., Perrings et al., Reference Perrings, Williamson and Dalmazzone2000). Driving forces during time for intentional spread are the need for food, such as cattle, fish, and seeds. Another factor is the demand for species for sport, cultural or aesthetic events. For example, the yellow floating heart was introduced in Sweden as an ornamental plant in gardens (Carlsson and Kataria, Reference Carlsson and Kataria2008), and game bird and different species of deer have been introduced in many nations for sports and recreational purposes (Gaston et al., Reference Gaston, Jones, Hanel and Chown2003).
Common to natural and human induced spread of NIS is the relatively low average probability of establishment and invasiveness of an introduced species. According to the ‘tens rule’, 10 per cent of species entering a new host region become established and 10 per cent of the established species become invasive (Williamson and Fitter, Reference Williamson and Fitter1996). The validity of this rule varies for different species, and the invasiveness probability is regarded as being higher for vertebrates, in particular, for introduced mammals (e.g., White et al., Reference White, Ford, Clout, Engeman, Roy and Saunders2008). Nevertheless, according to a study of invasion dynamics of 30 different species, there is a general pattern of invasion and spread where the species reach an equilibrium-population level (Arim et al., Reference Arim, Abades, Neill and Marquet2006). The equilibrium-population size is determined by suitable sites and competition for food in the recipient region. It is generally regarded that the availability of suitable sites is related to the degree of disturbed natural habitat, which creates open space. Reduced biodiversity in a habitat can increase invasibility, probably through reduced competitiveness in the native community (Levine, Reference Levine2000). On a large scale, biodiversity has been shown to be positively correlated with invasibility (Lonsdale, Reference Lonsdale1999), probably due to processes that promote both native and non-native species richness.
To the best of our knowledge, only three studies have investigated the role of habitat conditions and economic factors on NIS occurrence (Dalmazzone, Reference Dalmazzone, Perrings, Williamson and Dalmazzone2000; Vilà and Pujadas, Reference Vilà and Pujadas2001; Gren et al., Reference Gren, Campos, Edsman and Bohman2009a). Two of these studies tested the explanatory powers of income level, openness, and land use patterns for NIS occurrences in different nations (Dalmazzone, Reference Dalmazzone, Perrings, Williamson and Dalmazzone2000; Vilà and Pujadas, Reference Vilà and Pujadas2001), while the third study tested the impact of income levels and attitudes on the number of waters containing an invasive signal crayfish in Sweden (Gren et al., Reference Gren, Campos, Edsman and Bohman2009a). Dalmazzone (Reference Dalmazzone, Perrings, Williamson and Dalmazzone2000) econometrically tested the occurrence of alien plant species as a share of native plant species in 26 nations. She used merchandise imports, import duties, and a dummy for island nations, as openness variables. Included biota variables were population density, GDP/capita, and shares of arable land and permanent pasture of total territorial area. Multiple linear regression analysis was used, and the results indicated a significant and positive impact of the dummy for island nation, population density, and share of permanent pasture on the response variable for several model constellations.
Similar to Dalmazzone (Reference Dalmazzone, Perrings, Williamson and Dalmazzone2000), Vilà and Pujadas (Reference Vilà and Pujadas2001) carried out tests for the occurrence of invasive plants across nations, but related the number of invasive plants to the territorial area instead of the number of native plants. Furthermore, they applied a more explorative approach without the imposition of functional forms on regression equations. They used number of tourists, net immigration and value of imports as openness variables, and length of traffic routes, woodland cover, crop cover, population density, GDP and United Nations human development index as biota indicator variables. They reported a significant and positive correlation between imports, length of transportation networks, the human development index and the density of alien plants, in 10 European and North African nations.
When comparing the results from these two studies, we thus find that the openness hypothesis obtains support from both, although through different constellations of explanatory variables. Where Dalmazzone (Reference Dalmazzone, Perrings, Williamson and Dalmazzone2000) identifies the island factor as an effective explanatory variable, the study of Vilà and Pujadas (Reference Vilà and Pujadas2001) emphasises the role of imports. Similarly, the biota hypothesis is supported by different explanatory constellations. The reasons for alternative results can be found in differing inferential methodology and data, and in different model specifications. In this paper, we expand on the combination of methods used by Dalmazzone (Reference Dalmazzone, Perrings, Williamson and Dalmazzone2000) and Vilà and Pujadas (Reference Vilà and Pujadas2001) by applying a complementary sequence of methods initiated by inferring the dimensionality of the explanatory matrix. This is followed by identification of the subset of explanatory variables that most effectively represents the resulting regressor space. Multiple linear regression is then used to estimate variables' effects on the NIS response. The chosen combination of methods, which will be further discussed in the next chapter, resembles principal component regression and/or partial least squares regression (Ryan, Reference Ryan2009), but allows for larger control since the different steps involved are separated and manually performed. We also use a larger data set than the two earlier studies that, basically, encompasses all nations on earth. In particular, this allows for effective econometric inference across mainland and island nations.
3. Description of data
Following earlier literature, two of our response variables measure the occurrence of invasive species: the number of invaders divided by the number of native species (Dalmazzone, Reference Dalmazzone, Perrings, Williamson and Dalmazzone2000), and the number of NIS per territory area (Vilà and Pujadas, Reference Vilà and Pujadas2001). Unlike these studies, data on invasive species are not only obtained from plants, but from all taxonomic groups within the different nations (ISSG, 2008). Data retrieval is greatly facilitated by the availability of data on the total number of native bird, amphibian, and mammal species in each nation recorded by IUCN (2008), and the number of NIS recorded by ISSG (2008). These two databases cover all nations, but share a disadvantage with respect to the lack of time dimension of reported native species and occurrences of NIS. Hence, it is not possible to trace when the NIS was detected in the respective nations, which means that inferential results only indicate the explanatory power in assessing the variation of NIS occurrence across nations, and do not contribute to our understanding of the temporal changes of NIS occurrences within nations. Despite this drawback, the databases – and in particular the IUCN list of native species – are extensively used for inferring the causes of biodiversity loss (e.g., McPherson and Nieswiadomy, Reference McPherson and Nieswiadomy2005; Clavero et al., Reference Clavero, Brotons, Pons and Sol2009). Another disadvantage of the ISSG database is its failure to classify different NIS taxonomic groups, which means that we cannot relate the changes in NIS to different taxonomy. Since the databases on NIS differ with respect to the coverage of taxonomic groups as compared with the IUCN list of native species, a third response variable is introduced which is defined as a nation's share of NIS in relation to the global number of NIS. This variable should capture the contribution of each nation as a host region to global NIS.
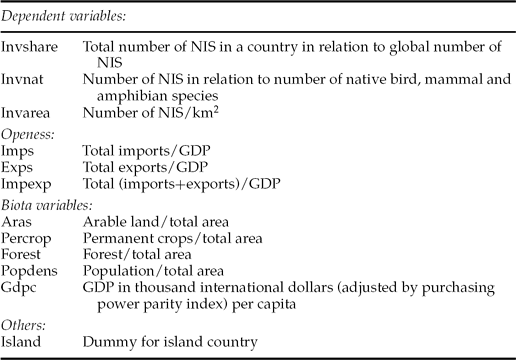
The inclusion of explanatory variables in the regression equations is much guided by choices made in the earlier literature, but also restricted by the availability of data for making separate regressions for island and continental nations. Both Dalmazzone (Reference Dalmazzone, Perrings, Williamson and Dalmazzone2000) and Vilà and Pujadas (Reference Vilà and Pujadas2001) use imports and tourism as measurements of openness, and apply arable land, human population density, and GDP as biota indicators. Dalmazzone (Reference Dalmazzone, Perrings, Williamson and Dalmazzone2000) adds tariff rates and permanent pasture areas, and Vilà and Pujadas (Reference Vilà and Pujadas2001) add woodland and land fragmentation variables. In this study, we use three different expressions of openness; imports, exports, and the sum of imports and exports as shares of GDP. Explanatory variables for biota disturbances are population density, shares of arable land, permanent crops and forests of total territorial area. Data on these variables are found in international databases; land use data in CIA (2008) and macroeconomic data in United Nations (2008). See table 1 for a list of response and explanatory variables, together with the associated abbreviations and data sources.
Abbreviations and description of variables
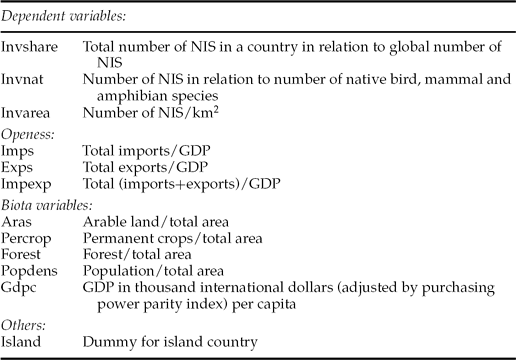
The specification of the response variables arises from differently profiled questions concerning the occurrence of NIS. Regression results on the Invshare response reveal the relative occurrence of NIS across nations. Results hence show if and how explanatory variables change these relative contributions, measured as shares of global NIS. However, effects generating proportional overall changes in global NIS will not show up in the regression equations. Regression results on the Invnat response express differences among countries with respect to both NIS and native species. For example, a nation with larger share of areas with permanent crop may show a higher number of both NIS and native species than a nation with less permanent crop areas. The final response, Invarea, is designed to catch differences in changes in NIS density. As will be shown in section 4, inferential results differ widely depending on the choice of response variable.
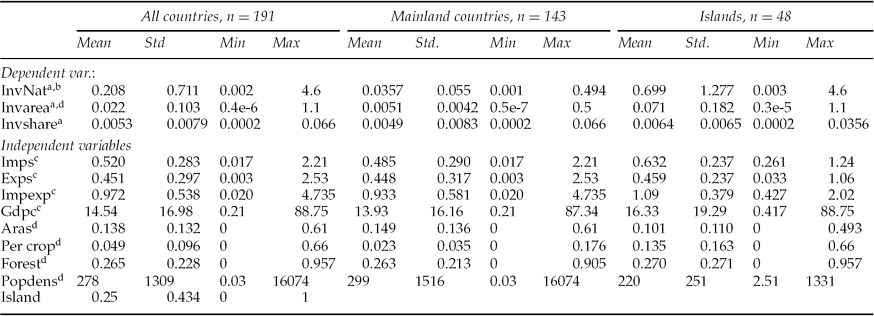
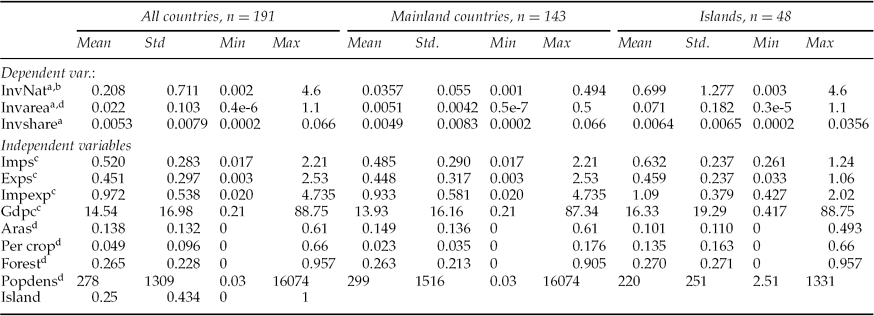
For island as well as mainland nations, descriptive statistics are presented in table 2. When comparing the descriptive statistics of the different response variables across mainland and island nations, we find significantly different average values regarding Invnat and Invarea. The average values are higher for islands, reflecting their relative NIS intensity (Williamson, Reference Williamson1996; Reaser et al., Reference Reaser, Meyerson and Cronk2007). The largest proportions of NIS in relation to native species are found on Nauru (4.6), Kiribati (4.2) and Samoa (4.1). Nauru has also the highest proportion of NIS in relation to territorial area (1.1), followed by Tuvalu (0.6) and Monaco (0.5). In the matrix of potentially explanatory variables, the most obvious island effect is found in Percrop, where the proportion of permanent crops to total area is significantly larger within island than mainland nations.
4. Econometric inference and results
In explaining the variation of a response variable Y, many strategies exist for determining the most suitable matrix of explanatory variables X. The, perhaps, most obvious is to simply include all variables in a regression model, and to use estimates of significance and standardised regression coefficients as a measure on the relative importance of individual variables. Since the resulting model may try to explain the variation of the response variable with a set of more or less correlated variables, the main disadvantage of this approach is that model interpretation may become ambiguous. In order to avoid this, a relatively orthogonal subset of variables should be chosen to represent the principal components of X, thus simultaneously optimising explanatory power and unambiguous model interpretation. In this study, this is done in accordance with Ryan (Reference Ryan2009), who thoroughly discusses modern regression methods and suggests Mallow's Cp (Mallow, Reference Mallow1973; Seber, Reference Seber1977, pp. 364–369) as an effective way to punish a linear combination of potential regressors with respect to multicollinearity and accumulated error (Ryan, Reference Ryan2009). Mallow's Cp resembles Akaike's information criteria when generic variance σ2 is known a priori (Young, Reference Young1982). In our case, where σ2 is estimated from data, Mallow's Cp is a better choice (Everitt, Reference Everitt1984).
Prior to the identification of a suitable regressor space, the dimensionality of X should be inferred. If, as discussed above, it is hypothesised that openness and biota constitute two independent (orthogonal) clusters wherein the associated variables are relatively strongly correlated, an unambiguous solution should contain exactly one variable from each cluster. There are several popular methods for determining the dimensionality of data. One quite robust method is multidimensional scaling (MDS) (Borg and Lingoes, Reference Borg and Lingoes1987), where the distortion of projecting the observed set of variables onto an iteratively decreasing dimensional space is measured. When distortion plunges, the minimum dimensional number for depicting the observed space has been transgressed. Other popular methods for doing similar things are tree clustering and principal components analysis (PCA). We will use MDS in combination with PCA and tree clustering in order to explore the existence of openness and biota clusters within the X matrix, and to establish a space wherein the variance of the NIS responses may be unambiguously depicted.
When the dimensionality of X is inferred, and a subset of orthogonal regressors identified, the final estimation of regressor coefficients is made with ordinary multiple linear regression (MLR). In addition to the above, assumptions such as heteroscedastic normal residual variation, and hence an approximate normal response variation, are checked and addressed if necessary. The software used through all analyses is STATISTICA version 8.0, Tulsa USA, and SAS version 9.1, Cary USA.
4.1. Probability density functions and island effect
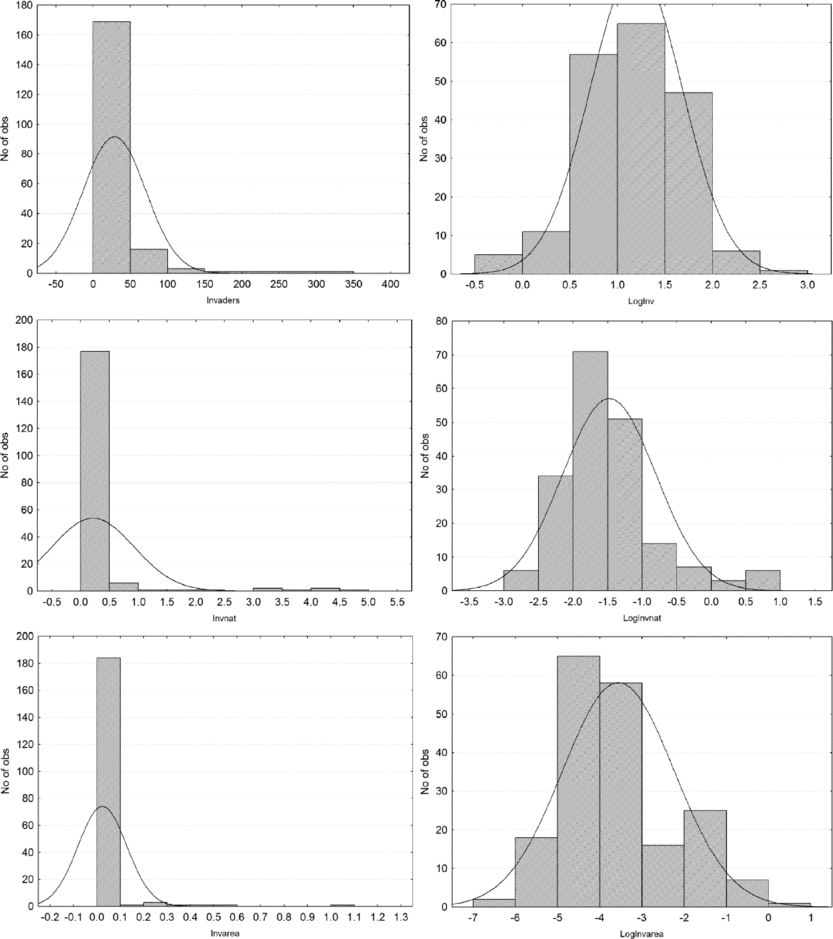
The denominator of Invshare (the worldwide sum of NIS) is constant across all nations, and therefore, may be omitted from any further inference without any effect on the results (Invshare is transformed into Inv). When the three resulting NIS responses are checked with respect to their respective probability density distributions, the primary variables are found to be heavily right skewed (figure A1, Appendix). Since they all are theoretically distributed in the interval [0, ∞], they are log transformed onto [−∞, ∞], which is the sample space of a normal distribution. The resulting response variables are called LogInv, LogInvnat, and LogInvarea.
In the matrix of potentially explanatory variables, Popdens, Gdpc, Exps, and Impexp turn out to be heavily right skewed, and therefore in need of transformation. Since the square of the resulting variables will be tested in the study, an intermediate transformation onto [0, ∞] is required. Therefore, we calculate the logarithm of 1+Popdens, 1+Gdpc, 1+Exps, and 1+Imexp, and call the resulting variables Tpopdens, Tgdpc, Texps, and Timpexp, respectively.
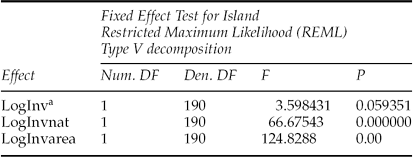
In accordance with Box and Cox (Reference Box and Cox1964), we henceforth substitute the variables discussed above with their respective transformations, and apply a restricted maximum likelihood routine to infer whether island has a significant effect upon the transformed NIS variables, see table 3. Although the significance is weak in the case of Loginv, we conclude that the hypothesis regarding an island effect cannot be rejected in any of the three cases of NIS responses. As a result, we henceforth distinguish island nations from mainland nations.
Island effect on response NIS variables
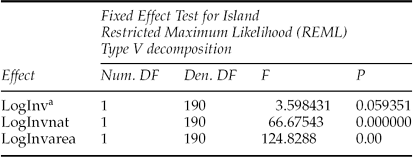
aSince Invshare has the same denominator for all countries, there is no effect on the results by taking the log of number of NIS in each country.
4.2. The dimensionality of the explanatory variables
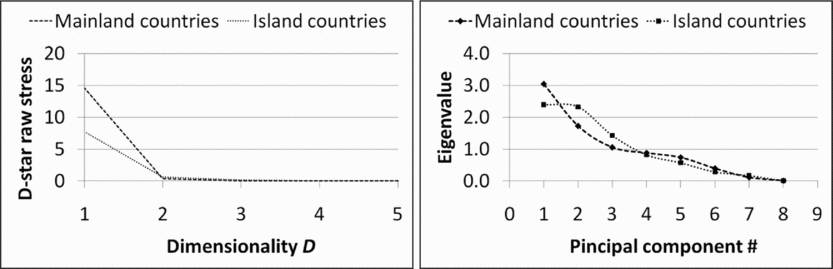
With MDS being regarded as a relatively robust method for inferring the dimensionality of a variable set, we apply a standard Guttman-Lingoes starting configuration and consecutively project X onto D ∈ {7, 6, 5, 4, 3, 2, 1} dimensions, while recording the resulting distortion (D-star and D-hat raw stress). As a result, figure 1 (left) is generated, and we conclude that distortion increases slightly when four dimensions are projected onto D = 3, and plunges when three dimensions are projected onto D = 2. Thus, we conclude that the variance space of X seems to hold two or three orthogonal components, and that this result is valid for both mainland and island nations.
Dimensionality of regressor matrix for mainland and island countries. MDS estimate at left, PCA scree plot at right.

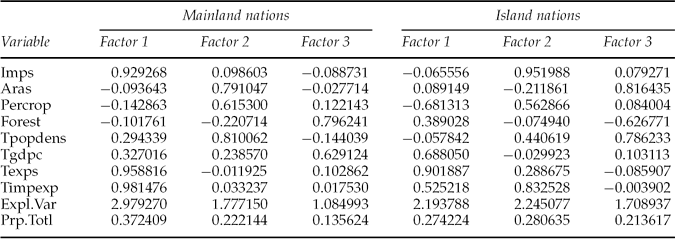
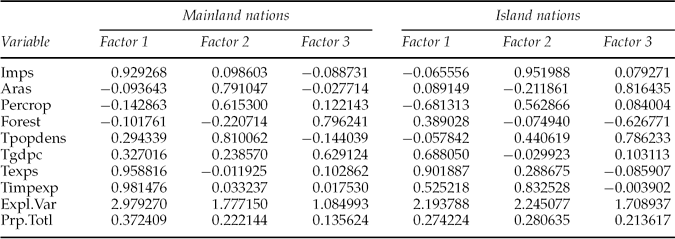
The drawback of MDS is that it doesn't reveal the identity of the clustered variables associated with the respective dimensions. For this we need some method of factor analysis (like PCA), where factor loadings hold information regarding cluster constituents. Although PCA is generally less robust than MDS, combining the methods substantially increases inferential value. Hence, we apply PCA to infer the dimensionality of X (using a Varimax raw rotation strategy), and use the mainland case to illustrate basic PCA principles. Here the factor plot of figure 1 (right), in combination with the factor loadings of table 4, show that the main carrier of information in X is a linear combination of the openness variables Imps, Texps, and Timpexp (factor 1, table 4), and that factor 1 explains approximately 37 per cent of the total variation held in X. Factor 2 is constituted by a linear combination of the biota variables Aras and Tpopdens, and explains another 22 per cent of the variation held in X. Factor 3 is constituted by Forest, and explains another 14 per cent of the variation observed in X. In accordance with figure 1 (right), the next factor would reduce the remaining information content below standardised eigenvalue 1, i.e., below what is carried by any individual variable, which no longer is meaningful. Hence, we conclude that approximately three orthogonal coordinate axes are required to depict the information content of X, and that this result corresponds very well with the MDS results. When a model is constructed to unambiguously explain the variation of NIS across nations, one variable from each factor should be chosen (basically the one strongest correlated with Y).
Varimax-rotated factor loadings of the explanatory variables, mainland and island nations
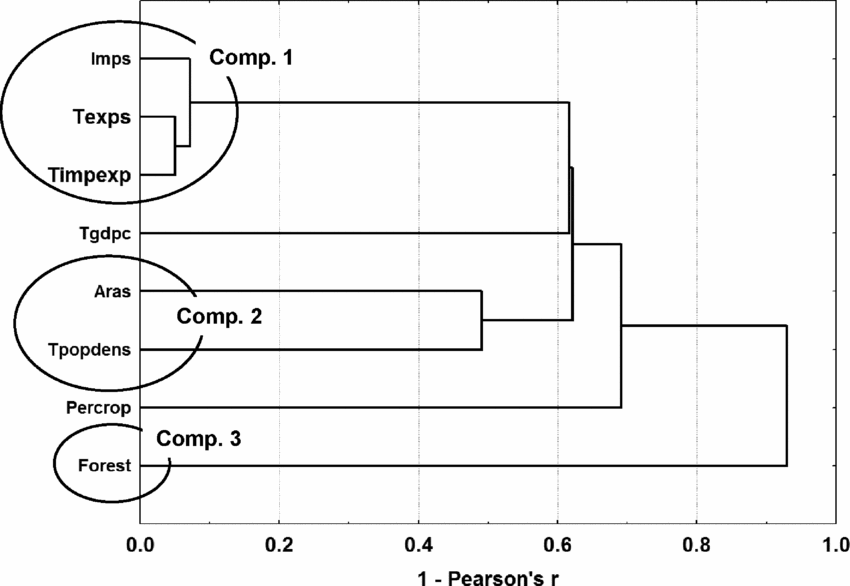
The rather detailed inference undertaken above may be further verified with a tree clustering technique. When 1 – Pearson's r is used as a measure of distance across the eight variables contained in X, figure 2 is produced in the case of mainland nations (island nations basically look the same). Hence, we have three independent (more or less) indicators pointing at approximately three orthogonal factors within X, and the next step is to identify the three variables best suited to represent the associated variance space.
Correlation distances across regressor variables. Mainland nations with principal components (Comp. 1) indicated. Single linkage amalgamation, 1 – Pearson's r distances.

The distribution of variable loadings within factors, as given in table 4, reveals that the respective groups of openness and biota variables (see table 1) constitute rather well-defined clusters in mainland as well as island nations. Table 4 also reveals differences between the two nation types, since the biota cluster seems to split into two functional groups within mainland nations, whereas the openness cluster is split into two functional groups within island nations.
4.3. Break-point regression
In the next step of exploratory analysis we address the hypothesis regarding a breakpoint relation between the explanatory and response variables. There is probably no better method for such an analysis than simply plotting the relation between transformed responses and the primary (un-squared) constituents of X (Ryan, Reference Ryan2009). Such plots, which can be obtained from the authors upon request, do not reveal the existence of a breakpoint relationship in any of the cases addressed. Instead, relationships look rather linear (in logarithmic space) and, in the case of NIS occurrence, logarithmic space seems like a better place to describe the relationship across X and Y, than a second-order polynomial space.
4.4. Subset variable selection and multiple linear regression
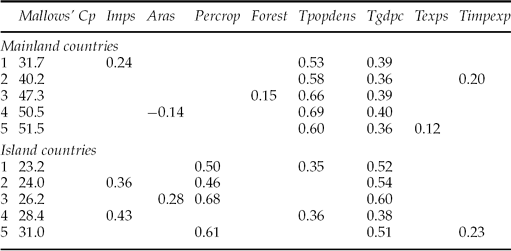
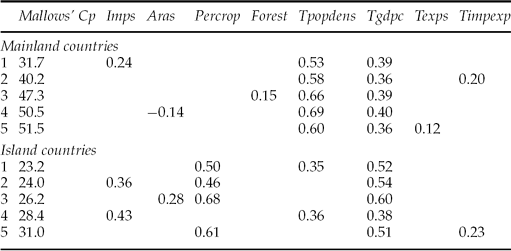
Based on the above, subset variable selection and MLR are performed on the un-squared variables. Mallow's Cp are assigned to every possible three-variable combination of regressors (56 possible combinations in the respective cases of mainland and island countries) and regressed on the three response expressions of NIS occurrence (see table A1 with Loginvarea as response variable). We conclude that a linear combination of Imps, Tpopdens, and Tgdpc constitutes a three-dimensional base suitable for depicting the variation of NIS responses. We also conclude that this choice is sufficiently valid for mainland as well as island countries, and that the choice coheres with our inference results on explanatory dimensionality (see table 4).
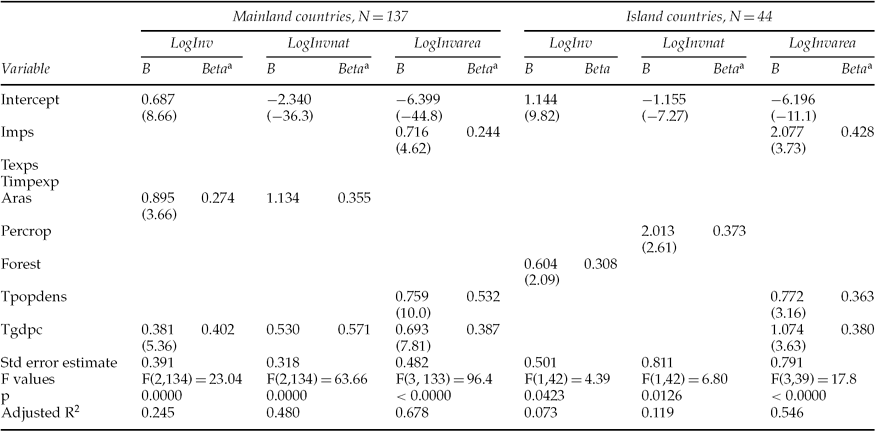
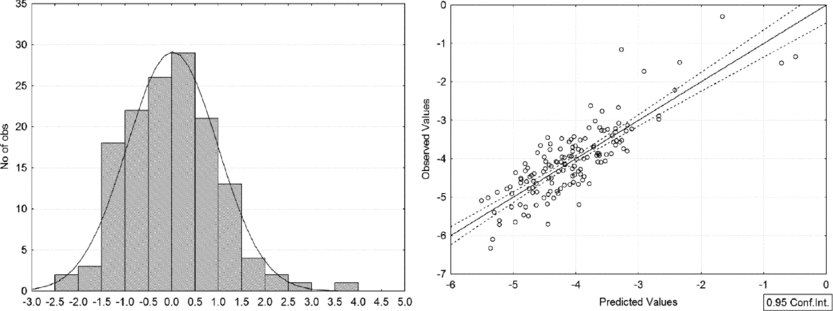
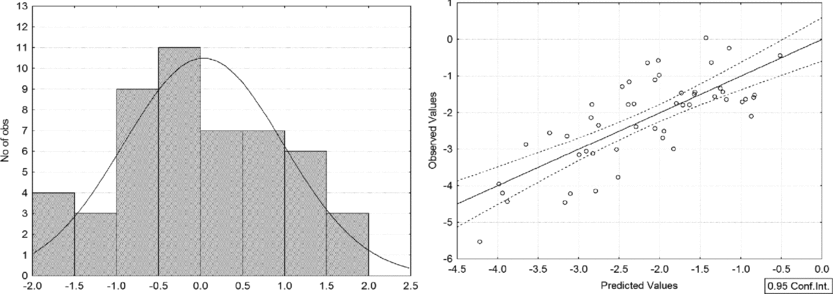
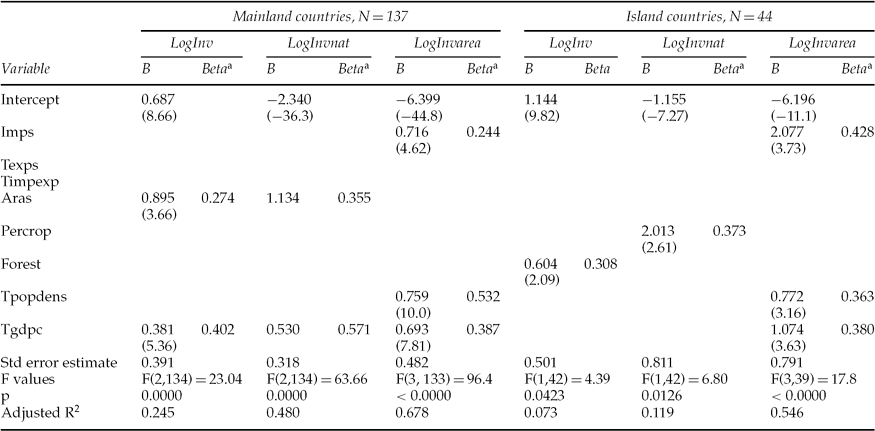
Results from multiple linear regression analyses are presented in table 5, and it can be seen that the response NIS expression Loginvarea outperforms the two alternative responses, especially in the case of island nations. At the mainland, 68 per cent of the associated NIS variation observed across nations is explained with a linear combination of Imps, Tpopdens, and Tgdpc, whereas 55 per cent of the variation observed in island nations is explained with the same set of variables. As illustrated in figures 3 and 4, the resulting residual distributions are approximately normal, with no heteroscedastic tendency when observed Loginvarea is regressed on the associated model prediction.
Regression results for mainland and island countries and different NIS responses from multiple regression, t-values for estimated coefficients within parentheses
aStandardised regression coefficients.
Standard residual distribution and plot of predicted versus observed in the case of LogInvarea observed in mainland nations.

Standard residual distribution and plot of predicted versus observed in the case of LogInvarea observed in island nations.

Then it may be concluded that the Loginvarea response splendidly fulfils model assumptions, and should be considered as a generally suitable expression for catching the variation of NIS occurrence in mainland as well as island nations. These results may be further verified with stepwise regression, where the exact results are achieved if the subset variable selection is confined to three regressors.
4.5. Discussion
Due to the superiority of Loginvarea in expressing NIS occurrence, we discuss the effects of different explanatory variables for this variable only. Hence it may be noted that the openness and biota hypotheses are supported by the same explanatory variables for mainland and island nations, although in different ways. In order to rank the effect of individual explanatory variables, the standardised regression coefficients displayed in table 5 should be considered (within parentheses below). We thus conclude that the explanatory variables may be ranked Tpopdens, (0.532), Tgdpc (0.387), and Imps (0.244) with respect to their relative contribution in explaining the variation of Loginvarea across mainland nations, and Imps (0.428), Tgdpc (0.382), and Tpopdens (0.363) across island nations. As a result, there seems to be a switch of explanatory efficiency within the regressor matrix when we move from mainland to island nations.
It is interesting to note that Tgdpc has a similar effect on Loginvarea in mainland as well as island nations – the positive regression coefficients support earlier results from Dalmazzone (Reference Dalmazzone, Perrings, Williamson and Dalmazzone2000) and Vilà and Pujadas (Reference Vilà and Pujadas2001). When the effect of the biota variable Tpopdens is compared across the two nation types, we conclude that it is weaker in island nations as compared with mainland nations. On the other hand, the effect of the openness variable Imps is weaker in mainland countries than in island nations. When NIS occurrence is represented with the Loginvarea variable, we conclude that the effect of openness seems to dominate in island nations, whereas habitat indicator seems to dominate NIS occurrence in mainland countries.
One reason for this switch across island and mainland nations might be explained by the historic island exposure to NIS along strategic shipping routes in-between trading nations, as indicated by the larger average import shares as compared with mainland countries (table 1). This exposure to foreign trade increases the probability of NIS import and establishment, in particular in NIS susceptible island nations (e.g., Reaser et al., Reference Reaser, Meyerson and Cronk2007). In the case of mainland nations, the more dominant role of biota-related variables may be due to the NIS competition with native species. During undisturbed habitat conditions, native species are better suited to compete for limited food and habitat resources in mainland countries, as compared with island countries (e.g., Blossey and Notzold, Reference Blossey and Notzold1995). Island countries are perceived as particularly vulnerable because of their abundance of endemic species, which have not been exposed to competition from NIS to the same extent as native species in mainland countries. This lack of exposure to NIS discourages the evolution of competitive abilities of native species.
The results presented in table 5 also show that land use variables have no significant effect on Loginvarea neither in mainland nor in island nations. Instead, nations with high population density have a relatively larger share of Loginvarea (in particular mainland countries). This may be explained by latent factors, such as railways and roads that destroy habitats without being included in our data. Vilà and Pujadas (Reference Vilà and Pujadas2001) have shown that such variables have a significantly positive effect on NIS density.
5. Summary and concluding remarks
The main purpose of this study has been to test two main hypotheses for the variation of NIS occurrence across nations; the openness and biota hypotheses for introduction and establishment of alien species. Another purpose was to test whether the composition of factors that governs NIS occurrence stay invariant as we move from mainland to island nations. Cross-section data for all nations were applied and three different specifications of the dependent variable were used: a nation's number of NIS in relation to total global amount of NIS, NIS in relation to native species, and NIS per km2. The openness hypothesis was tested by three explanatory variables: export, import, and import plus exports as shares of GDP. The biota hypothesis applied GDP/capita, arable land, forest, permanent crop land, and population density as explanatory variables in all regression equations.
Specific island effects on all dependent variables were identified, and results from principal component analyses showed well-defined clusters of influence from the openness and the biota variables. A combination of explorative methods (multidimensional scaling and principal component analyses) were applied to explore the existence of openness and biota cluster, and multiple linear regressions were used to estimate the significance of variables within these clusters for the variability of NIS occurrences among countries. The results showed superior statistical properties when using the log of NIS/km2 as dependent variable over the other two NIS measurements. Interesting similarities and differences among mainland and island nations then emerged; the same openness and biota variables gave the best statistical fit to models of both mainland and island nations, but to different degrees. Whereas openness variables explained most of the dependent variable for island nations, biota variables were more important for mainland nations. These results give support to the current focus on policies for mitigating trade related spread of NIS, such as requirements of cleaning of ballast water in vessels (IMO, 2010). The results also indicate that policies improving biota and habitat conditions, such as the creation of barriers for the spread of NIS, may be of equal or more importance for mainland nations.
However, although much of the results seem plausible in a theoretical perspective and support earlier studies, they need to be interpreted with much caution. One important reason is the lack of time perspective on the introduction of the NIS, since the ISSG database lists all detected species irrespective of their time of entrance into the nation. Current patterns of trade and economic activities among nations may not explain total stock of NIS unless these patterns are quite stable over time. Another reason for careful interpretation of results is the limited coverage of NIS in different taxonomic groups. The ISSG data sources cover only a fraction of all NIS in the nations, and the results in this study are then affected if an enlargement of NIS implies relative changes in occurrences of NIS among nations. Nevertheless, the results indicate that both openness and habitat hypotheses are applicable, and that these variables may affect NIS occurrences in continental and island nations differently.
Appendix
Probability density functions of response NIS variables, with primary variables in the left column, and log-transformed variables in the right column.

Subset regressor identification via Mallows’ Cp – minimum Cp is preferred. Standardised regression coefficients are given for the LogInvarea response