Implications
Leg fragility cause economic losses in the poultry industry. This study was the first to identify quantitative trait loci (QTL) associated with Calcium (Ca) content and Calcium:Phosphorus (Ca:P) ratio in chicken. In addition, we found significant interaction between QTL and sex for some traits such as Ca, Ca:P ratio, tibia weight and ash percent, which were reported for the first time in Gallus gallus. Several novel candidate genes were identified for bone traits near to the QTLs herein mapped, which highlights the importance of the findings. These genes can be explored in future studies to identify causal mutations and thus contribute to the knowledge of the genetic architecture of bone quality traits in broilers as well as for marker-assisted selection and improvement of bone integrity.
Introduction
Factors such as the bone mineral density (BMD), bone turnover, bone microarchitecture, bone geometry and material properties of bone, are associated with bone strength (Friedman, Reference Friedman2006). Some of these factors depend on the mineral contents (MC) in the bones, especially calcium (Ca) and phosphorus (P). Onyango et al. (Reference Onyango, Hester, Stroshine and Adeola2003) reported effects of dietary levels of Ca and P on bone mineral contents (BMC) and BMD in broilers, whereas Rama-Rao et al. (Reference Rama-Rao, Raju, Reddy and Pavani2006) reported effects of these minerals on tibia breaking strength and leg abnormality score in broilers. These results reveal the vital role of mineral supplementation in preventing the risk of fractures or leg deformities in broilers. However, genetic factors can also affect bone quality traits (González-Cerón et al., Reference González-Cerón, Rekaya and Aggrey2015).
The QTL mapping studies can identify genomic regions that explain the variation in bone traits. That information can be used in selection schemes to improve bone traits such as weight, size and strength of bones, without the necessity to measure these phenotypes in large scale. Previous studies have mapped QTL for some bone traits in chicken. Dunn et al. (Reference Dunn, Fleming, McCormack, Morrice, Burt, Preisinger and Whitehead2007) found a significant QTL in chromosome 1 (GGA1) associated with tibiotarsal and humeral breaking strength. Similarly, Zhang et al. (Reference Zhang, Zhang, Wang, Liu, Zhang, Tang and Li2010) detected a QTL on GGA1, between the microsatellites MCW200 to MCW0036, associated with femur weight, besides other QTLs near to ADL328 associated with length and perimeter of the metatarsus. Ankra-Badu et al. (Reference Ankra-Badu, Bihan-Duval, Mignon-Grasteau, Pitel, Beaumont, Duclos, Simon, Carre, Porter, Vignal, Cogburn and Aggrey2010a) reported QTL at 9th week for both (a) shank length in the GGA1, 4 and 26, and (b) shank diameter in the GGA4 and 26. Gao et al. (Reference Gao, Du, Feng, Deng, Li, Da and Hu2010) reported several QTLs (GGA1, 2, 3, 4, 5, 7, 9 and 23) for shank length and shank growth at different developmental stages. Johnsson et al. (Reference Johnsson, Rubin, Höglund, Sahlqvist, Jonsson, Kerje, Ekwall, Kämpe, Andersson, Jensen and Wright2014) identified 40 QTLs, in several chromosomes, affecting bone deposition traits measured by peripheral quantitative computerized tomography of the femur. Ragognetti et al. (Reference Ragognetti, Stafuzza, Silva, Chud, Grupioni, Cruz, Peixoto, Nones, Ledur and Munari2015) reported QTLs for length, width and weight of tibia bone (GGA1, 2, 3, 4, 6, 13 and 24). Although many QTLs affecting bone size (Ragognetti et al., Reference Ragognetti, Stafuzza, Silva, Chud, Grupioni, Cruz, Peixoto, Nones, Ledur and Munari2015) and bone strength (Dunn et al., Reference Dunn, Fleming, McCormack, Morrice, Burt, Preisinger and Whitehead2007) have been reported for broilers, effects of QTL × sex interaction on bone traits in Gallus gallus remain unknown. Several gender differences for bone deformities such as osteoporosis has been reported (Friedman, Reference Friedman2006), which showed the potential effect of the QTL × sex interaction.
In addition, QTLs with effects on specific BMC such as Ca, P, Magnesium (Mg) and Zinc (Zn) remain also unknown in G. gallus. These traits showed high heritability and high correlation with other bone quality traits. Bone mineral density of tibia bone in broilers has a high correlation with Ca (0.91), P (0.91) and ash (0.93) contents in tibia (Onyango et al., Reference Onyango, Hester, Stroshine and Adeola2003). High genetic correlation between breaking strength and Ca (0.97), dry matter (0.97), Mg (0.97), P (0.95) and Zn (0.95) contents in femur of broilers have been reported (Grupioni et al., Reference Grupioni, Cruz, Stafuzza, Freitas, Ramos, Savegnago, Peixoto, Ledur and Munari2015). Higher heritability for P (0.38), Ca (0.37), Mg (0.37) and Zn (0.34) compared to femur breaking strength (0.30) were also reported by Grupioni et al. (Reference Grupioni, Cruz, Stafuzza, Freitas, Ramos, Savegnago, Peixoto, Ledur and Munari2015). Thus, this study aimed to map QTL for morphometric and mineral composition traits of the tibia in an F2 broiler × layer cross, including the investigation of QTL by sex interaction effects.
Material and methods
Experimental population
The Embrapa Swine and Poultry National Research Center developed a broiler × layer cross to form an F2 population, using line-cross model design following Haley and Knott (Reference Haley and Knott1992), also described by Nones et al. (Reference Nones, Ledur, Ruy, Baron, Moura and Coutinho2005) and Ambo et al. (Reference Ambo, Campos, Moura, Boschiero, Rosário, Ledur, Nones and Coutinho2008) previously. In the present study, 478 chickens from seven Dam-families or three Sire-families were used. The distribution of animals per Dam-family was as follows: Dam-1 had (72), Dam-2 (63), Dam-3 (53), Dam-4 (67), Dam-5 (74), Dam-6 (72) and Dam-7 (77) progenies. The sire-family distribution was as follows: Sire-1 (144), Sire-2 (209) and Sire-3 (125) progenies.
The F2 population was kept in collective boxes up to 35 days of age. From 35 to 41 days of age, chickens were housed in individual cages to evaluate performance. For pedigree control, each animal received a metal ring with numerical identification. The animals received initial feeding (1 to 21 days) with 21% CP and 3150 kcal metabolic energy, growth feeding (22 to 35 days) with 20% CP and 3200 kcal metabolic energy, and final feeding (35 to 41 days) with 18.5% CP and 3200 kcal metabolic energy.
Phenotypes
The chickens were weighed and slaughtered at 42 days of age. Before slaughtering, they were kept for 6-h fasting, and their bone traits were further determined. The tibia of the F2 population was collected and stored at −20°C. Bone traits were measured after manual removal of excess of meat, fat and cartilage. For measuring the physical parameters of tibia bone (weight, length and diameter), the tibias were conditioned at temperatures in the range of 6°C to 10°C, for 24 h. The length was the distance between the borders and diameter was measured from the midpoint of the bone.
Dry matter percentage (DM%) and ash percentage (Ash%) were determined by the gravimetric method according to the 012/IR method (Instituto Adolfo Lutz (IAL), 1985), and 018/IV method (IAL, 1985), respectively. Ash% determination was carried out with bone fragments left after the dry matter. The Ca, Zn, Mg and P contents were determined by atomic absorption spectrophotometry in equipment SpectrAA 220 (Varian Inc., Palo Alto, California, USA) following the manufacturer’s guide. Determination of P content was performed by UV spectrophotometry according to AOAC method 958.01 (AOAC, 1995) in equipment Varian Cary® 50 (Varian Inc., Palo Alto, California, USA) following the manufacturer’s guide.
Genotyping and linkage map
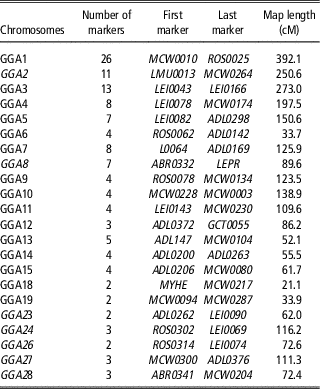
Blood samples of the 478 chickens were collected for genomic DNA extraction and genotyping. The animals were genotyped for 128 microsatellite markers (Table 1) and one SNP (single nucleotide polymorphism). Mega BACE sequencer (GE Healthcare®, Chicago, Illinois, USA) was used for allele size determination. The internal molecular size standard ETROX400 (GE Healthcare®, Chicago, Illinois, USA) and the Genetic Profiler software (GE Healthcare®, Chicago, Illinois, USA) were employed for all genotyping. More details about the PCR conditions for marker amplification can be found in Nones et al. (Reference Nones, Ledur, Ruy, Baron, Moura and Coutinho2005). The SNP was a C/T change in the intron 8 (rs80736809) of the Leptin receptor gene (LEPR), previously mapped to GGA8 (Dunn et al., Reference Dunn, Boswell, Friedman-Einat, Eshdat, Burt and Paton2000). The CRIMAP version 2.4 (Green et al., Reference Green, Falls and Crooks1990) was used to construct the linkage map and the total map length was 2630 cM, corresponding to ~63% of the chicken genome (Schmid et al., Reference Schmid, Nanda, Hoehn, Schartl, Haaf, Buerstedde, Arakawa, Caldwell, Weigend, Burt, Smith, Griffin, Masabanda, Groenen, Croijmans, Vignal, Fillon, Morisson, Pitel, Vignoles, Garrigues, Gellin, Rodionov, Galkina, Lukina, Ben-ari, Blum, Hillel, Twito, Lavi, David, Feldman, Delany, Conley, Fowler, Hedges, Godbout, Katyal, Smith, Hudson, Sinclair and Mizuno2005). For more details about map construction, see Nones et al. (Reference Nones, Ledur, Ruy, Baron, Moura and Coutinho2005) and Ambo et al. (Reference Ambo, Campos, Moura, Boschiero, Rosário, Ledur, Nones and Coutinho2008). The linkage map used in the present study can be viewed in Table 1.
Linkage map of the Embrapa F2 chicken resource population

Quantitative trait loci mapping analysis
Before QTL mapping analysis, a linear mixed model was adjusted to access the ANOVA assumptions (normality and independence of residuals, and homogeneity of variances). In addition, the fixed effects of sex and hatch were tested using the mixed procedure of statistical analysis system (Statistical Analysis System, 2011), with a significance level of 5%.
The QTL mapping was performed according to Perez-Enciso and Misztal (Reference Perez-Enciso and Misztal2004). The F2 population was originated from two base populations: broiler (A) and layer (B), with genetic effects normally distributed
 $g_{A} \!\sim\!N\left( {\mu _{A} ,\sigma _{A}^{2} } \right)$
and
 $g_{B} \!\sim\!N(\mu _{B} ,\sigma _{B}^{2} )$
, respectively, which was analyzed with the following general model:
 $$y{\equals}X\beta {\plus}Z\alpha {\plus}\mathop \sum\nolimits_{k{\equals}o}^{Nq} Z\delta _{k} {\plus}{\varepsilon}$$
where
 $y$
is the vector containing the trait records,
 $\beta $
the vector of fixed effects,
 $\alpha $
the vector of random polygenic effect,
 $\delta _{k} $
the vector of the fixed QTL effects for any Nq QTLs, X and Z the incidence matrices relating observations in
 $y$
to the parameters in the vectors
 $\beta $
,
 $\alpha $
and
 $\delta $
, whereas
 ${\varepsilon}$
the vector of the random residual term. A detailed description of distributions of genetic effects (
 $g_{A} $
and
 $g_{B} $
) can be found in Perez-Enciso and Misztal (Reference Perez-Enciso and Misztal2004). The model included the fixed effects of sex, hatch and the covariate BW at 42 days. Moreover, the additive and dominance effects of the QTLs were estimated. To evaluate the existence of QTL×sex interactions two models were used: (1) a reduced model that did not include the effects of QTLs and (2) a complete model in which the effect of the QTL was estimated for each sex separately.
The significance level to declare a QTL was obtained using the method proposed by Kruglyak and Lander (Reference Kruglyak and Lander1995) as follows:
 $$\mu \left( T \right){\equals}\left[ {C{\plus}2\rho GT^{2} } \right]\alpha (T)$$
wherein μ(T) is set at 1, 0.05 or 0.01, for the suggestive, highly significant and significant effects, respectively, G=42 (size in Morgan of the G. gallus genome) (Schmid et al., Reference Schmid, Nanda, Hoehn, Schartl, Haaf, Buerstedde, Arakawa, Caldwell, Weigend, Burt, Smith, Griffin, Masabanda, Groenen, Croijmans, Vignal, Fillon, Morisson, Pitel, Vignoles, Garrigues, Gellin, Rodionov, Galkina, Lukina, Ben-ari, Blum, Hillel, Twito, Lavi, David, Feldman, Delany, Conley, Fowler, Hedges, Godbout, Katyal, Smith, Hudson, Sinclair and Mizuno2005), C=39 (number of chromosomes in the G. gallus genome), ρ is equal to 1.0 for the models with only additive effect and 1.5 for models with additive and dominance effects, and T was found to be 1.96. Subsequently, for the additive model the significance levels to declare QTL were as follows:
 ${\rm }\alpha \left( T \right){\equals}2.76{\times}10^{{{\minus}3}} $
(suggestive),
 $\alpha \left( T \right){\equals}1.38{\times}10^{{{\minus}4}} $
(significant at 5% genome-wide) and
 $\alpha \left( T \right){\equals}2.76{\times}10^{{{\minus}5}} $
(significant at 1% genome-wide); whereas for additive + dominance models the values were
 $\alpha \left( T \right){\equals}1.91{\times}10^{{{\minus}3}} $
,
 $\alpha \left( T \right){\equals}9.56{\times}10^{{{\minus}5}} $
and
 $\alpha \left( T \right){\equals}1.91{\times}10^{{{\minus}5}} $
, respectively.
The confidence interval for the QTL position was obtained as described by Mangin et al. (Reference Mangin, Goffinet and Rebaï1994), whereas the variance explained by the QTL were estimated according to Sorensen et al. (Reference Sorensen, Kröber, Unte, Huijser, Dekker and Saedler2003), using
 $PV_{{{\rm exp}{\rm .}}} {\equals}2p_{Q} \left( {1{\minus}p_{Q} } \right)a^{2} $
, where p
Q
is the frequency of allele Q of the QTL, for which we assume the value 0.5, while (a) is the estimate of the additive effect of the QTL at position that has been mapped. Thus, the total variance explained by the QTL is as follows:
 $${\rm \,\%\,}PV_{{{\rm exp}{\rm .}}} {\equals}\left( {{{VP_{{{\rm exp}}} } \over {VP_{{{\rm total}}} }}} \right){\times}100$$
where, PV exp. is the phenotypic variance explained by the QTL and PV total is the total phenotypic variance in the model that includes the QTL.
Candidate gene search
An approximation of the linkage map in centimorgans, with the genome map in megabase pairs, was done using the Chicken Quantitative Trait Locus Database (https://www.animalgenome.org/cgibin/QTLdb/GG/index). The search for annotated genes and previously reported QTLs were performed using the Map Viewer tool (https://www.ncbi.nlm.nih.gov/mapview/mapsearch.cgi?taxid=9031) for the G. gallus genome (Gallus gallus Annotation Release 102). Enrichment analysis were carried out using the DAVID tool (https://david.ncifcrf.gov/summary.jsp) to identify significant biological pathways (P<0.05).
Results
Sex effect
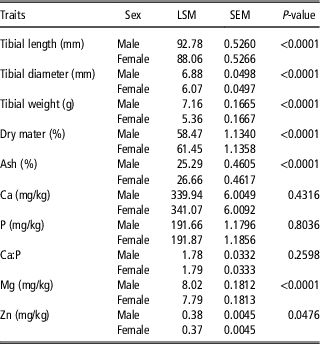
For each gender, the least square means estimated for weight, length, diameter and chemical composition traits of the tibia are listed in Table 2. The sex effect was not significant for Ca, P and Ca:P ratio, being the mean values in males 339.94, 191.66 and 1.78 mg/kg, respectively, whereas in females these values were 341.07, 191.87 and 1.79 mg/kg, respectively. On the other hand, the sex effect was significant for Mg, Zn, DM%, ash%, length, diameter and weight of tibia, with mean values of 8.02 mg/kg, 0.38 mg/kg, 58.47%, 25.29%, 92.78 mm, 6.88 mm and 7.16 g, respectively, in males, whereas the females showed 7.79 mg/kg (Mg), 0.37 mg/kg (Zn), 61.45% (DM%), 26.66% (ash%), 88.06 mm (length), 6.07 mm (diameter) and 5.36 g (weight) of tibia.
Least square mean (LSM), SEM and P-value of F-test for sex effect in an F2 broiler × layer cross

Quantitative trait loci mapping analysis
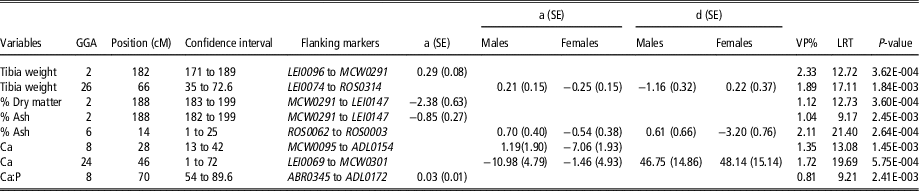
The QTL mapping study found eight suggestive QTLs (Table 3). Two for Ca, first being at 28 cM of GGA8 flanked by the microsatellites MCW0095 and ADL0154, and another at 46 cM of GGA24 between the microsatellites LEI0069 and MCW0301. Considering the standard error of estimates, the QTL on GGA8 seems to have an additive effect only on females Ca content, whereas it appears that the QTL on GGA24 shows the additive effect only on Ca content in males. On the other hand, one suggestive QTL mapped for Ca:P ratio at 70 cM of GGA8, between markers ABR0345 and ADL0172, showed similar effect for both males and females.
Additive and dominance effect of quantitative trait loci for tibia bone traits in an F2 broiler × layer cross

GGA=chromosome; a (SE)=additive effect (standard error); d (SE)=dominance effect (standard error); VP%=variance explained by the quantitative trait loci; LRT=likelihood ratio test; P-value = probability of LRT.
We found two suggestive QTLs for ash%, the first at 188 cM of GGA2 flanked by MCW0291 and LEI0147, and the second at 14 cM of GGA6 between the ROS0062 and ROS0003. The QTL on GGA2 had similar effect for both males and females, whereas the QTL on GGA6 had a specific additive outcome for each sex. The position 188 cM of GGA2 also had a QTL with additive effect for DM%, showing similar effect for both males and females.
For tibia weight, two suggestive QTLs were mapped: one at 182 cM of GGA2 between markers LEI0096 and MCW0291, and another at 66 cM of GGA26, flanked by markers LEI0074 and ROS0314. The QTL on GGA2 had a single additive effect on tibia weight in both males and females. On the other hand, the QTL on GGA26 affecting tibia weight had a specific additive effect on each sex. Mg, Zn, tibia length and tibia diameter did not show any suggestive or significant QTL effects.
Discussion
The tibia morphometric and mineral composition traits analyzed here exhibited low variation, given by the low standard errors of the means in both males and females (Table 2). In addition, all traits showed low genetic variability estimates (heritability <0.2), probably as a consequence of the small sample (478 birds) and a reduced number of sire families. These factors make it difficult mapping significant QTL because only a small percentage of phenotypic variance is due to variation in additive genetic effects. Despite the low h 2, some interesting suggestive QTLs were mapped for weight, dry matter, ash%, Ca content and Ca:P ratio of the tibia (Table 3).
Sex effect
The sex effect was significant for many traits (Table 2), except Ca, P and Ca:P ratio. Previous studies have also reported a substantial sex effect on tibia traits in G. gallus. Han et al. (Reference Han, Qu, Wang, Chen, Yan, Zhang, Hu, You and Cheng2015) found a significant sex effect (P=0.036) for tibia weight and tibia diameter with mean values of 4.69±0.40 g and 0.75±0.08 cm (for males), respectively, and 3.97±0.47 g and 0.68±0.03 cm (for females), respectively, having a P-value of 0.017. However, they did not find sex effect (P=0.713) for tibia length, with mean values of 9.46±0.20 cm for males and 8.98±0.10 cm for females. Significant sex effect in the present study raised the hypothesis of sex-dimorphic QTL. Earlier studies with chicken have reported an interaction between QTL and sex. Abasht et al. (Reference Abasht, Pitel, Lagarrigue, Bihan-Duval, Roy, Demeure, Vignoles, Simon, Cogburn, Aggrey, Vignal and Douaire2006) found a significant QTL in males at 80 cM of GGA5 and a suggestive QTL in females at 116 cM for abdominal fat. Ankra-Badu et al. (Reference Ankra-Badu, Shriner, Bihan-Duval, Mignon-Grasteau, Pitel, Beaumont, Duclos, Simon, Porter, Vignal, Cogburn, Allison, Yi and Aggrey2010b) also found several female-specific and sex-antagonistic QTL affecting Pectoralis major and minor yield, respectively. Thus, the sex × QTL interaction in chicken seems usual and may be occurring in the tibia traits as well.
Quantitative trait loci mapping for tibia traits
The suggestive QTL mapped for Ca, at 28 cM of GGA8, had only additive effect, but the effect varied according to sex (Table 3). In males, the estimate of the standard error is greater than the additive effect itself, indicating the absence of effect in this group. Therefore, this suggestive effect seems to affect Ca content only in females. The earlier study of Podisi et al. (Reference Podisi, Knott, Dunn, Burt and Hocking2012) reported suggestive QTL affecting tibia BMD at 15 cM of GGA8, flanked by the markers MCW0305 to ADL0258, which reinforces the hypothesis of association of QTL with the bone traits in the GGA8. Another genome region affecting Ca is at 46 cM of GGA24, but in this case, it seems to influence Ca content only in males, because the additive effect on Ca in females had a high standard error. These results raise the hypothesis that genetic control of Ca deposition in the tibia of G. gallus depends on different genes of males and females, probably related to hormonal differences between sexes. The negative additive values for these suggestive QTLs indicate that the allele associated with the high Ca deposition has its origin from the layer line. This can be due to the need of laying hen lines to more frequently mobilize calcium from the medullary bone for the formation of eggshell (Whitehead, Reference Whitehead2004) than the broiler lines. Guo et al. (Reference Guo, Sun, Qu, Shen, Dou, Ma, Wang and Yang2017) reported two SNPs on GGA24 associated with the breaking strength of the tibia at the genome-wide level, indicating that this trait mostly depends on Ca bone composition.
Other QTLs for similar phenotypes (drumstick weight, tibia width, tibia strength, tibia plateau angle and tibia weight) were reported for the same region of GGA8 (MapViewer, NCBI; Supplementary Material S1). Likewise in our studies, QTLs for phenotypes with similar traits such as feet weight, femur bending strength, thigh meat-to-bone ratio, drumstick meat-to-bone ratio, drumstick bone weight, shank length and thigh bone weight (MapViewer, NCBI; Supplementary Material S1) were reported for the region of GGA24. For both Ca QTLs reported herein, overlap with other QTLs for leg-bones phenotypes was observed. Thus, the results are in accordance with other studies and are probably indicating the same set of genes since bone phenotypes are directly influenced by the quantity of Ca (Palacios, Reference Palacios2006).
Enrichment analysis, performed with genes located in both Ca QTLs regions (GGA8 and GGA24), revealed two biological pathways: cartilage development and connective tissue development. Both have the same genes interacting: ACVR2B, NOTCH2, PAPPA2, RNF2 and WNT9A. These genes are candidates for further investigation since they have a role described in a pathway related to the trait. The metabolic pathways are also in accordance with the phenotype studied since the development of cartilage and connective tissue are influenced by Ca content (Palacios, Reference Palacios2006).
The suggestive QTL mapped to the Ca:P ratio on GGA8 had only additive effect, with common value for both males and females. The positive value of this effect indicated that the allele of the broiler line was associated with higher values for this trait. This suggestive QTL seems to be different from the one mapped to the Ca QTL at 28 cM of GGA8, since the confidence intervals are not overlapping. Moreover, we tested the hypothesis of pleiotropic QTL for Ca and Ca:P and no significant effect was found. Thus, it seems that two regions in the GGA8 are affecting mineral deposition in the tibia. Within this second region of GGA8, other QTLs for similar traits: tibia marrow diameter, tibia weight, tibia plateau angle, tibia strength, crooked digits, tibia width and femur torsional strength (MapViewer, NCBI; Supplementary Material S1) were mapped. Moreover, Schreiweis et al. (Reference Schreiweis, Hester and Moody2005) found two suggestive QTLs on GGA8 for tibia width at 35 weeks of age, the first at 16 cM between markers ADL0258 and MCW0095, and the second at 68 cM between markers ABR0345 and ADL0301; whereas Podisi et al. (Reference Podisi, Knott, Dunn, Burt and Hocking2012) reported a suggestive QTL at 27 cM of GGA8, flanked by markers ADL0179 to MCW0095, for tibia BMD measured at 72 weeks of age.
Two suggestive QTLs mapped for ash% and DM% on GGA2 at 188 cM had additive effect, with common value for both sexes. Their negative value indicates that the alleles in the layer line are associated with higher values of ash% and DM%. In this same region of GGA2, second suggestive QTL was mapped with effect on tibia weight. The positive value, in this case, implies that the broiler line had the alleles for increased tibia weight. There may be a pleiotropic QTL on this region, which would have alleles in the layer line to increase the DM% and Ash%, and alleles in the broiler line for increasing tibial weight. A previous study with the same F2 population (Ragognetti et al., Reference Ragognetti, Stafuzza, Silva, Chud, Grupioni, Cruz, Peixoto, Nones, Ledur and Munari2015) reported QTL for tibia weight at 168 cM of GGA2, flanked by the markers ADL0373-LEI0096. Likewise, in the same F2 population, Ambo et al. (Reference Ambo, Moura, Ledur, Pinto, Baron, Ruy, Nones, Campos, Boschiero, Burt and Coutinho2009) identified QTL for BW at 35 and 41 days of age at 200 and 205 cM of GGA2, respectively. Thus, there seems to be a pleiotropic QTL on GGA2 affecting many traits in G. gallus. Previous studies in chicken also reported QTL effect in this region of GGA2 for bone traits. Podisi et al. (Reference Podisi, Knott, Dunn, Burt and Hocking2012) found a QTL at 297 cM of GGA2, affecting tibia BMD assessed in chickens with 72 weeks of age, whereas Fornari et al. (Reference Fornari, Zanella, Ibelli, Fernandes, Cantão, Thomaz-Soccol, Ledur and Peixoto2014) studied SNPs in the OPG gene and found association between the SNP g.9144C>G and tibia weight. This gene is located on the GGA2 and can be the potential QTL affecting the traits in the present study. However, the confidence interval in the current study is very large and other QTLs for bone traits (shank weight percentage, drumstick and thigh percentage; Map Viewer, NCBI; Supplementary Material S1) were also reported for the same region in GGA2. Enrichment analysis, carried out with genes located in the region of both ash percentage QTLs, showed three biological pathways: cartilage development, connective tissue development and skeletal system development related to the phenotype. Mainly three genes appeared in those pathways: EDN1, GCM2 and TFAP2A.
Another suggestive QTL with additive and dominance effects on ash% was found at 14 cM of GGA6. The estimates of additive effect on Ash% were similar in both males and females, whereas the dominance effect was found only for ash% in females due to the high standard error of this effect in males. The positive additive effect in males and the negative value for females signifies that the broiler line and the layer line are allied-up with high values for ash% in these sexes, respectively. Mignon-Grasteau et al. (Reference Mignon-Grasteau, Chantry-Darmon, Boscher, Sellier, Chabault-Dhuit, Bihan-Duval and Narcy2016) reported QTL effect for Tibia Ash% in the 0.330 Morgan of GGA6, flanked by markers Gga_rs10732029 and GGaluGA298536, which is vital evidence of QTL for ash% in this chromosome. In addition, a candidate gene, BMPR1A, is near the QTL of GGA6, which seems to have a crucial role in the overall growth and formation of bones in humans (Jin et al., Reference Jin, Jing, Ye, Liu, Harris, Hinton and Feng2017) as well as articular cartilage in pigs (Adapala and Kim, Reference Adapala and Kim2017).
Two suggestive QTLs have been mapped to the tibia weight. The first was mapped in GGA2 at 182 cM (discussed previously), whereas the second suggestive QTL was mapped at 66 cM of GGA26. Ragognetti et al. (Reference Ragognetti, Stafuzza, Silva, Chud, Grupioni, Cruz, Peixoto, Nones, Ledur and Munari2015) did not observed the sex-specific effect on GGA26, as they did not test models with this effect. Perhaps the suggestive QTL mapped on GGA26 is not of great importance for selection purposes, because the additive effects had a high standard error, but there was an eminent dominance effect on tibia weight in males. However, other QTLs for bone traits such as shank weight percentage and drumstick and thigh percentage for GGA2, and tibia BMD and shank weight for GGA26 (MapViewer, NCBI; Supplementary Material S1) were reported. Enrichment analysis suggested interesting biological pathways that might be related to bone development such as forelimb morphogenesis (RECK, SALL3, WNT2B), inorganic cation transmembrane transporter activity (ATP5F1, ATP2B4, MRS2, ITPR3, KCND3, KCNG2, SLC12A7, SLC9A3), metal ion transmembrane transporter activity (ATP2B4, MRS2, ITPR3, KCND3, KCNG2, SLC12A7, SLC9A3), and potassium ion transmembrane transporter activity (KCND3, KCNG2, SLC12A7, SLC9A3). The indication of pathways related to bone growth and mineral transportation in poultry reveals that QTLs have an appropriate biological explanation for association with bone weight. Moreover, two biological pathways related to mitochondrial activity were signalized: (a) mitochondrial inner membrane (ATP5F1, MRS2, C26H6ORF125, CSDE1, MCUR1, and SIRT5) and (b) mitochondrial membrane (same genes of the previous pathway plus RNF144B). The pathways were in close agreement with the results, declaring the contribution of an organelle in the growth and development of bones in chickens (Kerschnitzki et al., Reference Kerschnitzki, Akiva, Shoham, Asscher, Wagermaier, Fratzl, Addadi and Weiner2016).
In conclusion, we mapped eight novel potential QTLs for tibia weight, DM%, ash%, Ca and Ca:P ratio, which elucidated between 0.81% and 2.33% of the phenotypic variance. The overlap with other QTLs for similar phenotypes in poultry and the characterization of vital metabolic pathways related to the evaluated traits sustained the results obtained. The regions identified may be used for comparison with other studies, and refinement may be done using genome-wide association to enhance our knowledge regarding the physiology behind the expression of the traits to further potentially improve the genetic evaluation. Our study also showed the importance of adjusting the interaction between QTL × sex in QTL mapping analysis for bone traits, since some of the effects found on bone contents depends on the gender.
Acknowledgments
This work was supported by project 02.10.06.003.00 from the Brazilian Agricultural Research Corporation (EMBRAPA). The Embrapa F2 Chicken Resource Population was subsidized by a PRODETAB/EMBRAPA grant # 038038-01/01 from the Brazilian Government. J.A.P.M. received a PIBIC scholarship from CNPq, and L.F.B.P., L.L.C., V.B.P. and M.C.L. received productivity fellowship from CNPq. This study was financed in part by the Coordenação de Aperfeiçoamento de Pessoal de Nível Superior – Brasil (CAPES) – Finance Code 001.
Declaration of interest
There is no conflicts of interest in this article.
Ethics statement
This study was performed with the approval of the Embrapa Swine and Poultry Ethical Committee for Animal Use (CEUA) under protocol number 011/2011.
Software and data repository resources
The data or models are not deposited in an official repository.
Supplementary material
To view supplementary material for this article, please visit https://doi.org/10.1017/S175173111800335X