1. INTRODUCTION
Urbanization has generally been conceptualized as a process driven by the migration of poor peasants into cities in search of economic opportunities generated by structural economic change. This basic model has been augmented and nuanced somewhat over the last several decades, but the prevailing view has been that urbanization is fundamentally driven by the location decisions of individuals influenced by economic conditions. It is a simple, intuitive model, but it is only partly correct.
This became apparent in the 1980s and 1990s as economies across sub-Saharan Africa stagnated but urban population growth and urbanization persisted. In recent years, attempts to explain this apparently mysterious phenomenon of ‘urbanization without growth’ have changed the way the process is understood.
Importantly, the traditional economic models of urbanization are now being augmented with historical demographic perspectives. A key weakness of strictly economic models has been the omission of explicit attention to demographic fundamentals and context—i.e. birth and death rates and how these evolved in response to technological and institutional changes in the 20th century. Once these are taken into account, the stylized facts of Africa's urban transition cease to be mysterious.
But there is still much to be learned about the precise mechanics of urban population change in Africa. A dearth of reliable, comparable demographic and economic data has impeded efforts to account for the relative contribution of urban natural increase, migration, and reclassification (including rural transformation). This is due in part to conceptual ambiguity with regard to what constitutes an ‘urban’ area, and in part due to limited resources and capacity to collect data. Fortunately, a renewed interest in understanding urban population trends in Africa (and globally) has inspired the development of new datasets that exploit multiple sources, including satellite imagery. These, combined with accumulated information from more traditional survey sources, offer the promise of new insights into the dynamics of urban population change across the continent, which will help to address important knowledge gaps.
Filling these knowledge gaps is not just of scholarly interest—it is also crucial for developing evidence-based policy. From the late 1970s through the 1990s, ill-conceived population policies built on flawed assumptions failed to achieve desired results and may even have contributed to deteriorating conditions in African towns and cities. Armed with better models and better data, there is great potential to develop better policies to harness the economic potential of Africa's urban transition in the 21st century.
2. CONCEPTS, DATA, AND DEFINITIONS
Measuring and analyzing urban population trends in Africa is complicated by the fact that there is no universal definition of what constitutes an ‘urban’ settlement [Lucas (Reference Lucas, Rosenzweig and Stark1997); Montgomery et al. (Reference Montgomery, Stren, Cohen and Reed2003); Bloom et al. (Reference Bloom, Canning, Fink, Khanna, Salyer, Beall, Huha-Khasnobis and Kanbur2010)]. The range of definitions used by national statistical agencies to monitor population change reflects various demographic, physical, socioeconomic, and political understandings of urbanism. For example, many countries use a simple population size threshold for classifying a settlement as urban, although these vary widely: In Angola, a settlement of more than 2,000 people would be classed as urban, whereas Nigeria's minimum threshold is 20,000. Other countries, such as Botswana and Côte d'Ivoire, incorporate a criterion related to the share of persons in nonagricultural employment, an approach which reflects a concept of urbanization that is intrinsically linked to structural economic change. In other cases, wholly subjective criteria are applied, such as ‘Places officially designated as urban’ in Zimbabwe. Moreover, there can be dramatic differences in living conditions in ‘urban’ settlements as access to basic infrastructure varies significantly across countries due to market failures and political economy dynamics [see Fox (Reference Fox2014); Collier (Reference Collier2017); Pariente (Reference Pariente2017)].
This underlying conceptual variation in settlement classification between countries, and sometimes even within countries over time (e.g. Rwanda between the 2002 and 2012 censuses), coupled with concerns about the integrity of underlying data, which often represents estimates based on very old or controversial census exercises, complicates rigorous empirical analysis of urban population trends in Africa. However, census data collection is improving, other household survey exercises have accumulated useful time series, and new approaches have emerged that exploit remote sensing (e.g. satellite imagery), ancillary data (e.g. noncensus household surveys), and advanced computational techniques. Examples include the Africapolis project, which has published population estimates for all urban agglomerations in West Africa containing 10,000 people or more between 1950 and 2010 [see Moriconi-Ebrard, Harre and Heinrigs (2016)] and the WorldPop project (www.worldpop.org.uk), which has published estimates of the total number of people per square kilometer for the entire continent of Africa in 2010. A key benefit of these latter geospatial datasets is that they present standardized population-based estimates of human settlements that permit more rigorous comparison across countries and regions, although the larger datasets are still temporally constrained. Nevertheless, as will be discussed below, they are already facilitating novel insights into Africa's urban transition.
A second conceptual issue that has led to confusion relates to the use of the term ‘urbanization’ itself and the difference between this and the related (but distinct) phenomena of urban growth and urban expansion. The term ‘urbanization’ is used here in a strictly demographic sense to denote an increase in the proportion of a population residing in urban areas. However, in both research and policy communities it is common for the term ‘urbanization’ to be used to describe variously the process of rural-urban migration, an increase in the sheer number of people living in cities, or the expansion of built up areas. From an analytical point of view, it is important to distinguish between changes in population ratios and changes in population size, and changes in the extent of physically built up areas. This is particularly true in Africa, where the rate of urban population growth—i.e. increase in the absolute number of people in urban areas—is truly unprecedented, whereas rates of urbanization have been robust but not exceptionally fast in many countries.
The conceptual conflation of urban growth with urbanization has real consequences: Failure to distinguish between the two has often led to the belief that migration rather than natural increase is the primary cause of mushrooming towns and cities. Consequently, policies aimed at reducing population pressure in urban areas have focused almost exclusively on discouraging migration, with little observable impact [Fox (Reference Fox2014)]. A more nuanced understanding of the underlying forces driving urban population growth and urbanization is necessary if we are to identify effective interventions to promote human development.
3. AFRICA'S URBAN TRANSITION IN HISTORICAL PERSPECTIVE
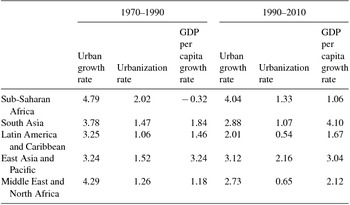
Sub-Saharan Africa's urban transition is characterized by two stylized facts illustrated in Table 1. First, urban populations in countries across the region have been growing at historically unprecedented rates since the 1960s. Second, the urban share of the region's population (i.e. level of urbanization) has grown persistently, even during periods of sustained economic stagnation (and in many countries contraction) in the 1980s and 1990s. This latter phenomenon, dubbed ‘urbanization without growth’ [Fay and Opal (Reference Fay and Opal2000)], has motivated researchers to revisit core assumptions about the factors that drive urban population change.
Urban growth, urbanization and GDP per capita growth by major world region, 1970–2010

Notes: Data are from World Development Indicators database online, accessed September 2016. All estimates are compound average annual growth rates.
Urbanization has traditionally been understood as an integral part of the process of economic development. Drawing on the historical experience of European countries, early development scholars modeled urbanization as a response to the growth of jobs in manufacturing and industry, which ‘pull’ people off of farms and into cities, thereby increasing the share of the total population living in urban areas [Lewis (Reference Lewis1954); Ranis and Fei (Reference Ranis and Fei1961)]. Simply put, urbanization was assumed to be a by-product of structural changes in labor markets associated with industrialization.
In an effort to understand how countries might urbanize without such structural change, Gollin, Jedwab and Vollrath (Reference Gollin, Jedwab and Vollrath2016) have built and empirically tested a model that focuses on the effects of income shocks rather than broad structural changes in production. They find that rising income is associated with urbanization, but there are large differences in the composition of employment between countries that rely heavily on natural resource exports for income and those that do not. Resource exporters tend to generate ‘consumption cities’ in which a large share of the workforce is engaged in nontradable services, while countries that do not rely on natural resource exports are more likely to have cities with workers employed in tradable services, manufacturing, and industry. This model helps to explain how urbanization can happen without broad-based industrialization—a pattern that fits with the experience of many resource-dependent African economies. However, this still cannot account for persistent urbanization in the face of stagnant or declining income observed in many countries across the region. Explaining this phenomenon demands a critical reconsideration of the underlying assumptions in standard economic models of urbanization.
While economic models emphasize the role that rural-urban wage gaps play in driving migration (and hence urbanization), it became clear as early as the 1950s that urban population growth in many developing countries seemed to be outpacing the growth of formal employment opportunities in urban areas [see Fox (Reference Fox2012)]. This led Haris and Todaro (Reference Harris and Todaro1970) to adjust the classic model to account for the inflated expectations of potential migrants and argued for migration control measures to boost aggregate welfare, which were widely adopted. However, further research revealed that people were being ‘pushed’ and ‘pulled’ into urban areas for a wide range of other reasons, such as rural poverty, population pressure, conflict, to escape discrimination or repression, to diversify household income streams, to meet potential husbands or wives, and even simply to find excitement and adventure [see Byerlee (Reference Byerlee1974); Mazumdar (Reference Mazumdar and Mills1987); Jamal and Weeks (Reference Jamal and Weeks1988); Becker and Morrison (Reference Becker, Morrison, Mafeje and Radwan1995); Lucas (Reference Lucas, Rosenzweig and Stark1997); Fay and Opal (Reference Fay and Opal2000); Barrios, Bertinelli and Strobl (Reference Barrios, Bertinelli and Strobl2006)].
This wide range of potential motives for migration reveals the inherent limitations of models that rely on wage differentials to account for population trends and helps to explain why these models have consistently failed to adequately fit the available data [see Mazumdar (Reference Mazumdar and Mills1987); Jamal and Weeks (Reference Jamal and Weeks1988); Weeks (Reference Weeks, Mafeje and Radwan1995); Becker and Morrison (Reference Becker, Morrison, Mafeje and Radwan1995); Fay and Opal (Reference Fay and Opal2000); Lall, Selod and Shalizi (Reference Lall, Selod and Shalizi2006); de Haas (Reference De Haas2010)]. While it is possible to build more complex models that incorporate the diverse range of motives behind population movements, this may not be the most fruitful line of enquiry for those seeking to understand urban population trends—especially given the associated measurement challenges. Indeed, an overemphasis on the role of migration in driving urbanization has tended to obscure other critical factors shaping urban population trends in Africa.
If we instead begin by assuming that there are always some people looking to relocate from rural to urban areas, and that the number of people so motivated consistently exceeds the number looking to move from urban to rural areas, we are left with a very different line of enquiry.Footnote 1
The traditional approach seeks to explain why urbanization happens. If we accept this idea of a ‘migration constant’—i.e. a base rate of drift from rural to urban areas—we are left instead with the question of why urbanization didn't happen sooner. Cities have existed for roughly 6,000 years, but it is only in the last few hundred years that the global proportion of people living in urban areas began to increase [Bairoch (Reference Bairoch1988); Dyson (Reference Dyson2011); Fox (Reference Fox2012); Jedwab and Vollrath (Reference Jedwab and Vollrath2015)]. What prevented urbanization from happening earlier? The answer provided by demographers and historians both confirms the validity of an assumed ‘migration constant’ and provides a useful framework for explaining the stylized facts of Africa's urban transition.
Prior to the industrial revolution large towns and cities were mostly ‘demographic sinks’: Death rates exceeded birth rates due to the scourges of disease and periodic famine. As a result, the very survival of cities depended on a steady flow of migrants to replenish urban populations, even when these migrants were likely to die young. However, by the middle of the 20th century cities had ceased to be so deadly thanks to improvements in disease control and food security [Bairoch (Reference Bairoch1988); Dyson (Reference Dyson2011); Fox (Reference Fox2012)].
In Europe, sustained mortality decline coincided with the onset of the industrial revolution. Improvements in medical knowledge and technology, investments in public infrastructure, and significant gains in both agricultural productivity and cost-effective transport all contributed to increased life expectancy at a time when manufacturing and industry flourished.
By contrast, sustained mortality decline across much of Africa in the latter half of the 20th century occurred largely independently of broad-based economic development. Accumulated medical knowledge and technologies (e.g. vaccines and antibiotics) were transferred in the late colonial and early postcolonial eras, which also witnessed a substantial increase in investments in public infrastructure, health services, and education [see Fox (Reference Fox2012)]. While some improvements in mortality were linked to rising income and productivity, many were not. As a result, morality decline became decoupled from broad-based economic development in the mid-20th century. This decoupling broke the previously observed empirical link between economic prosperity and urban population size by region [Jedwab and Vollrath (Reference Jedwab and Vollrath2015)] and lifted the upper boundary on city size. Prior to 1800, there were no human settlements with populations larger than 1.5 million; by 2014, there were an estimated 488 cities with 1 million or more inhabitants, and 28 of these had more than 10 million residents [United Nations (2015)].
Against this backdrop the phenomenon of ‘urbanization without growth’ in Africa no longer seems mysterious. The acute economic crises of the 1980s and 1990s were not generally accompanied by a reversal in mortality decline and so towns and cities continued to grow. Where mortality rates reversed trend and rose, there is some evidence that rates urbanization also slowed or went into reverse [Dyson (Reference Dyson2003); Fox (Reference Fox2012)]. The stylized facts of Africa's urban transition therefore fit the hypothesis that mortality decline is both a necessary and even sufficient condition for urbanization to occur. Where towns are able to reproduce themselves and grow through natural increase, migrants contribute to the steady march of urbanization; and with rural populations growing in response to mortality decline, the pool of potential migrants is expanding.
A growing body of research has shown that urban natural increase is in fact the majority component of urban growth in developing countries, and particularly in Africa [Preston (Reference Preston1979); Jedwab, Christiaensen and Gindelsky, (Reference Jedwab, Christiaensen and Gindelsky2014); United Nations (2015)]. In other words, even if there were no migration, towns and cities in Africa would continue to grow rapidly from within. This highlights the problem with the traditional assumption (particularly among policy makers) that migration is the primary source of demographic pressure in urban Africa: In most places, natural increase accounts for a greater share of urban growth than migration does.
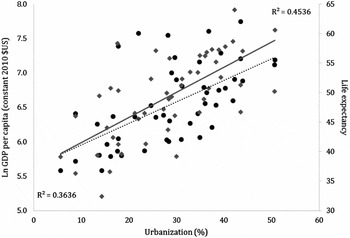
A useful illustration of the flawed assumptions underpinning standard thinking about urbanization is the ecological fallacy associated with the classic cross-sectional plot of income and urbanization. By way of example, Figure 1 provides two scatterplots overlaid on one another. The first is of GDP per capita and level of urbanization for the 10 largest countries in West Africa for the years 1970, 1980, 1990, 2000, and 2010 (left axis). The second is life expectancy and urbanization for the same countries and years (right axis). The sample of countries was chosen for convenience to facilitate comparison with data presented below.
Income, life expectancy and urbanization in West Africa, 1970–2010.

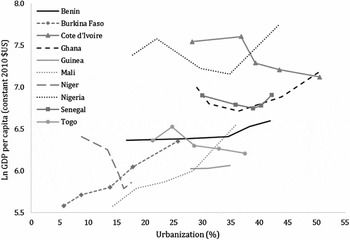
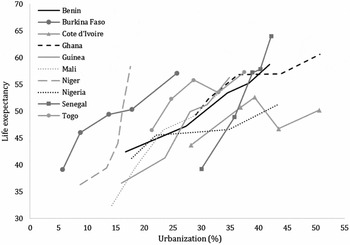
Both income and life expectancy are clearly positively and significantly correlated with urbanization in this cross-sectional plot. However, causality should not be assumed. This becomes clear in Figures 2 and 3, which provide time-path plots of the relationship between income and urbanization and life expectancy and urbanization. Each line proceeds through time from left to right, with the first data point for each line representing 1970 and the last representing 2010.
Time-path plot of income and urbanization in West Africa, 1970–2010.

Time-path plot of life expectancy and urbanization in West Africa, 1970–2010.

Figure 2 shows that the assumed causal correlation between income and urbanization does not hold at the individual country level: Six out of ten countries experienced protracted episodes of negative income growth with rising levels of urbanization. The correlation observed in the classic income-urbanization plot is more likely a reflection of historical processes rather than causality [see Easterlin (Reference Easterlin2013)].
Figure 3 shows a very different pattern. Here, the correlation between life expectancy and urbanization holds at the individual country level with just two brief exceptions: Cote d'Ivoire and Togo experienced declining life expectancy but increased levels of urbanization between 1990 and 2000. In the former, survey data from the Demographic and Health Programme (DHS) indicate that under-5 mortality rates rose in the 1990s in both rural and urban areas, but more quickly in rural areas. This might account for the persistent increase in the proportion of people living in urban areas, but more research is needed to explain these anomalies.
While clearly not definitive, these graphs are illustrative of the broader argument: Mortality decline (or increased life expectancy) is more convincingly associated with changes in urbanization than income growth. This is not to discount the significance of economic factors in shaping migration choices and the pace of urbanization in a country, but when viewed over the long run it is clear that demographic processes are more likely driving urbanization in Africa than economic ones.
4. NEW DATA, NEW INSIGHTS
Indeed, the tenuous correlation between income and urbanization has become even more apparent with the advent of geospatial population datasets that facilitate a standardized approach to estimating the size of urban populations across countries. For example, in a recent conference paper, Deuskar and Stewart (Reference Deuskar and Stewart2016) presented standardized estimates of urbanization for a large sample of countries based solely on the population size and density of human settlements drawing on two separate gridded population datasets. They find ‘no clear relationship between national GDP per capita and the proportion of a country's population that resides in settlements of ‘urban’-like size and density’ (ibid, 9). However, the authors caution against jumping to conclusions, as some would likely contest the validity of defining urban areas using their criteria. However, a similar finding emerges when the same exercise is run with the Africapolis data mentioned above.
The Africapolis project classifies a settlement as ‘urban’ if it contains a population of 10,000 or more, which is a fairly conservative threshold by global standards. Using this uniform approach to settlement classification, the Africapolis dataset contains decadal estimates of the number of urban settlements, the size of each settlement and the total urban and rural population for 17 countries in West Africa between 1950 and 2010. The simple pooled cross-sectional correlation between GDP per capita and urbanization using these population estimates is positive, but the R-squared is 0.189; yet the correlation between life expectancy and urbanization remains significantly higher with an R-squared of 0.438.
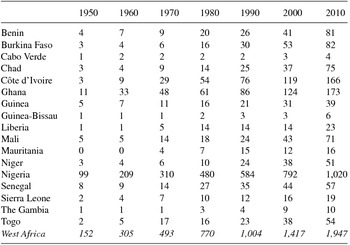
This dataset also illustrates the significance of a largely overlooked dynamic of urban population change: rural transformation. The traditional two-sector mode of thinking about urbanization obscures the fact that entirely new towns and cities are emerging across Africa. As Table 2 shows, the number of identifiably urban settlements in West Africa increased from just 157 in 1950 to 1,947 in 2010. Some are effectively satellite settlements in what are recognizable metropolitan regions centered around long-standing urban settlements, but many are not. For example, in Ghana the town of Akatsi in the Volta Region grew from an estimated population of just 1600 in 1960 to over 25,000 in 2010. Similarly, Agaie in Niger State, Nigeria had an estimated urban population of 0 in 1970 and over 33,000 in 2010. Both of these settlements are independent of any recognizable metropolitan region; in both cases an urban settlement has emerged in a previously rural landscape. While these changes would be captured statistically as instances of ‘reclassification,’ it is nevertheless useful to have some idea of the contribution of new settlement emergence to overall urban growth, as these have different political-institutional and economic needs than existing settlements experiencing further expansion. At present, there is no standard approach to monitoring emergent urban settlements.
Number of urban settlements by country in West Africa, 1950–2010

Source: Data are from Moriconi-Ebrard, Harre & Heinrigs (Reference Moriconi-Ebrard, Harre and Heinrigs2016).
New insights are also possible thanks to the accumulation of evidence from household surveys over the past few decades. While access to detailed census data remains a challenge in many African countries, there are now several decade's worth of high-quality surveys available from other sources, which offer scope to flesh out the demographic mechanics of urban population change. For example, there has been very little research on urban natural increase despite a general awareness among demographers that it is likely the largest contributor to urban population growth in many countries. Yet evidence from the Demographic and Health Surveys (DHS) Program hints at some important trends.
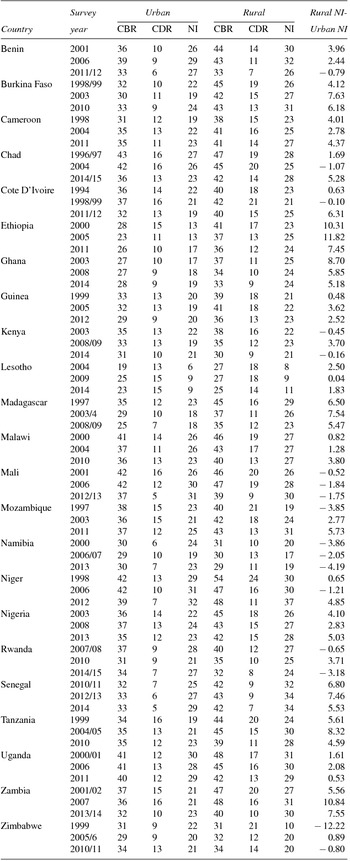
Table 3 shows crude birth rates (CBR), estimated crude death rates (CDR), and rates of natural increase (NI) broken down by rural and urban residence for 23 countries for which data from three survey rounds or more are available. Crude death rates are not reported by the DHS Programme so the figures shown are estimates based upon reported infant mortality rates (see Appendix for details of the estimation procedure). The final column of the table shows the difference between rural and urban rates of natural increase (i.e. births minus deaths).
Birth rates, estimated death rates and natural increase by rural and urban residence

Notes: Crude birth rate data are from the DHS Programme access online September 2016. Crude death rates were calculated from the infant mortality rates reported by the DHS programme. The methodology for this calculation is outlined in the Appendix.
Although the figures should be treated with caution given that the crude death rate has been estimated, several important observations can be made. First, urban birth rates remain relatively high in most Africa countries, with an average of 32.8 in the latest survey round. By comparison, Bangladesh registered an urban CBR of 20.8 in 2014; Pakistan a rate of 27 in 2013; and India 18.8 in 2006 (the latest year for which DHS data are available). High birth rates translate into higher rates of urban growth and may also have implications for poverty reduction.
Second, in 15 of 23 cases urban birth rates increased rather than decreased between survey rounds. In Ghana, urban birth rates appear to have been rising persistently since a recorded nadir in the mid-1990s, and many other countries have experienced some type of urban fertility bump in the past 20 years. Why does urban fertility remain high and in some cases appear to have revered trends and started to rise? The answer may lie in changing ages structures associated with in-migration of young people, or it may reflect other socioeconomic or public health dynamics that have yet to be identified.
Third, urban populations are growing nearly as fast as rural populations across the continent—in some cases faster. In 17 out of the 69 country-years reported in Table 3, urban natural increase exceeded rural natural increase. In these contexts, urbanization could be occurring even in the absence of any rural-urban migration. In some countries, such as Kenya, Mali, Namibia, Rwanda, and Zimbabwe this under-researched phenomenon appears in multiple survey years. Even in countries where rural natural increase is greater than urban natural increase the difference is generally not large, which means that even very low rates of rural-urban migration could drive urbanization. These observations highlight the importance of understanding the underlying determinants of fertility and mortality rates across settlement types if we are to fully urban growth trajectories in Africa.
5. CONCLUSION
There is no doubt that economic factors influence migration patterns and contribute to urban population change—one need only look to China to see the power of economic opportunity to drive mass migration. But an excessive theoretical and empirical emphasis on economically motivated migration as the primary explanation for urbanization has distracted attention from equally important historical demographic forces. Moreover, in many respects it makes more sense to focus on understanding the drivers and patterns of urban growth rather than urbanization if the purpose of monitoring population change is to inform evidence-based policy. It is urban growth—not urbanization—that ultimately determines the required number of houses, jobs, sewerage treatment plants, etc. that need to be created to meet human development objectives. And focusing on urban growth rather than urbanization yields a more nuanced perspective on spatial-demographic change.
In sub-Saharan Africa, mortality decline has made rapid urban growth and persistent urbanization possible even in the face of economic stagnation and decline. While migration is no doubt an important component of urban growth, urban natural increase and rural transformation are almost certainly more significant. As more data become available, we should be able to develop increasingly sophisticated and spatially nuanced understandings of urban population change that transcend the crude rural-urban dichotomy that has dominated monitoring in the past.
APPENDIX
ESTIMATING CRUDE DEATH RATES BY RESIDENCE FROM INFANT MORTALITY DATA
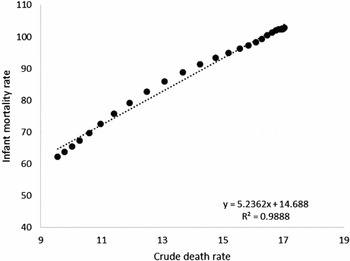
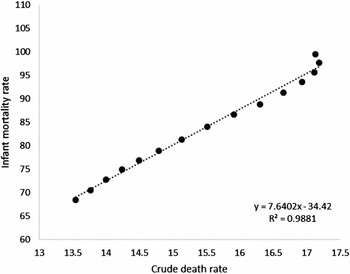
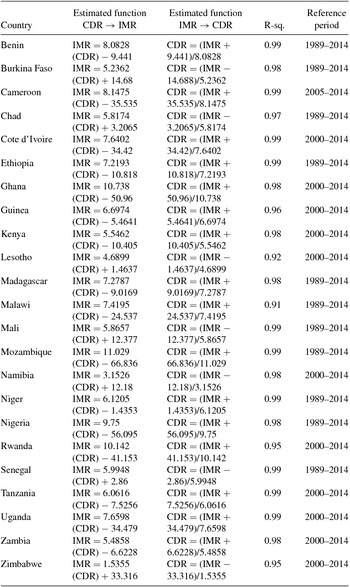
The DHS Programme reports crude birth rates (CBR) by residence but does not report crude death rates (CDR), which are required to calculate rates of natural increase (NI) by residence. In order to estimate crude death rates by residence, data on infant mortality rates and crude death rates at the national level between 1989 and 2014 were compiled for each country from the World Bank World Development Indicators database online, accessed November 2016. For each individual country, a conversion equation was generated from an ordinary least-squares regression model. This equation was then used to transform rural and urban infant mortality rates into estimated rural and urban death rates. An example of equation generation is shown in Figure A1.
Figure A1.

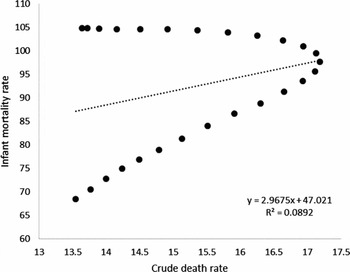
However, in many cases there were very noticeable and abrupt changes in trend between periods rendering a linear estimation unuseable. In these cases, the reference period was abbreviated to post-2000 or post-2005 to facilitate linear modeling. As only data for the three most recent surveys are reported in Table 3, the truncated reference period was assumed to be the most relevant. An example is of this is illustrated in Figures A2 and A3. The equations and parameters for estimation for each country are shown in Table A1.
Figure A2.

Figure A3.

Conversion functions for IMR and CDR based on OLS models for each individual country