


1. Introduction
The motion of neutrally buoyant finite-size material particles in a turbulent flow is typically regarded as the result of turbulent flow fluctuations occurring at the scale of the particle. In other words, the particles are seen as probes of a coarse-grained turbulent field. This implies that both the scaling trends in the fluctuations of accelerations and rotational velocities as a function of the particle size are interpreted in terms of the known scaling of structure functions of turbulence in the framework of the Kolmogorov 1941 (K41) phenomenological theory (La Porta et al. Reference La Porta, Voth, Crawford, Alexander and Bodenschatz2001; Voth et al. Reference Voth, Porta, Crawford, Alexander and Bodenschatz2002; Qureshi et al. Reference Qureshi, Bourgoin, Baudet, Cartellier and Gagne2007; Brown, Warhaft & Voth Reference Brown, Warhaft and Voth2009; Calzavarini et al. Reference Calzavarini, Volk, Bourgoin, Leveque, Pinton and Toschi2009; Homann & Bec Reference Homann and Bec2010). Such a picture has even been extended to the case of non-spherical axisymmetric particles with various aspect ratios to elucidate the observed different scaling trends in tumbling and spinning rotation rates (Parsa & Voth Reference Parsa and Voth2014; Bordoloi & Variano Reference Bordoloi and Variano2017; Bounoua, Bouchet & Verhille Reference Bounoua, Bouchet and Verhille2018; Kuperman, Sabban & van Hout Reference Kuperman, Sabban and van Hout2019; Pujara, Voth & Variano Reference Pujara, Voth and Variano2019; Oehmke et al. Reference Oehmke, Bordoloi, Variano and Verhille2021). This interpretation assumes that neutrally buoyant material particles are only weakly coupled to the flow, so that the feedback effects (also referred as two-way coupling) stemming from the formation of boundary layers and wakes around the particle do not play a significant role, at least in statistical terms.
This line of reasoning is markedly distinct from the one that is used to grasp the dynamics of small, i.e. sub- or Kolmogorov-scale ( $\eta$) sized particles, where instead it is crucial to take into account the local properties of the flow, notably the fluid acceleration and the velocity gradient and its topological properties along fluid Lagrangian trajectories (Chong, Perry & Cantwell Reference Chong, Perry and Cantwell1990; Benzi et al. Reference Benzi, Biferale, Calzavarini, Lohse and Toschi2009) . It is key here to recognize that distinctive flow structures exist at small scales, such as the filament-like vortices where fluid tracers get trapped (Biferale et al. Reference Biferale, Boffetta, Celani, Lanotte and Toschi2005; Bentkamp, Lalescu & Wilczek Reference Bentkamp, Lalescu and Wilczek2019) or from which tiny inertial particles are ejected (Bec et al. Reference Bec, Biferale, Cencini, Lanotte, Musacchio and Toschi2007) and with which spheroidal particles align (Pumir & Wilkinson Reference Pumir and Wilkinson2011; Gustavsson, Einarsson & Mehlig Reference Gustavsson, Einarsson and Mehlig2014; Ni, Ouellette & Voth Reference Ni, Ouellette and Voth2014). These two pictures, the dissipative and the inertial-scale ones, are somehow conceptually disconnected, with the only bridging idea being the call into play of so-called Faxén corrections, which account for effects induced by the local curvature of the flow although at scales where the flow field is smooth, typically
 ${\leqslant }10 \eta$, hence not yet in the inertial range (Calzavarini et al. Reference Calzavarini, Volk, Bourgoin, Leveque, Pinton and Toschi2009) (we note that, while simple for spherical particles, the Faxén corrections are more complex for other particle shapes, see Dolata & Zia Reference Dolata and Zia2021).
In this paper, we aim at ameliorating the above described conceptual models by demonstrating that the dynamics of neutrally buoyant inertial-sized particles: (i) is affected by inertial-range coherent flow structures with similar effects as the ones produced by dissipative-scale turbulent structures on small particles, and (ii) is significantly impacted by the particle feedback on the flow, especially if the considered observable is the angular rotation. This is here achieved by means of a novel series of numerical experiments. First, we perform extensive simulations of fully resolved homogeneous isotropic turbulence (HIT) seeded with neutrally buoyant spheroidal particles with sizes ranging from the upper bound of the dissipative range ( ${\sim }10\eta$) to the far inertial range (
 $60 \eta$). Second, we conduct a sequence of numerical experiments in the same fluid flow setting but with virtual particles, i.e. toy particle models, where we vary the type or/and level of coupling between the flow and the particles. As we will show, such virtual particles are revealed to be a crucial tool for an original physical interpretation of the statistical properties of translation and rotation of the real material particles in interaction with the turbulent flow environment.
The article is organized as follows. In the next section, we will describe in detail the dynamical governing equations for the model system of particles in turbulence and their numerical implementation. We will dedicate a section to the description of the numerical experiments performed both with realistic and virtual particles. We later present the results for the particle acceleration and rotation rate statistics. In each of these two parts, we will guide the reader through a physical interpretation of the results, mainly by contrasting the simulations of real particles with virtual ones. Finally, the conclusions and perspectives opened up by the study are given.
2. Methods
We first describe the basic physical model system and the equation of motion ruling the dynamics of particles in a fluid flow. The numerical methods adopted and details of their implementations are very briefly outlined.
2.1. The particles in turbulence model system and numerical implementation of the model
The fluid flow by which particles are transported is modelled by the incompressible Navier–Stokes equations (NSE) driven by an external random large-scale statistically homogeneous and isotropic force with constant-in-time global energy input. This reads
 \begin{gather} \partial_t \boldsymbol{u} + \boldsymbol{u}\boldsymbol{\cdot} \boldsymbol{\nabla} \boldsymbol{u} ={-} \rho^{{-}1}\boldsymbol{{\nabla}} p + \nu \nabla^{2} \boldsymbol{u} + \boldsymbol{f}, \end{gather}
 \begin{gather}{\boldsymbol{\nabla}} \boldsymbol{\cdot} \boldsymbol{u} = 0, \end{gather}
where  $\boldsymbol {u}(\boldsymbol {x},t)$ denotes the fluid velocity vector field,
 $p(\boldsymbol {x},t)$ is the hydrodynamic pressure and the parameters are the kinematic viscosity
 $\nu$ and the reference liquid density
 $\rho$. The vector field
 $\boldsymbol {f}$ refers to the external force sustaining the HIT flow. The particle-free turbulent flow intensity is here identified by a single dimensionless parameter, the Reynolds number based on the Taylor microscale,
 $Re_\lambda =\lambda u'/\nu$, where
 $u'=\sqrt {\langle u_iu_i\rangle ^{v,t}/3}$ is the root-mean-square velocity of the turbulent flow (
 $\langle \ldots \rangle ^{v,t}$ denotes here volume and time average),
 $\lambda =\sqrt {15\nu u'^{2}/\epsilon }$ is the Taylor length scale and
 $\epsilon = (\nu /2) \varSigma _{i,j}\langle (\boldsymbol {\nabla }_i u_j + \boldsymbol {\nabla }_j u_i)^{2} \rangle ^{v,t}$ is the mean global energy dissipation rate.
The translation and rotation of rigid-body material particle is governed by the Newton–Euler equations (NEE)
 \begin{gather} m_p \frac{{\rm{d}} \boldsymbol{v}}{{\rm d}t} = \boldsymbol{F}+\boldsymbol{F}_c, \end{gather}
 \begin{gather}\frac{{\rm d} \boldsymbol{I}_p \boldsymbol{\varOmega}}{{\rm d}t} = \boldsymbol{T}+\boldsymbol{T}_c, \end{gather}
where  $\boldsymbol {v}(t)={\rm d}\boldsymbol {r}/{\rm d}t$ and
 $\boldsymbol {\varOmega }(t)$ are the particle velocity and angular velocity vectors of a particle at position
 $\boldsymbol {r}(t)$ with mass
 $m_p=\rho _p V_p$ (
 $\rho _p$ is the particle density and
 $V_p$ the volume) and
 $\boldsymbol{I}_p$ the moment of inertia tensor. Note that, since we consider neutrally buoyant and homogeneous particles,
 $\rho _p =\rho$, this allows us to neglect the buoyancy force in the particle equation of motion as well any gravity-induced torque. Hence
 $\boldsymbol {F}$ and
 $\boldsymbol {T}$ in (2.3)–(2.4) denote here the hydrodynamic force and torque acting on the particle, which are formally written as
 \begin{gather} \boldsymbol{F} = \oint_{S_p} \boldsymbol{\sigma} \boldsymbol{\cdot} \boldsymbol{n}\,{\rm d}S, \end{gather}
 \begin{gather}\boldsymbol{T} = \oint_{S_p} (\boldsymbol{x}-\boldsymbol{r}) \times (\boldsymbol{\sigma} \boldsymbol{\cdot} \boldsymbol{n})\,{\rm d}S, \end{gather}
where  $\boldsymbol {\sigma } = -p \boldsymbol {I}+\rho \nu (\boldsymbol {\nabla }\boldsymbol {u} + \boldsymbol {\nabla }\boldsymbol {u}^{\rm T})$ is the fluid stress tensor,
 $\boldsymbol {x}-\boldsymbol {r}$ the position vector relative to the particle centre and
 $\boldsymbol {n}$ the outward-pointing normal to the particle surface
 $S_p$;
 $\boldsymbol {F}_c$ and
 $\boldsymbol {T}_c$ are the additional impulsive forces and torques related to the particle–particle collisions (the so-called four-way interaction). The two-way coupling, meaning the coupling between the fluid and the particles, is provided by the requirement of a no-slip boundary condition on the particle surfaces (see below for its numerical implementation).
For an axisymmetric particle with symmetry axis identified by a unit vector  $\boldsymbol {p}$, such as the ones we consider in this study, the angular velocity
 $\boldsymbol {\varOmega }$ can be decomposed into the tumbling rotation rate,
 ${\dot {\boldsymbol {p}}}={\boldsymbol {\varOmega }}\times \boldsymbol {p}$, and the spinning rotation rate,
 $\boldsymbol {\varOmega }^{s}=({\boldsymbol {\varOmega }}\boldsymbol {\cdot } \boldsymbol {p})\boldsymbol {p}$ (Voth & Soldati Reference Voth and Soldati2017). These will be key quantities in our analysis of the particle angular dynamics. Similarly, it will be useful in our analysis to distinguish between axial and lateral accelerations,
 $\boldsymbol {a} = {\rm {d}}\boldsymbol {v}/{\rm {d}}t$, denoted
 $\boldsymbol {a}^{\parallel }=(\boldsymbol {a} \boldsymbol {\cdot } \boldsymbol {p})\boldsymbol {p}$ and
 $\boldsymbol {a}^{\perp } = \boldsymbol {a}\times \boldsymbol {p}$, respectively. The shape of an axisymmetric spheroid is characterized by the aspect ratio,
 $\alpha =l/d$, where
 $l$ and
 $d$ are the sizes of the symmetry axis and of the one perpendicular to it. We will use the volume-equivalent diameter
 $D_v=(d^{2} l)^{1/3}=d\alpha ^{1/3}$ as a parameter to compare the sizes of particles with different shapes.
On the computational side: the NSE turbulent dynamics is here numerically simulated by means of a lattice Boltzmann method (LBM) code, ch4-project (Calzavarini Reference Calzavarini2019), which has been already extensively employed in studies of Lagrangian tracers and point-like particle dynamics in turbulence (Mathai et al. Reference Mathai, Calzavarini, Brons, Sun and Lohse2016; Calzavarini, Jiang & Sun Reference Calzavarini, Jiang and Sun2020; Jiang, Calzavarini & Sun Reference Jiang, Calzavarini and Sun2020; Jiang et al. Reference Jiang, Wang, Liu, Sun and Calzavarini2021). The code uses a tri-linear scheme for the Lagrangian–Eulerian frame interpolations. The computational domain is cubic with equispaced grid sizes,  $128^{3}$ and
 $512^{3}$, corresponding to
 $Re_\lambda =32,120$ (see table 1 for details on numerical accuracy properties and physical characteristics of the simulated turbulent flow at
 $Re_{\lambda }=120$). The NEE are numerically integrated with a second-order Adams–Bashforth time-stepping scheme. The particle–fluid two-way coupling is implemented by means of the immersed boundary method (IBM), which has been widely used in particle-laden flows (Peskin Reference Peskin2002; Mittal & Iaccarino Reference Mittal and Iaccarino2005; Uhlmann Reference Uhlmann2005; Ardekani et al. Reference Ardekani, Costa, Breugem and Brandt2016; Shen et al. Reference Shen, Lu, Wang and Peng2021) also in combination with LBM e.g. in Suzuki & Inamuro (Reference Suzuki and Inamuro2011) and Do-Quang et al. (Reference Do-Quang, Amberg, Brethouwer and Johansson2014). The IBM enforces the no-penetration and no-slip boundary conditions at the fluid–particle interface by means of a localized feedback force,
 $\boldsymbol {f}_p$, added to the NSE (2.1). Such
 $\boldsymbol {f}_p$ term is also denoted as two-way coupling. In order to ensure high accuracy for the implementation of the no-slip fluid boundary condition at the particle surface, we adopt the so-called IBM multi-forcing scheme with 5 step iterations, see Luo et al. (Reference Luo, Wang, Fan and Cen2007) and Wang et al. (Reference Wang, Jiang, Jiang, Sun and Liu2021a). The non-spherical particle–particle interactions are implemented by means of soft-sphere collision forces (Costa et al. Reference Costa, Boersma, Westerweel and Breugem2015; Ardekani et al. Reference Ardekani, Costa, Breugem and Brandt2016) and lubrication corrections (Brenner Reference Brenner1961; Cooley & O'Neill Reference Cooley and O'Neill1969; Costa et al. Reference Costa, Boersma, Westerweel and Breugem2015; Ardekani et al. Reference Ardekani, Costa, Breugem and Brandt2016). In order to limit the effect of the pair interactions on the statistics of the particle dynamics, the concentration of particles is kept very low (the maximal volume fraction is
 $1\,\%$) and only up to 4 particles are seeded in the simulation for the smallest particle size. All inter-particle collision events are removed from the data sets employed for the statistical analysis performed in the present study. To achieve this, the particle acceleration/rotation data around the collisions are removed by a time window whose width is of the order of the correlation time of the particle acceleration (i.e.
 ${\gtrsim }\tau _{\eta }$, see also figure 11b). Thus, the effect of pair interaction is considered negligible.
Parameters of the NSE numerical simulations and relevant turbulence scales. Here,  $N^{3}$: number of spatial grid points,
 $\eta =(\nu ^{3}/\epsilon )^{1/4}$: Kolmogorov dissipation length scale in grid space units
 $\Delta x$,
 $\tau _\eta$: Kolmogorov time scale in time-step units
 $\Delta t$,
 $L=u'^{3}/\epsilon$: integral scale,
 $T_L=L/u'$: large-eddy turnover time,
 $\lambda = (15 \nu u' / \epsilon )^{1/2}$: Taylor micro-scale,
 $Re_\lambda$: Taylor–Reynolds number.

Prolate ( $\alpha =2, 4$), spherical (
 $\alpha =1$) and oblate (
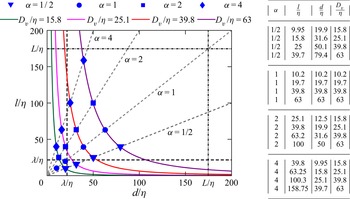
 $\alpha =0.5$) particles are investigated in the simulations, see figure 1 for a representation of the explored parameter space. For all considered cases, the minimal linear size of the particle, either
 $d$ and
 $l$, is
 ${>}15 \Delta x$ (grid units). Such choice guarantees a reasonable resolution of the particle boundary layers whose inner (or viscous) thickness is expected to be of order
 $\eta$ (although it might become thinner for particles with
 $D_v\gg \eta$, as pointed out in (Cisse, Homann & Bec Reference Cisse, Homann and Bec2013)). The particle Stokes number, defined as the ratio of the particle viscous response time (
 $\tau _p = D_v^{2} / (12 \nu$)) to the characteristic flow scale at the particle scale (here, the turbulent eddy turnover time
 $\tau _{\ell } = \ell ^{2/3}/\epsilon ^{1/3}$), can be expressed as
 $St_{\ell }=\frac {1}{12}({D_v}/{\eta })^{4/3}$ (Xu & Bodenschatz Reference Xu and Bodenschatz2008; Fiabane et al. Reference Fiabane, Zimmermann, Volk, Pinton and Bourgoin2012). It varies in the range from 1.8 to 20.9. Finally, for each studied particle type case the duration of the simulation is more than 100 large-eddy turnover times.
Parameter space of particle shapes and sizes in turbulent scale units at  $Re_\lambda =120$. The symbols indicate the numerically simulated particle types. All particles are axisymmetric of diameter
 $d$ and length
 $l$, aspect ratio
 $\alpha =l/d$, with
 $\alpha = 1/2,1,2,4$, the volume-equivalent diameter is
 $D_v = (l d^{2})^{1/3}$. The lengths are here all expressed in terms of the dissipative scale
 $\eta$. The Taylor micro-scale
 $\lambda$ (dashed lines) and the integral scale
 $L$ (dashed-dotted lines) are also reported.

We have validated the numerical results by comparing the translational dynamics of spheres ( $\alpha =1$) at
 $Re_\lambda =32$ with a previous reference study (Homann & Bec Reference Homann and Bec2010). This check validates our acceleration statistics (see Appendix A for details). The rotational dynamics of the spheroids is instead checked by solving the rotation rate of a prolate spheroid in a pure shear flow, a condition for which the Jeffery solution (Jeffery Reference Jeffery1922) is available, and by reproducing the numerical experiments in Suzuki & Inamuro (Reference Suzuki and Inamuro2011), which include settling of ellipsoidal particles in a quiescent flow at finite Reynolds numbers.
2.2. Numerical experiments with real and virtual particles
Taking advantage of the numerical approach, which allows us to easily modify the equations of motion of the advected particles and so to create toy models, we carry out several additional numerical experiments. This series of numerical experiments is described in the following.
The first numerical experiment is the simulation of real particles (RP) which system obeys the model system introduced in the previous section. Their dynamics is governed by the NSE and NEE with fluid–solid coupling computed by the IBM algorithm, see table 2, as also sketched in the cartoon of figure 2(a).
Summary of the six numerical experiments with the corresponding involved dynamical equations: Navier–Stokes equation (NSE) (2.1)–(2.2), Newton–Euler equation (NEE) (2.3)–(2.4); Euler equation (EE) (2.4) only rotation for particles with fixed location; no-slip boundary conditions (i.e. two-way coupling) at particle–fluid interface implemented via the IBM; tracer equation (2.11), Jeffery equation (2.12)–(2.13).

Sketches of the six numerical experiments performed: (a) real particles RP, (b) real particles with fixed locations RPFL, (c) virtual particles VP, i.e. particles without solid–fluid boundaries, (d) virtual particles with fixed locations VPFL, (e) Jeffery fluid tracers JFT and (f) volume average of fluid tracers VA. The light blue region denotes the fluid. The black shaded areas in panels (a,b) represent the two-way coupling region. The points in panels (e,f) represent the Jeffery fluid tracers. The tracers marked in black in panel (f) are used to calculate the volume averages.

The second numerical experiment consists of spheroidal volume averages (VA) of fluid flow, as shown in figure 2(f). We average the fluid acceleration and vorticity over many ( $N$) spheroids with the same diameter
 $D_v$ and aspect ratio
 $\alpha$ as the ones used for RP. This reads
 \begin{gather} \langle a_i^{2}\rangle^{VA} = \frac{1}{N}\sum_{n=0}^{N}\left(\frac{1}{V_p}\int_{V_p} \frac{{\rm D} u_i}{{\rm D}t}\,{\rm d}^{3} x\right)^{2}, \end{gather}
 \begin{gather}\langle \varOmega_i^{2}\rangle^{VA} = \frac{1}{N}\sum_{n=0}^{N}\left(\frac{1}{V_p}\int_{V_p} \omega_i\,{\rm d}^{3} x\right)^{2}, \end{gather}
where  ${\rm D} u_i / {\rm D}t = \partial _t u_i + u_j \partial _j u_i$ is the
 $i$th acceleration component the fluid inside a spheroid of volume
 $V_p$. We note that the orientation and location of VA are fixed. However, in a statistical homogeneous and isotropic flow, as considered here, this is identical to performing the averages at locations that are random uniformly distributed in space and over randomly oriented spheroids.
In the third numerical experiment, we seed virtual particles (VP) in the HIT and evolve the trajectory and rotation by solving the NEE, as shown in figure 2(c). For these particles, the IBM algorithm in not activated and no feedback is implemented on the flow by the virtual particles ( $\boldsymbol {f}_p=0$). Thus, the translation and rotation of the particles are driven by the time derivative of the momentum and angular momentum of the fluid inside the virtual particles, which means the dynamics of VP is controlled by the fluid at the scale of VP. More explicitly the force,
 $\boldsymbol {F}_{VP}$, and torque,
 $\boldsymbol {T}_{VP}$, on the virtual particles are
 \begin{gather} \boldsymbol{F}_{VP} = \rho V_p \left\langle \frac{{\rm D} \boldsymbol{u}}{{\rm D}t} \right\rangle^{v} \equiv \int_{V_p} \rho \frac{{\rm D} \boldsymbol{u}}{{\rm D}t}\,{\rm d}^{3} x, \end{gather}
 \begin{gather}\boldsymbol{T}_{VP} = V_p \left\langle \frac{{\rm d}\boldsymbol{L}}{{\rm d}t} \right\rangle^{v} \equiv \int_{V_p} (\boldsymbol{x} - \boldsymbol{r}) \times \rho \frac{{\rm D} \boldsymbol{u}}{{\rm D}t} \,{\rm d}^{3} x, \end{gather}
where  ${\rm D} \boldsymbol {u}/{\rm D}t$ is the fluid acceleration,
 $\boldsymbol {L}$ is the angular momentum and
 $\langle \rangle ^{v}$ denotes the average over the fluid volume of the virtual particle.
In the fourth numerical experiment, we adopt real particles with fixed locations (RPFL). We fix the spatial position of the real particles and only evolve the rotation by solving (2.4). In this case, the IBM is still implemented and the particles are two-way coupled with the flow, as shown in figure 2(b).
The fifth numerical experiment contains the virtual particles with fixed locations (VPFL), as shown in figure 2(d). We fixed the location of VP in the turbulence and only evolve the rotation by solving (2.4). No feedback on the flow is imposed and the rotation of VPFL is driven by the time derivative of the angular momentum of the fluid inside the virtual particles.
Finally, to better contrast the dynamics of finite-size particles with respect to sub-Kolmogorov-scale particles, we carry out a sixth numerical experiment with point-like spheroidal tracers, as shown in figure 2(e). The governing equations for the point-like spheroidal tracers with position,  $\boldsymbol {r}(t)$, and orientation,
 $\boldsymbol {p}(t)$, are given by
 \begin{gather} \dot{\boldsymbol{r}} = \boldsymbol{u}(\boldsymbol{r}(t),t), \end{gather}
 \begin{gather}\dot{\boldsymbol{p}} = \boldsymbol{\varOmega} \times \boldsymbol{p}, \end{gather}
 \begin{gather}{\boldsymbol{\varOmega}} =\tfrac{1}{2}{\boldsymbol{\omega}}(\boldsymbol{r}(t),t) + \varLambda\boldsymbol{p}\times \boldsymbol{S}(\boldsymbol{r}(t),t)\boldsymbol{p}. \end{gather}
Here,  $\boldsymbol {u}(\boldsymbol {r}(t),t)$ is the fluid velocity at the particle position at time
 $t$. The vector
 ${\boldsymbol {\omega }}(\boldsymbol {r}(t),t) = \boldsymbol {\nabla } \times \boldsymbol {u}$ is the fluid vorticity and
 $\boldsymbol{S} = (\boldsymbol {\nabla } \boldsymbol {u}+ \boldsymbol {\nabla } \boldsymbol {u}^{\rm T})/2$ is the strain-rate tensor with,
 $\boldsymbol {\nabla } \boldsymbol {u}$, the velocity gradient at the particle position and
 $\varLambda =({\alpha ^{2}-1})/({\alpha ^{2}+1})$ is the shape parameter of the particles. The equations of rotation (2.12)–(2.13), called the Jeffery angular equations (Jeffery Reference Jeffery1922; Byron et al. Reference Byron, Einarsson, Gustavsson, Voth, Mehlig and Variano2015), have been extensively used for the study of the dynamics of tiny spheroidal tracers in turbulent flows (Parsa et al. Reference Parsa, Calzavarini, Toschi and Voth2012; Gustavsson et al. Reference Gustavsson, Einarsson and Mehlig2014; Calzavarini et al. Reference Calzavarini, Jiang and Sun2020; Jiang et al. Reference Jiang, Wang, Liu, Sun and Calzavarini2021, Reference Jiang, Calzavarini and Sun2020). The aspect ratios of the point-like spheroidal tracers (hereafter called Jeffery tracers) are chosen to be equal to those of RP. For each aspect ratio, we seed
 $10^{5}$ Jeffery tracers in the flow to have converged statistics. The numerical condition of the flow is identical to the simulation of RP. We use
 $\langle \rangle ^{tracer}$ to denote the temporal and ensemble average of Jeffery tracers. Note that the translational dynamics of the particles is that of perfect Lagrangian tracers, (2.11), independently of their geometric aspect ratio (i.e. the drag force is here neglected). For this reason, we denote the particles as Jeffery fluid tracers (JFT). For better clarity all the model systems described above are summarized in table 2.
3. Results
3.1. Particle trajectories and field visualizations
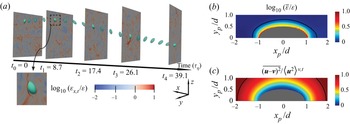
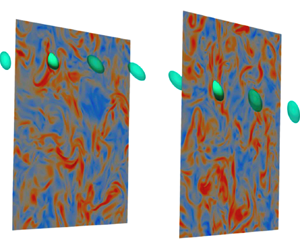
In figure 3(a) a visualization example of the trajectory of a spheroid with  $\alpha =2$ and an equivalent diameter
 $D_v=25 \eta$ over a relatively short time span,
 ${\sim }40$ dissipative times (
 $\tau _{\eta }$), obtained from the simulation is shown. The energy dissipation rate field in the fluid,
 $\epsilon$, is represented in colour over planes intersecting the spheroid. Such a quantity, that depends on the square of velocity gradients, allows us to foreground the effect the fluid–particle coupling. We observe that just a thin layer of large dissipation appears around the particle (see the zoom-in region of the slice at
 $t_1=8.7\tau _\eta$), while no wakes are observed at larger distances. This mild effect induced by the particle presence in the flow is better quantified by computing temporal fluid averages in the vicinity of the particle. This is numerically performed by seeding the flow with point-like Lagrangian probes whose positions are fixed in the particle frame of reference. Figure 3(b) shows the temporally and azimuthally averaged local dissipation rate around the spheroid (
 $\alpha =2$ and
 $D_v/\eta =25$). It appears that the dissipation rate close to the particle is enhanced by one order of magnitude with respect to the far-field value, furthermore, such an increase is uniformly distributed around the particle. Indeed, the contour line in the figure (black colour) marking where the particle influence reaches a saturation, indicates that the finite-size particle modifies the flow over a spheroidal region of approximately 1.5 times the linear size of the particle. Similar results for finite-size spheres have been observed in turbulence at
 $Re_\lambda =160$ (Cisse et al. Reference Cisse, Homann and Bec2013). The presence of the particle significantly modifies also the kinetic energy around the particle, the kinetic energy of the fluid is null at the particle interface and increases to the unperturbed value at approximately twice the particle size
 $D_v$, see figure 3(c). The same figure suggests that the slip velocity of neutrally buoyant particles is small, in particular
 $|\boldsymbol {u}-\boldsymbol {v}| \sim \boldsymbol {u}_{rms}$. This implies that the particle Reynolds number
 $Re_p = \langle |\boldsymbol {u}-\boldsymbol {v}| \rangle D_v / \nu \sim (D_v/\lambda ) Re_{\lambda } \sim O(10^{2})$. If the flow surrounding the particle were steady and laminar this would lead to a steady or periodically oscillating wake. In a turbulent flow, where the direction of motion changes frequently, such an effect is weakened. For the cases of spherical particles, this agrees with detailed study by Cisse et al. (Reference Cisse, Homann and Bec2013). Overall, the presence of a neutrally buoyant finite-sized non-spherical particle has weak feedback on the turbulent flow field. This is certainly very specific to the case of inclusions with the same density, the situation is very different in the case of heavy particles (Brändle de Motta et al. Reference Brändle de Motta, Estivalezes, Climent and Vincent2016) or large bubbles (Mathai et al. Reference Mathai, Huisman, Sun, Lohse and Bourgoin2018). This suggests that the picture of neutral inertial particles as essentially passive objects might be sound. We will now address this in more detail by looking at two quantities that are most sensitive to the fluid–particle one-way coupling, i.e. the fluid acceleration and later the angular velocity.
(a) Example of trajectory for a spheroid with an equivalent diameter  $D_v\approx 25\eta$ and aspect ratio
 $\alpha =2$ at
 $Re_\lambda =120$. The slices show the local dissipation rate
 $\epsilon _{\boldsymbol {x},t}$, normalized by
 $\epsilon$, at the planes through the spheroid centre at times
 $t=0,8.7,17.4,26.1,39.1$ in
 $\tau _\eta$. (b) Azimuthally and temporally averaged dissipation rate
 $\overline \epsilon$, normalized by
 $\epsilon$, around the spheroid with a diameter
 $D_v\approx 25\eta$ and aspect ratio
 $\alpha =2$ at
 $Re_\lambda =120$. The black line denotes the contour line of
 ${\rm log}_{10}(\bar {\epsilon }/\epsilon )=0$. (c) Azimuthally and temporally averaged square of
 $\boldsymbol {u}-\boldsymbol {v}$, normalized by the mean square of
 $\boldsymbol {u}$, around the spheroid with diameter
 $D_v= 25\eta$ and aspect ratio
 $\alpha =2$ at
 $Re_\lambda =120$. The black line denotes the contour line of
 $\overline {(\boldsymbol {u}-\boldsymbol {v})^{2}}/\langle \boldsymbol {u}^{2}\rangle ^{v,t}=1$. Here,
 $x_p$ and
 $y_p$ represent the coordinates in the particle frame.

3.2. Particle acceleration statistics: the VP model explains the size and shape dependencies in RP
We begin discussing the dependency of the particle acceleration intensity of large spheroids as a function of their shape and size and the physical mechanisms responsible for the observed dependencies. Figure 4(a) reports the temporal and ensemble average (denoted in the following  $\langle \ldots \rangle$) of the single-Cartesian-component acceleration variance
 $\langle a_i^{2}\rangle$ of RP, normalized by the acceleration variance of fluid tracers
 $\langle a_i^{2}\rangle ^{tracer}$, as a function of the equivalent diameter in turbulent dissipative scale units
 $D_v/\eta$. Two observations are here in order. First, the acceleration variance decreases as the size of the spheroids increases. In the range
 $D_v/\eta \in [10,63]$ we measure the power law
 $\sim (D_v/\eta )^{-1.0 \pm 0.1}$ (at
 $Re_\lambda =120$). Second, we remark on a good collapse onto a single curve of all the data points corresponding to different aspect ratios (with
 $\alpha = [1/2,1,2,4]$). The observed scaling behaviour is consistent with the one observed for spherical particles at large
 $Re_\lambda$ values (Volk et al. Reference Volk, Calzavarini, Leveque and Pinton2011). Such a scaling deviates from
 $(D_v/\eta )^{-2/3}$ that can be guessed on the basis of dimensional reasoning relying on the K41 theory of turbulence (Voth et al. Reference Voth, Porta, Crawford, Alexander and Bodenschatz2002; Qureshi et al. Reference Qureshi, Bourgoin, Baudet, Cartellier and Gagne2007). This reasoning assumes that the particles are only one-way coupled to the fluid, i.e. they do not affect the fluid flow significantly through particle–fluid interactions. However, the existence of such a deviation has been already reported in studies on spherical particles. In particular, it is known that the scaling exponent has a Reynolds number dependence (Voth et al. Reference Voth, Porta, Crawford, Alexander and Bodenschatz2002; Qureshi et al. Reference Qureshi, Bourgoin, Baudet, Cartellier and Gagne2007). At lower
 $Re_\lambda$ the observed exponent is closer to the value
 $-4/3$, as observed in Homann & Bec (Reference Homann and Bec2010). The role of the pressure scaling dependence on
 $Re_\lambda$ has been conjectured to be responsible for such a behaviour. Our results at low Reynolds number,
 $Re_\lambda =32$ (see figure 11 in Appendix A) confirms such a dependence. On the other hand, the collapse of acceleration variance for different particle shapes (figure 4a) is a novel feature. It is remarkable because it implies that the hydrodynamical forces involved in the translational dynamics of spheroids are overall determined by the particle volume.
(a) Normalized single component acceleration variance as a function of the normalized particle size  $D_v/\eta$ at
 $Re_\lambda =120$ for real particles (RP: solid symbols) and volume averages (VA: open symbols). The dashed lines are the fitting lines for spheres of RP (exponent
 $-1.0 \pm 0.1$). Inset in (a) shows the ratio of acceleration variance of VA to acceleration variance of RP,
 $\langle a_i^{2} \rangle ^{VA}/\langle a_i^{2} \rangle$, as a function of
 $D_v/\eta$. (b) Normalized componentwise acceleration variance as a function of the normalized particle size
 $D_v/\eta$ at
 $Re_\lambda =120$ for real particles (RP: solid symbols) and virtual particles (VP: open symbols). The dashed lines are the fitting lines for spheres of RP. Inset in (b) shows the ratio of acceleration variance of VP to acceleration variance of RP,
 $\langle a_i^{2} \rangle ^{VP}/\langle a_i^{2} \rangle$, as a function of
 $D_v/\eta$. (c) The ratio of axial variance
 $\langle (\boldsymbol {a}\boldsymbol {\cdot } \boldsymbol {p})^{2}\rangle$ to lateral variance
 $\langle |\boldsymbol {a}\times \boldsymbol {p}|^{2}\rangle$ of particle acceleration as a function of aspect ratio at
 $Re_\lambda =120$ for RP (triangles), VA (square) and VP (circles), respectively. The black dash-dot line denotes the results of Jeffery tracers. The colour represents the normalized particle size
 $D_v/\eta$ in logarithmic scale.

In order to further substantiate these findings, we show the results of the numerical experiment with fluid volume averages (VA) and the so-called virtual particles (VP) in figure 4(a,b) (empty symbols). Similar scaling relations of acceleration variances are observed both for VA and VP in the inertial regime, whereas the magnitudes of the acceleration variances of VP and VA are not equal. In particular, the amplitude of accelerations fluctuations of VP particles is closer to that of RP particles (see insets in figure 4(a,b) where their ratio is plotted). Note that the acceleration variances of VA and VP represent respectively the volume averaging of the fluid flow acceleration in the fixed frame (Eulerian perspective) and in an advected frame (Lagrangian perspective). Therefore, these results stress that the scaling behaviour of the translational dynamics is dominated by the volume averaging instead of other surface forces such as e.g. the drag. However, an interesting question is: Why are VP capable of better approximating the statistics of real particles than VA? This might be due to preferential sampling of fluid structures along their Lagrangian trajectories, a fact that we tend to exclude because we know that these particles do not form clusters, or this might come from a preferential orientation in space (that is dynamical for the RP and VP cases and absent for VA). This is at odds with the expectation that particles of sizes well into the inertial range should become randomly oriented due to the averaging of turbulent fluid fluctuations that results from the spatial volume filtering.
In order to understand if any correlation exists between the particle acceleration and its orientation, we look at the ratio of the particle axial acceleration variance  $\langle (\boldsymbol {a}\boldsymbol {\cdot }\boldsymbol {p})^{2}\rangle$ to the lateral acceleration variance
 $\langle |\boldsymbol {a}\times \boldsymbol {p}|^{2}\rangle$ as a function of their aspect ratio, see figure 4(c). For spherical particles (
 $\alpha =1$), no preferential alignment is expected between
 $\boldsymbol {a}$ and
 $\boldsymbol {p}$, even for various sizes, due to the full rotational symmetry of the body shape. For the non-spherical case, a value of the ratio different from the isotropic value 0.5 marks the existence of preferential orientation.
We find that the oblate particles preferentially align with their acceleration ( $\langle (\boldsymbol {a}\boldsymbol {\cdot }\boldsymbol {p})^{2}\rangle /\langle |\boldsymbol {a}\times \boldsymbol {p}|^{2}\rangle >0.5$) and the prolate particles are predominantly perpendicular to the acceleration (
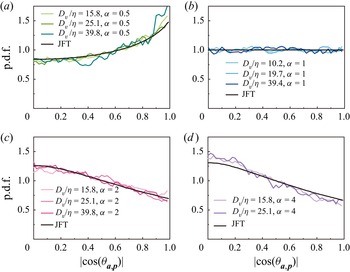
 $\langle (\boldsymbol {a}\boldsymbol {\cdot } \boldsymbol {p})^{2}\rangle /\langle |\boldsymbol {a}\times \boldsymbol {p}|^{2}\rangle <0.5$). It also turns out that the alignment of large particles is identical to that of JFT, which indicates that the alignment is insensitive to the particle's size. This is further confirmed by the measurements of the probability density functions (p.d.f.) of
 $|\cos (\theta _{\boldsymbol {a}, \boldsymbol {p}})|$ for various sizes and shapes (see figure 5), where
 $\theta _{ap}$ defines the angle between the acceleration vector
 $\boldsymbol {a}$ and orientation vector
 $\boldsymbol {p}$. The particular trend of
 $\langle (\boldsymbol {a}\boldsymbol {\cdot } \boldsymbol {p})^{2}\rangle /\langle |\boldsymbol {a}\times \boldsymbol {p}|^{2}\rangle$ as a function of
 $\alpha$ can then be understood in terms of the knowledge of JFT. It has been shown experimentally that fluid tracers have accelerations preferentially perpendicular to the local vorticity (Liberzon et al. Reference Liberzon, Luthi, Holzner, Ott, Berg and Jakob2012). It has also been theoretically demonstrated that prolate particles preferentially align with vorticity while oblate particles are preferentially perpendicular to it (Pumir & Wilkinson Reference Pumir and Wilkinson2011). The combination of these two pieces of evidence explain qualitatively the observed alignment, depending on the aspect ratio, between the particle orientation and the acceleration. The existence of these alignments indicates that the translation of finite-size neutrally buoyant particles in a flow is, in this respect, surprisingly similar to that of point-like inertialess axisymmetric fluid tracers, or conversely that the geometrical structure of flow at the inertial scale shows a similar structure to that of the velocity gradient, which occurs at the dissipation scale.
The p.d.f.s of  $|\cos (\theta _{\boldsymbol {a},\boldsymbol {p}})|$ for RP spheroids with different aspect ratios: (a)
 $\alpha =0.5$, (b)
 $\alpha =1$, (c)
 $\alpha =2$ and (d)
 $\alpha =4$ and for Jeffery fluid tracers.

We now turn our attention to the results for VA and VP. For VA, the values of the ratio  $\langle (\boldsymbol {a}\boldsymbol {\cdot } \boldsymbol {p})^{2}\rangle /\langle |\boldsymbol {a}\times \boldsymbol {p}|^{2}\rangle$ are close to 0.5 for all considered sizes and aspect ratios, which is expected because VA is not aligned with the corresponding acceleration vector. Remarkably, it is found that the ratio
 $\langle (\boldsymbol {a}\boldsymbol {\cdot } \boldsymbol {p})^{2}\rangle /\langle |\boldsymbol {a}\times \boldsymbol {p}|^{2}\rangle$ of VP shows excellent agreement with that of RP (figure 4c). This suggests that the effect induced by the two-way coupling on the particle preferential alignment, if present, is weak. The similarity between RP and VP implies that the neutrally buoyant finite-size particle behaves roughly like a mass of fluid with the same particle size and shape. Furthermore, the size independence of the alignment indicates that the Lagrangian behaviour of a spheroidal fluid mass at the inertial scale is similar to the flow at the dissipative scale. The neutrally buoyant finite-size particles can then be regarded as probes of the Lagrangian coarse-grained field of turbulence.
In the next section, we will check if the similarity between real and virtual particles still holds when the rotational properties of particles are considered.
3.3. Particle rotation statistics: the VP model fails to describe the shape dependence in RP
As already mentioned in § 1, the rotations of tiny,  $D_v \lesssim \eta$, neutrally buoyant particles in turbulent flows are determined by the evolution of the fluid velocity gradient along the Lagrangian particle trajectories. The Jeffery equation (2.12)–(2.13) well captures the angular dynamics of such particles. This has been recently proven in a series of combined experimental and numerical studies (Parsa et al. Reference Parsa, Calzavarini, Toschi and Voth2012; Byron et al. Reference Byron, Einarsson, Gustavsson, Voth, Mehlig and Variano2015; Calzavarini et al. Reference Calzavarini, Jiang and Sun2020; Jiang et al. Reference Jiang, Wang, Liu, Sun and Calzavarini2021). When it comes to larger particles, in particular inertial-scale particles, the physics is more complicated due to: (i) the non-smooth character of the flow field at the particle scale, (ii) the spatio-temporal filtering of flow fluctuations associated with the particle size and inertia and (iii) the two-way coupling with the fluid flow. This means that not only the shape (parametrized by
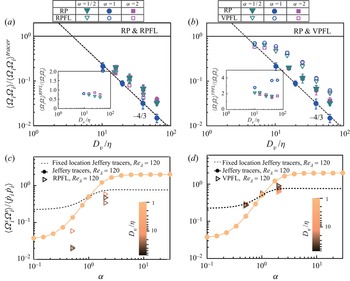
 $\alpha$) but also the particle sizes become relevant parameters of the problem. This is easily grasped in figure 6, where we show the mean square angular velocity, normalized by the value of the mean square angular velocity of point-like JFT with corresponding aspect ratio, as a function of the normalized diameter
 $D_v/\eta$ for RP (solid symbols). As the size increases, we observe that the mean square angular velocity decreases and scales approximately as
 $\langle {\varOmega }_i{\varOmega }_i\rangle \sim (D_v/\eta )^{-4/3}$ for
 $D_v \geqslant 10 \eta$. Since the angular velocity of JFT is nearly constant at changing the aspect ratio (Byron et al. Reference Byron, Einarsson, Gustavsson, Voth, Mehlig and Variano2015), the decrease of angular velocity is primarily an inertial term. Even if an offset between spherical and non-spherical particles is observed, the good collapse for prolate and oblate spheroids with different shapes substantiates the equivalent diameter
 $D_v$ as the relevant characteristic scale also for the rotational dynamics. We recall that the scaling exponent
 $-4/3$ can be dimensionally deduced using the relations of the K41 turbulence theory, specifically, by assuming that the rotation rate is related to the eddy turnover time at the particle scale, as confirmed in experiments with long slender fibres (Parsa & Voth Reference Parsa and Voth2014; Bounoua et al. Reference Bounoua, Bouchet and Verhille2018) and large cylinders (Bordoloi & Variano Reference Bordoloi and Variano2017; Pujara et al. Reference Pujara, Oehmke, Bordoloi and Variano2018).
(a) Mean squared angular velocity, normalized by the results of Jeffery tracers with corresponding aspect ratio, as a function of  $D_v/\eta$ at
 $Re_\lambda =120$. The open symbols denote the results of VA for spheres. The dashed line denotes the fitting line for spheres with scaling exponent
 $-4/3$. Inset shows the ratio of angular velocity variance of VA to that of RP,
 $\langle \varOmega _i\varOmega _i \rangle ^{VA}/\langle \varOmega _i\varOmega _i \rangle$, as a function of
 $D_v/\eta$ for spheres. (b) Mean squared angular velocity, normalized by the results of Jeffery tracers with corresponding aspect ratio, as a function of
 $D_v/\eta$ at
 $Re_\lambda =120$. The open symbols denote the results of VP. The dashed line denotes the fitting line for spheres with scaling exponent
 $-4/3$. Inset shows the ratio of angular velocity variance of VP to that of RP,
 $\langle \varOmega _i\varOmega _i \rangle ^{VP}/\langle \varOmega _i\varOmega _i \rangle$, as a function of
 $D_v/\eta$.

The VA and VP numerical experiments exhibit also a similar behaviour to RP, i.e. a decreasing trend with  $D_v$ consistent with the
 $-4/3$ power law. However, the magnitude of the mean squared angular velocity is larger for VA and VP than that of RP (see again figure 6a,b). This suggests that the rotational dynamics of finite-size neutrally buoyant spheroids (RP) is also dominated by the volume filtering effect, as proven by its scaling behaviour with respect to
 $D_v$, while its amplitude must be affected by other physical effects (to be discussed later). From the insets of figure 6, we note that the angular velocity variance discrepancy between VA and RP and VP and RP is larger than the discrepancy of the acceleration variances. In conclusion, as far as angular velocity is concerned, we cannot say that VPs are a good approximation to RP. This discrepancy is even more important when one looks at the ratio between the intensity of axial as compared with lateral rotational components, that is to say, spinning and tumbling, as we will discuss in the following.
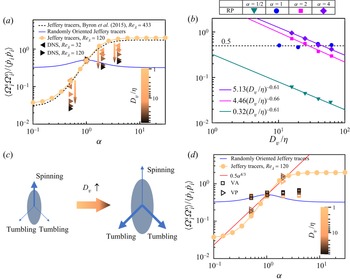
In figure 7(a), we show the ratio  $\langle {\varOmega }_i^{s}{\varOmega }_i^{s}\rangle /\langle \dot {p}_i\dot {p}_i\rangle$ as a function of aspect ratio
 $\alpha$ for particles of different sizes. We first discuss the behaviour of sub-Kolmogorov-scale particles, whose dynamics is well described by the Jeffery equation. In this case, if the particle orientation vector is uncorrelated with the fluid velocity gradients, and
 $\boldsymbol {p}$ is an isotropic vector, upon time and ensemble averaging (2.13), one obtains
 \begin{equation} \frac{\langle {\varOmega}_i^{s}{\varOmega}_i^{s}\rangle}{\langle\dot{p}_i\dot{p}_i\rangle}= \frac{ \frac{1}{12}\langle \omega^{2} \rangle}{\frac{1}{6} \langle \omega^{2} \rangle + \frac{1}{5} \varLambda^{2} \langle \boldsymbol{S}:\boldsymbol{S} \rangle} = \frac{5}{10 + 6 \varLambda^{2}}. \end{equation}
Note that the last equality follows from the statistical properties of the HIT flow, where  $\frac {1}{2} \langle \omega ^{2} \rangle = 2 \langle \boldsymbol{S}:\boldsymbol{S} \rangle = \epsilon /\nu$ (Parsa et al. Reference Parsa, Calzavarini, Toschi and Voth2012; Byron et al. Reference Byron, Einarsson, Gustavsson, Voth, Mehlig and Variano2015). This would produce only a mild variation of the spinning to tumbling ratio across the whole range of aspect ratios, as shown in figure 7(a) (blue solid curve). However, it is known that small particles develop strong correlations with velocity gradients that are responsible for a sharp deviation from this prediction. The present Jeffery model simulations clearly show this behaviour in figure 7(a) (spheres). Incidentally, we note that our results at
 $Re_\lambda =120$ agree with a previous numerical study (dashed line) at
 $Re_\lambda =433$ (Byron et al. Reference Byron, Einarsson, Gustavsson, Voth, Mehlig and Variano2015), underlying the weak
 $Re_\lambda$ dependence of this phenomenon. For spheres, the angular velocity is isotropic and the ratio
 $\langle {\varOmega }_i^{s}{\varOmega }_i^{s}\rangle /\langle \dot {p}_i\dot {p}_i\rangle$ stays around 0.5 for all cases. A marked asymmetry exists between oblate and prolate particle types, while the firsts tumble intensely the seconds are spin dominated, as they tend to align with the vorticity vector (Parsa et al. Reference Parsa, Calzavarini, Toschi and Voth2012; Voth & Soldati Reference Voth and Soldati2017). Furthermore, a saturation of these behaviours is observed in both cases for extreme aspect ratios, i.e.
 $\alpha \lesssim 1/4$ and
 $\alpha \gtrsim 1/4$.
(a) The ratio of spinning rate squared to tumbling rate squared,  $\langle \varOmega _i^{s}\varOmega _i^{s}\rangle /\langle \dot {p}_i\dot {p}_i\rangle$, as a function of aspect ratio
 $\alpha$ for RP. The colour bar represents the normalized particle size
 $D_v/\eta$ in the logarithmic scale. Spheres denote the results for Jeffery tracers. Leftward triangles denote the results at
 $Re_\lambda =32$ and rightward triangles denote the results at
 $Re_\lambda =120$. The arrows denote the direction in which the size of the particles increases. The dashed line shows the results of tracers at
 $Re_\lambda =433$ in Byron et al. (Reference Byron, Einarsson, Gustavsson, Voth, Mehlig and Variano2015). (b) The ratio of mean spinning rate squared to mean tumbling rate squared,
 $\langle {\varOmega }_i^{s}{\varOmega }_i^{s}\rangle /\langle \dot {p}_i\dot {p}_i\rangle$, as a function of size
 $D_v/\eta$. (c) The cartoon illustrates that the weight of the tumbling rate in the angular velocity of prolate spheroids becomes larger as the particle size increases. (d) The ratio of spinning rate squared to tumbling rate squared,
 $\langle \varOmega _i^{s}\varOmega _i^{s}\rangle /\langle \dot {p}_i\dot {p}_i\rangle$, as a function of aspect ratio
 $\alpha$ for VA and VP. The colour bar represents the normalized particle size
 $D_v/\eta$ in logarithmic scale.

What happens when particles have a finite size? A naive K41-based prediction would suggest that the tumbling scales with the length  $\langle \dot {p}_i\dot {p}_i\rangle \sim l^{-4/3}$ and that the spinning scales with the particle diameter
 $\langle {\varOmega }_i^{s}{\varOmega }_i^{s} \rangle \sim 0.5 d^{-4/3}$ (where the 0.5 factor comes from the matching with the spherical case) so that
 \begin{equation} \frac{\langle {\varOmega}_i^{s}{\varOmega}_i^{s}\rangle}{\langle\dot{p}_i\dot{p}_i\rangle} \sim \frac{\alpha^{4/3}}{2} . \end{equation}
However, this prediction falls largely off the result of the simulations, where we see a marked decreasing  $D_v$ dependence of the ratio of the mean square spinning to tumbling rate (see figure 7a,b). Larger particles in proportion spin less and tumble more. This is indeed true for all aspect ratios except for spheres (see figure 7d). It has been pointed out by Oehmke et al. (Reference Oehmke, Bordoloi, Variano and Verhille2021) that these types of dimensional reasonings ignore the decorrelation of the velocity field along the particle surface. The rotation rates stem from the integral of the velocity gradients along the particle surface and, as such, e.g. the spinning rate can be much attenuated in long fibres (
 $\alpha \gg 1$). This integral effect is possibly more important when both the diameter and the length are much larger than the dissipation scale. As a consequence, the scaling behaviours of the spinning and tumbling rates can deviate from K41-based scalings as another characteristic length scale is involved, and the ratio
 $\langle {\varOmega }_i^{s}{\varOmega }_i^{s}\rangle /\langle \dot {p}_i\dot {p}_i\rangle$ is likely a function of the particle size.
The experiments by Oehmke et al. (Reference Oehmke, Bordoloi, Variano and Verhille2021), the only ones to date to have measured both the spinning and tumbling of finite-size particles, find that, for prolate fibres, the variance of the spinning rate is always larger than the variance of the tumbling rate. These authors comment that the observed behaviour ‘surprisingly resembles that observed previously for sub-Kolmogorov fibers’. These observations are fully confirmed by our simulations (see Appendix B for a more detailed comparison). However, we additionally observe a new feature; the ratio  $\langle {\varOmega }_i^{s}{\varOmega }_i^{s}\rangle /\langle \dot {p}_i\dot {p}_i\rangle$ for oblate and prolate spheroids shows systematic decreasing trends as the particle equivalent size increases, and this for both
 $Re_\lambda =32$ and
 $Re_\lambda =120$. For oblate spheroids (
 $\alpha =0.5$), the ratio becomes vanishingly small on increasing their size, which indicates that the oblate spheroids hardly spin when their size is large compared with the dissipation scale. Similarly, prolate spheroids of large size reduce their spinning to the point that it becomes smaller than tumbling (figure 7a).
Figure 7(b) shows the ratio  $\langle {\varOmega }_i^{s}{\varOmega }_i^{s}\rangle /\langle \dot {p}_i\dot {p}_i\rangle$ as a function of the equivalent particle size
 $D_v/\eta$. It is found that the ratio
 $\langle {\varOmega }_i^{s}{\varOmega }_i^{s}\rangle /\langle \dot {p}_i\dot {p}_i\rangle \sim (D_v/\eta )^{-0.6}$ for all considered shapes. We remark that the existence of the observed scaling behaviour of the ratio
 $\langle {\varOmega }_i^{s}{\varOmega }_i^{s}\rangle /\langle \dot {p}_i\dot {p}_i\rangle$ is not certain and calls for future numerical and experimental confirmations. However, this emphasizes that the scaling exponents of the mean square tumbling rate and spinning rate cannot both be equal to
 $-4/3$. To our knowledge, no presently available model accounts for the observed behaviour.
In summary, the main feature connected to the finite size is that larger particles tend to tumble much more than spin (see cartoon figure 7c). Further, we observe that the VA and VP measurements do not have this property. While VA nearly keeps the value of the Jeffery randomly oriented prediction (3.1), VP do not sensibly vary the relative weight of spinning with respect to tumbling and apparently approximately follow the simplistic K41 prediction, (3.2), and (red line) 7(d).
In order to determine the leading physical mechanism responsible for the decrease of  $\langle {\varOmega }_i^{s}{\varOmega }_i^{s}\rangle /\langle \dot {p}_i\dot {p}_i\rangle$, we carry out numerical experiments with particles whose location is fixed, either with the solid–fluid interface or without it, denoted respectively as RPFL and VPFL, as shown in figure 8. The rationale behind fixing the position is to rule out the role of preferential sampling of the flow position (Maxey Reference Maxey1987; Squires & Eaton Reference Squires and Eaton1991; Calzavarini et al. Reference Calzavarini, Kerscher, Lohse and Toschi2008). Indeed, even if this has never been observed, for finite-sized spherical particles (Fiabane et al. Reference Fiabane, Zimmermann, Volk, Pinton and Bourgoin2012), we can in principle not exclude it for non-spherical large particles. On the other hand, a direct measurement of preferential concentration in the present simulations is not an easy task due to the limited number of particles that we could place in the domain.
Mean squared angular velocity, normalized by the results of tracers with corresponding aspect ratio, as a function of  $D_v/\eta$ for the numerical experiments of (a) RPFL and (b) VPFL, compared with the results of RP. Insets show the ratio of the mean squared angular velocity of the numerical experiments to the results of RP as a function of
 $D_v/\eta$. The ratio of the mean spinning rate squared to the mean tumbling rate squared,
 $\langle \varOmega _i^{s}\varOmega _i^{s}\rangle /\langle \dot {p}_i\dot {p}_i\rangle$, as a function of aspect ratio
 $\alpha$ for the numerical experiments of (c) RPFL and (d) VPFL, respectively. The colour bar represents the normalized particle size
 $D_v/\eta$ in logarithmic scale.

We find that the mean normalized rotation rate variance of RPFL scales similarly as RP and has a similar amplitude (see figure 8a). Furthermore,  $\langle {\varOmega }_i^{s}{\varOmega }_i^{s}\rangle /\langle \dot {p}_i\dot {p}_i\rangle$ decreases as the particle size increases (see figure 8c), which is consistent with RP. These results indicate that the possible preferential sampling is not responsible for the decrease of
 $\langle {\varOmega }_i^{s}{\varOmega }_i^{s}\rangle /\langle \dot {p}_i\dot {p}_i\rangle$. To further confirm this point, we show the rotational dynamics of VPFL in figure 8(b,d). Similar scaling behaviour of mean rotation rate squared as a function of particle size is observed, and
 $\langle {\varOmega }_i^{s}{\varOmega }_i^{s}\rangle /\langle \dot {p}_i\dot {p}_i\rangle$ remains constant at the value of the fixed tracers for the corresponding aspect ratio. Since VP do not have a solid interface and do not affect the flow, the results of these two additional numerical experiments suggest that the two-way coupling between the particles and the flow is responsible for the decrease of the ratio
 $\langle {\varOmega }_i^{s}{\varOmega }_i^{s}\rangle /\langle \dot {p}_i\dot {p}_i\rangle$.
3.3.1. The role of particle boundary layers
At this point, given the fact that fully resolved simulations allow us to virtually measure any fluid quantity, one may wonder if it is possible to better characterize the effect of the particle feedback on the flow. With this in mind, we measure the fluid vorticity  $\boldsymbol {\omega }$ and the rate of strain tensor
 $\boldsymbol {S}$ in the boundary layers surrounding the particles. We then compare the relative importance of their intensities. This is performed by computing the variance ratio
 $\tfrac {1}{4}\overline {\boldsymbol {\omega }^{2}} / \overline {\boldsymbol {S}:\boldsymbol {S}}$, where the average is performed over time, ensemble, i.e. multiple trajectories, and over the azimuthal direction in order to improve the statistical convergence. We note that the ratio must have the value 1 in particle-free HIT flow.
Figure 9(a–c) shows three typical fields of the considered ratio around the particle up to the size of  $1.5D_v$. It is found that
 $\tfrac {1}{4} \overline {\boldsymbol {\omega }^{2}} / \overline {\boldsymbol {S}:\boldsymbol {S}} \simeq 1.1$ (vorticity dominated) in a thin shell around the particle, while at immediately larger distances a wider region displays
 $\tfrac {1}{4} \overline {\boldsymbol {\omega }^{2}} / \overline {\boldsymbol {S}:\boldsymbol {S}} <1$ (strain dominated), finally beyond
 ${\sim } 1.5 D_v$ any effect has vanished.
Field of the ratio  $\tfrac {1}{4} \overline {\boldsymbol {\omega }^{2}} / \overline {\boldsymbol {S}:\boldsymbol {S}}$ at (a)
 $\alpha =1$,
 $D_v = 20$ (b)
 $\alpha =0.5$,
 $D_v = 25.1$ and (c)
 $\alpha =2$,
 $D_v =25.1$ at
 $Re_{\lambda } =120$. The colour bar indicates the value of
 $\tfrac {1}{4} \overline {\boldsymbol {\omega }^{2}} / \overline {\boldsymbol {S}:\boldsymbol {S}}$. (d) The ratio of
 $\langle \tfrac {1}{4} \overline {\boldsymbol {\omega }^{2}} \rangle |_{1.5D_v}$ to
 $\langle \overline {\boldsymbol {S}:\boldsymbol {S}} \rangle |_{1.5D_v}$ as a function of
 $D_v/\eta$.

The quantity  $\langle \tfrac {1}{4} \overline {\boldsymbol {\omega }^{2}} \rangle |_{1.5D_v} / \langle \overline {\boldsymbol {S}:\boldsymbol {S}} \rangle |_{1.5D_v}$, where
 $\langle \ldots \rangle _{1.5D_v}$ is a volume average over shells up to
 $1.5 D_v$, for different aspect ratios and particle sizes is reported in figure 9(d). We can observe that the overall effect in the region affected by the particle presence is to decrease the importance of vorticity with respect to strain. This points to the fact that spinning is possibly reduced as a consequence of the reduction of vorticity in the flow surrounding a particle, in qualitative agreement with previous observations. However, we think that more sensitive tests remain to be performed in order to soundly quantify the effect of feedback on the flow.
4. Conclusions
In summary, some statistical properties of the translational and rotational dynamics of neutrally buoyant finite-size spheroids in HIT have been investigated by means of interface-resolved direct numerical simulations. In addition to the simulation of the real system, several extra numerical experiments have been carried out in order to enhance our insight into the essential features of the coupling of the particles with the flow. It is found that non-spherical inertial-scale particles experience spatially volume filtered turbulent fluctuations, similarly to spherical particles, even if the presence of finite-size particles influences the flow around the particle over a region that has similar aspect ratio and an approximate size of 2  $D_v$. The variance of the acceleration of spheroids with different shapes collapses onto a single line when plotted as a function of the equivalent diameter
 $D_v$, and at
 $Re_{\lambda }=120$ a power-law scaling
 $~D_v^{-1}$ is observed. It turns out that the acceleration variance vs particle size of virtual particles and fluid volume averages show a similar scaling behaviour, which proves that the scaling behaviour of the acceleration intensity is dominated by the volume averaging of the acceleration of the flow field. Furthermore, the orientation of particles with size in the inertial range shows preferential alignments with flow structures. This is a novel result in the context of large particles, because it has been previously observed only for particles in the dissipative-scale range of turbulence. We find that the preferential alignment of the particle acceleration shows a negligible size dependence, which suggests a similarity of flow coherent structures in the dissipative to inertial scales.
Next, we studied the rotational dynamics of the particles as their size is increased. The mean square angular velocity of spheroids with different shapes show a clear scaling behaviour with an exponent  $D_v^{-4/3}$, which agrees with predictions based on the K41 theory and with the available experiments (Parsa & Voth Reference Parsa and Voth2014; Bordoloi & Variano Reference Bordoloi and Variano2017; Oehmke et al. Reference Oehmke, Bordoloi, Variano and Verhille2021). However, it turns out that the ratio of the mean square spinning rate to the mean square tumbling rate shows a systematic decrease as the particle size increases, and this is for all considered aspect ratios. To our knowledge, this new feature has never been observed before, and it calls for future experimental verifications. On the basis of the analysis of virtual particles, we interpret this phenomenon as due to the particle feedback on the flow. That is to say to the formation of boundary layers around the particles. In such layers the fluid strain rate is overall increased in comparison with the vorticity, and this favours tumbling instead of spinning.
The present findings improve our understanding of the translational and rotational dynamics of neutrally buoyant finite-size spheroids in turbulence. The results also shed light on a connection between the flow structures at the dissipative scales and inertial scales, which might open a new perspective for the investigation of turbulent flow. We expect that a similar approach to that followed in this study will also be useful for the understanding of the dynamics of particles heavier/lighter than the carrying turbulent fluid flow.
Funding
This work was supported by Natural Science Foundation of China under Grant nos. 11988102 and 91852202, and Tencent Foundation through the Xplorer prize.
Declaration of interests
The authors report no conflict of interest.
Appendix A. Particle acceleration statistics at  $Re_{\lambda } = 32$

In order to validate the numerical results, we carried out simulations at  $Re_\lambda =32$ for spheres, at the same condition as in a previous study (Homann & Bec Reference Homann and Bec2010). Table 3 shows the details of the physical characteristics of the simulated turbulent flow at
 $Re_\lambda =32$ and figure 10 shows the explored parameter space for particles at
 $Re_\lambda =32$. Figure 11(a) shows the single-Cartesian-component acceleration variance,
 $\langle a_i^{2}\rangle$, normalized by the acceleration variance of tracers,
 $\langle a_i^{2}\rangle ^{tracer}$, as a function of normalized particle diameter
 $d/\eta$ (
 $d$ is the diameter of the spheres). Our simulation results show good agreement with the previous study (Homann & Bec Reference Homann and Bec2010) and scale as
 $(d/\eta )^{-4/3}$. At low
 $Re_\lambda$, the scaling exponent is smaller than
 $-2/3$, which is the exponent value expected in HIT at high
 $Re_\lambda$. The dashed-dot line represents the prediction of the Faxén correction based on point-particle simulation under the same
 $Re_\lambda$ (Calzavarini et al. Reference Calzavarini, Volk, Leveque, Pinton and Toschi2012). When the particle is small (
 $d/\eta <4$), the acceleration variance is captured by the Faxén corrections. However, the Faxén correction cannot account for the scaling behaviour of the acceleration variance when
 $d/\eta >7$. The inset shows the p.d.f.s of the acceleration component for the various sizes of the spheres. The effect of the particle size on the p.d.f of acceleration is not significant, which is consistent with previous studies(Xu et al. Reference Xu, Ouellette, Vincenzi and Bodenschatz2007; Brown et al. Reference Brown, Warhaft and Voth2009; Homann & Bec Reference Homann and Bec2010). Figure 11(b) shows the normalized integral time of the temporal correlation function for particle acceleration,
 $T_I/\tau _{\eta }$, as a function of
 $d/\eta$. The integral time
 $T_I$ is defined as the integral of the autocorrelation function from time zero to its first zero-crossing time
 $T_0$
 \begin{equation} T_{I}\equiv\int_{0}^{T_0}C(\tau)\,{\rm d}\tau,\quad C(\tau)\equiv\frac{\langle a_i(t+\tau)a_i(t)\rangle}{\langle(a_i(t))^{2}\rangle} . \end{equation}
Our results are consistent with the correlation time in Homann & Bec (Reference Homann and Bec2010) and show the power-law behaviour  $T_I\sim (d)^{2/3}$. The inset shows the autocorrelation functions for various sizes of spheres, illustrating the increasing autocorrelation time as the size of the sphere increases. In conclusion, the translational statistics of the simulated particles good agreement with the previous study (Homann & Bec Reference Homann and Bec2010), which validates our simulations.
Parameter of the NSE numerical simulations and relevant turbulence scales.  $N^{3}$: number of spatial grid points,
 $\eta =(\nu ^{3}/\epsilon )^{1/4}$: Kolmogorov dissipation length scale in grid space units
 $\Delta x$,
 $\tau _\eta$: Kolmogorov time scale in time-step units
 $\Delta t$,
 $L=u'^{3}/\epsilon$: integral scale,
 $T_L=L/u'$: large-eddy turnover time,
 $\lambda = (15 \nu u' / \epsilon )^{1/2}$: Taylor micro-scale,
 $Re_\lambda$: Taylor–Reynolds number.

Parameter space of particle shapes and sizes in turbulent scale units at  $Re_\lambda =32$. The symbols indicate the numerically simulated particle types. All particles are axisymmetric of diameter
 $d$ and length
 $l$, aspect ratio
 $\alpha =l/d$, with
 $\alpha = 1/2,1,2,4$, the volume-equivalent diameter is
 $D_v = (l d^{2})^{1/3}$. The lengths are here all expressed in terms of the dissipative scale
 $\eta$. The Taylor micro-scale
 $\lambda$ (dashed lines) and the integral scale
 $L$ (dashed-dotted lines) are also reported.

Appendix B. Comparison with the Oehmke et al. (Reference Oehmke, Bordoloi, Variano and Verhille2021) experiments
We provide here a side-by-side comparison of the present simulations with the experiments by Oehmke et al. (Reference Oehmke, Bordoloi, Variano and Verhille2021), which are the only ones to date to have measured both the spinning and tumbling rates of particles. The experimental conditions of developed turbulence at  $Re_{\lambda } \in [90,630]$ and particle aspect ratios
 $\alpha =5.4,7.5,10.8$ are relatively close to the ones explored in the present study. Figure 12(a) shows the ratio of spinning rate variance over tumbling rate variance as a function of the aspect ratio. There is agreement on the dominance of spinning compared with tumbling for prolate (
 $\alpha >1$) particles (note that the isotropic value for spheres is 0.5). However, the decreasing trend on increasing the particle size
 $D_v$, which is clearly observed in the simulations, is only partially consistent with the experiments. Figure 12(b) represents the same measurements in a compensated form: the ratio of rotation rate variances is normalized by the
 $\alpha ^{4/3}$ scaling as in the K41-based prediction (3.2) and plotted against the length of the particle symmetry axis
 $l$ in
 $\lambda$ units. This choice of representation is adapted from figure 5(b) in Oehmke et al. (Reference Oehmke, Bordoloi, Variano and Verhille2021). We observe here an excellent agreement for the behaviour of all prolate particles. However, the decreasing behaviour observed both for prolate and oblate particles stresses further the failure of the (3.2) prediction.
(a) Normalized single Cartesian component of the acceleration variance  $\langle a_i^{2}\rangle /\langle a_i^{2}\rangle ^{tracer}$ as a function of the normalized particle size
 $d/\eta$ at
 $Re_\lambda =32$. Squares denote the results in Homann & Bec (Reference Homann and Bec2010) at the same
 $Re_\lambda$. The dashed-dot line denotes the Faxén correction (Calzavarini et al. Reference Calzavarini, Volk, Leveque, Pinton and Toschi2012). The inset shows the p.d.f.s of acceleration for different sizes. (b) Normalized correlation time of acceleration,
 $T_I/\tau _\eta$, as a function of the normalized particle size
 $D_v/\eta$. Squares denote the correlation time in Homann & Bec (Reference Homann and Bec2010) at the same
 $Re_\lambda$. The inset shows the autocorrelation function of a single Cartesian acceleration component.

Ratio of spinning rate variance over tumbling rate variance: comparison of present DNS results at  $Re_{\lambda }=120$ with the experimental measurements by Oehmke et al. (Reference Oehmke, Bordoloi, Variano and Verhille2021) at
 $Re_{\lambda } \in [90,630]$. (a) Particle rotation ratio as a function of aspect ratio, here the colour code maps the particle size in equivalent radius units. (b) Rotation ratio compensated by
 $\alpha ^{4/3}$ as a function of the particle length (i.e. the symmetry axis)
 $l$ normalized by the Taylor microscale
 $\lambda$ (same as figure 5(b) in Oehmke et al. Reference Oehmke, Bordoloi, Variano and Verhille2021).