


Introduction
The location of catchment boundaries is a major uncertainty in many mass-balance studies. in the case of Ice Stream B, West Antarctica, the poor definition of lateral boundaries contributes largely to the weak confidence in the mass-balance estimate (Whillans and Bindschadler, 1988). Catchment boundaries may be determined from measurements of surface elevation, surface velocity or a combination of both. Until now, there has been no objective assessment of the confidence that can be placed on boundaries so determined or the best strategy of locating a catchment boundary using field measurements.
Fieldwork was conducted in West Antarctica in an effort to locate precisely the boundary between ice ultimately flowing into Ice Stream Β and that flowing into Ice Stream C (Fig. 1). Measurements of surface elevation and surface velocity were collected near the boundary between the catchmems of Ice Streams Β and C.
Particular interest in this region arises because past migration of this boundary has been suggested as a means by which Ice Stream Β “captured” part of the Ice Stream C catchment (Reference RoseRose, 1979; Shabtaic and Bentley, 1987). Determination of the present boundary position would be an important test of the capture hypothesis.
This contribution determines the catchment boundary using field measurements of surface velocity and surface elevation. The major innovation is the development of an objective method for tracking of uncertainties, leading to estimates of confidence in the calculated boundary positions.
Data Collection
During field campaigns between 1984 and 1991, sites on Ice Streams Β and C and in their catchments were surveyed using Transit ("Doppler") and global positioning system (GPS) satellite tracking receivers (Fig. 1). Tracking data are post-processed to obtain precise measurements of position and elevation. Details on Transit survey methods and data reduction are described by Reference McDonald and WhillansMcDonald and Whillans (1988). Similar methods were employed in the GPS work. Most sites were visited at least twice, in order to determine the motion of a surface marker. For sites visited more than twice, velocities are calculated from positions that yield the best precision in velocity. The standard error in horizontal and vertical position at most field sites is ≤1 m. The average time interval between surveys is 3.0 years. This leads to a mean uncertainty in measured velocities of about 0.4 ma1.
Topographic map and measured surface velocities in the upstream and catchment regions of Ice Streams Β and C. Inset shows study area. Stippled regions are major shear margins according to Shahtaie and others (1987). Contour interval is 100 m.

Catchment-Boundary Determination
A catchment boundary is defined by the flowline that passes into neither drainage outlet (Ice Stream Β or G) but instead terminates at its down-glacier end in the nearly stagnant region between outlets (inter-stream ridge B/C). This special flowline may be calculated using measurements of surface elevation or surface velocity. Hrst, we use measured surface velocities, and second elevations.
There are several principles involved in the use of discrete data to define a catchment boundary. First, data sampling is taken to be adequate such that the direction of ice flow varies in a smooth and continuous manner between measurement sites. Faults, such as those that occur at ice-stream shear margins, are not considered important in the catchment area. Secondly, fiow is taken to be parallel to present-day velocity vectors or perpendicular to elevation contours. The last contention is attested to by the Byrd Station Strain Network (BSSN), West Antarctica (Whillans, 1979), where mean flow directions are perpendicular to elevation contours. Thirdly, in the use of velocity measurements, the direction of ice flow measured at the surface is considered to represent the depth-averaged flow direction. Support for this contention is also provided by the BSSN (Whillans, 1977, 1979). Calculated balance speeds along the BSSN vary consistently with measured surface speeds. This indicates little or no divergence between the flow direction at the surface and the flow direction at depth. These are the concepts adopted here for the purpose of catchment-boundary determination.
In the present work, calculai ions begin al a stagnant point between two catchment ouúets. Direct ionsof iccmotioninter-polated from field measurcmentsarc used to progressively calculate a flowline up-glacier. Uncertainties and a correlation distance in these uncertainties are taken into account. Multiple fiowlines are calculated in which interpolated quantities are randomly varied according to their uncertainties. The result is a suite of possible fiowlines. The distribution of this suite of fiowlines determines a most probable boundary location and an estimate ofconfidence in that location.
Measurement Uncertainties
The standard error of measurement in the horizontal component of velocity, au, is linked to the standard errors in horizontal position from the first and second surveys and the time interval between surveys, Δt:

Standard errors σh1 and σh2 are formal errors in the calculation of position and are primarily due to uncertainties in the satellite orbits. The uncertainty in the direction of ice motion at measured sites is

where μ is the measured speed. The mean value of this uncertainty is 1.4° for the present dataset.
Formal measurement uncertainties in elevation are about 2 m for Transit work and 1 m for GPS work.
Short-Scale Fluctuations
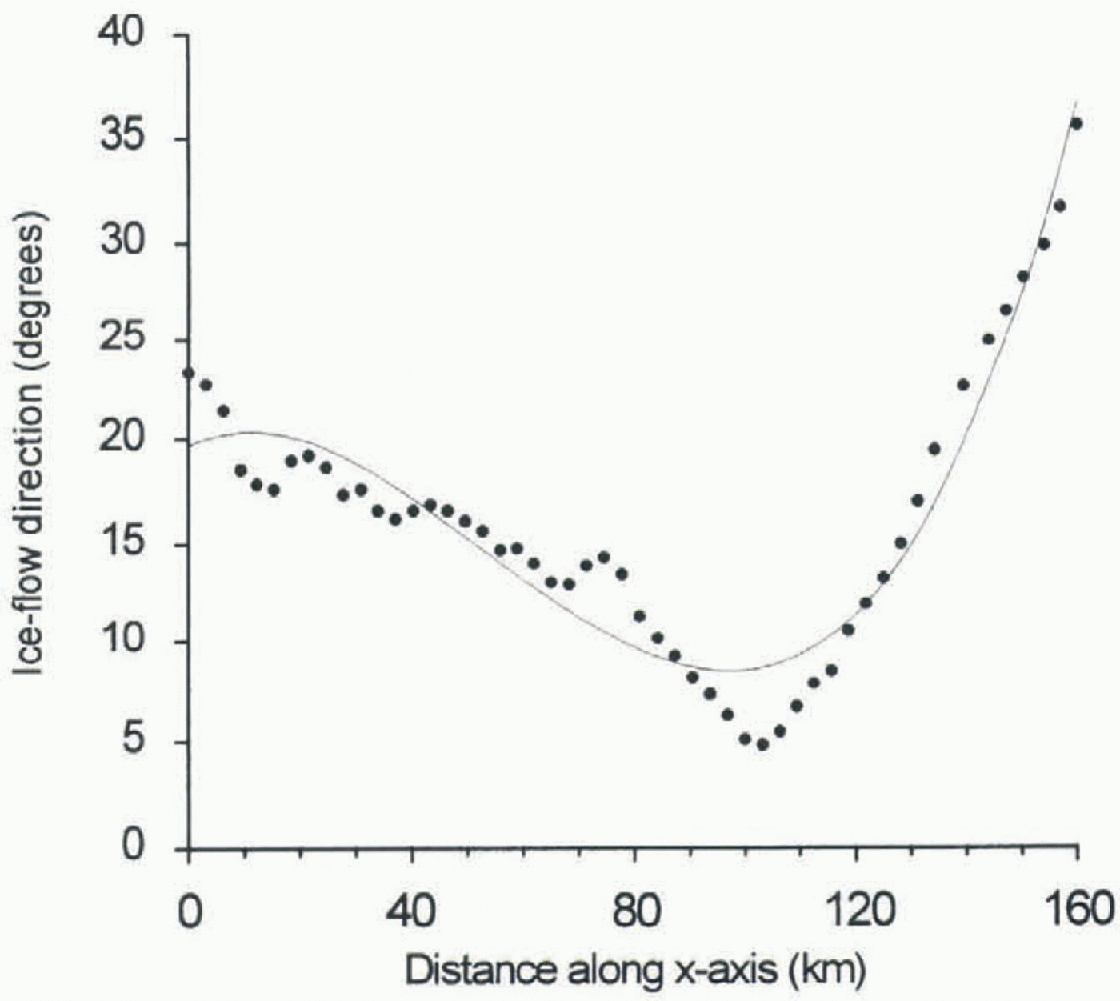
Point measurements of ice-flow direction may not represent the regional value due to ice flow around basal obstacles and over resistive sites. Such fluctuations in flow direction are observed along the 160km long BSSN (Fig. 2). Whillans and Johnsen (1983) attribute these small-scale fluctuations to variations in basal relief and basal friction. There are directional fluctuations on a scale of 10 20 km as well as on a larger scale of 20 to > 50 km. The large-scale trend is described by a third-order polynomial fit. Fluctuations from this trend indicate a standard deviation in ice-flow direction of L0°. This last value is an estimate for the “noise” in flow direction due to localized subglaciol effects.
Ice-flow direction along the BSSN, West Antarctica, Zero degrees is roughly parallel to the strain network axis, oriented in a northeast-southwest direction.
Similarly, point measurements of elevation are influenced by where on a surface undulation the measurement is made. Along the BSSN, deviations from the mean surface are near 0 at the ice divide and as much as 65 m 160 km downslope. The mean fluctuation from the surface is 7.0 m.
Added quadratically, uncertainties due to measurement and local-scale fluctuations contribute a net standard deviation in flow direction of 1.7° for velocity measurements and 3.5° for elevation measurements. These combined uncertainties are negligible relative to the uncertainty associated with large-scale effects, and are neglected henceforth.
Large-Scale Fluctuations
In the current work, the uncertainty due to large-scale fluctuations is dominant. The large-scale (20 to >50 km) uncertainty at any location depends on flow well the regional flow direction is sampled by the data and approximated during data interpolation. The long-distance fluctuation in flow direction along the BSSN, due to velocity and elevation changes, is about 7°. However, the BSSN is too restrictive a sample to provide a meaningful measure in the current work.
A simple model is that the uncertainty in the large-scale flow direction, designated Δθ, increases as data “sparsity”, designated D increases. More specifically, the distribution of possible Δθ values for any D is random, but with a standard deviation that increases as a linear function of D. The “cross-correlation” or “jackknifc” technique (Reference Swan and SandilandsSwan and Sandilands, 1995) is used to estimate flow well large-scale variations in ice-flow direction are sampled by field measurements and modeled by the interpolator. For a set of n data values, the interpolator's ability to accurately predict the value at a new location (n + 1), is considered the same as its ability to predict the value at location n from a set of (n - 1) data values. For a test location, k, the data value is withheld during interpolation of the full dataset. After interpolation, the value predicted by the interpolator at the test location is compared with the true, withheld value at that location. The difference between the two is

in which θk_actual is the direction of ice flow obtained from field measurements at location k, and θk_interpolated is the interpolated value at k when the true value has been withheld from the dataset. The distribution of Δθk values for locations having a similar degree of data sparsity is taken as a measure of uncertainty in flow direction for that degree of data sparsity.
A measure ofdata sparsity at a location is given by

where Dki is distance from the test location, k, to the ith measurement site, and n is the number of values in the data-set. Dk is small in regions of closely spaced data and large in regions of widely spaced data. Tests were conducted for m in the range 1—3. The results are similar to one another. For further analysis, a value of m = 1 is used.
No direct physical significance can be attached to the scale of Dk While distant values contribute very little to the summation in Equation (4), they affect the value of Dk through the factor [1/(n — l)]−1/m. in this case n is fixed, so Dk is a relative measure ofdata sparsity.
For each measurement of velocity and elevation, values of Δθk and Dk are calculated. For the case of velocity measurements, the distribution is presented in Figure 3. As in the proposed model, the variance of Δθk is larger at greater data sparsity. Moreover, small values of Δθk are more numerous than large values, consistent with a normal frequency distribution. The data are consistent with many models, including the one proposed here, σ = ADk, in which the standard deviation increases with data sparsity. The parameter A is chosen such that 68% (1σ) of Δθk values lie beneath the line.
Distribution of Δθk os Dkfor velocity measurements. Spacing of field data is such that no values exist below Dk ≈ 70 km or above Dk ≈ 300 km.

Distribution of Δθk vs Dk for elevation measurements.

There must be an upper limit to the standard deviation in Δθk One estimate of this limit is the standard deviation in flow direction of all catchment-area velocities. This value is 35° and occurs near Dk = 239.
The uncertainty model is then

A similar procedure is used to analyze the variance in flow directions deduced from elevation data (Fig. 4). Flow direction is taken to be perpendicular to elevation contours calculated from the data. Different interpolation algorithms were tested for data contouring (e.g. kriging, radial basis functions, inverse distance, minimum curvature). All yielded similar results. The standard deviation in elevation-measurement-based flow directions is also chosen as the upper limit for Δθk
Parameters determined for the uncertainly model are listed in Table 1.
Autocorrelation Length
The model developed so far describes the magnitude of uncertainty in flow direction. Also needed is a measure of the distance over which directional fluctuations act. Data from the BSSN (Fig. 2) show large-scale directional changes over lengths of 20-50 km. A similar scale of variation occurs in velocity measurements in thejakobshavns drainage basin of West Greenland (Reference Fastook, Brecher and HughesFastook and others, 1995). Phis distance is termed the autocorrelation length. in the model work here, the autocorrelation length is randomly varied between values of 20 and 50 km. The autocorrelation length can be interpreted as the distance scale over which estimated directional fluctuations apply.
Empirically determined parameters for the uncertainty model presented in Equation (5)

Topographie map of the Ice Stream B/C catchment region, indicating boundary position determined using velocity measurements (solidline) and Iσuncertainty limits (dashed line). Solid circles mark elevation-measurement sites. The starting point for calculations is labeled x. Contour interval is 100 m.

Starting Point
The starting point for calculations is defined using the most recent, detailed topographic map of the inter-stream ridge B/C area (Reference Retzlaff, Lord and BentleyRetzlaff and others, 1993). Surface slope in the region is such that this point is known with a precision of about 10 km. Because interpolated ice-flow directions vary slowly with position with in the catchment, a small change in the starting position results in a nearly simple translation of the calculated boundary. This 10 km uncertainty in the boundary starting position is combined quadratically with the large-scale uncertainty described above.
Boundary Calculation
Beginning at the starting point (labeled x in figs 5 and 6), a flowline is calculated up-glacier using interpolated directions of ice flow. Interpolated ice-flow directions fluctuate according to the product of the angular uncertainty (Equation (5)) and a random number selected from a normal distribution about zero. As the calculation proceeds up-glacier, the flow direction and the uncertainty estimate (Equation (5)) vary continuously along the flowline. However, the random number is held constant over a distance corresponding to the selected autocorrelation length. Once calculations are complete along this length, a new random number and autocorrelation length are chosen. Flowline calculation continues up-glacier until the north-south trending ice divide is intersected.
Multiple fiowlines are calculated from the same starting point, but differ because of randomly fluctuated uncertain-tics. The distribution of the resulting suite of fiowlines determines a mean boundary position and an estimate of confidence in that position.
Topographic map of the Ice Stream B/C catchment region, indicating boundary position determined using elevation measurements (solid line) and 1σ uncertainly limits (dashed line).

Results
The calculated catchment boundary between Ice Streams Β and C, based on velocity measurements and 5000 flowline calculations, is displayed in Figure 5. The standard deviation in the boundary position increases nearly linearly with distance as 0.15L, in which L is distance along the boundary from the starting position. This steady increase in standard deviation is a consequence of the nearly constant data sparsity along the boundary. The mean standard deviation in boundary position is 36 km. The standard deviation in catchment area along this boundary is 15000 km2 This is approximately three times the value of the previous estimate made by Whillans and Bindschadler (1988), based on older elevation data.
The corresponding calculation based on elevation measurements and 5000 calculations is shown in Figure 6. Here also, standard deviation increases with distance from the starting point, but as 0.058L. The mean standard deviation in boundary position is 13 km. The standard deviation in catchment area along this boundary is 6000 km2. This value agrees to within 25% of the uncertainty estimate made by Whillans and Bindschadler (1988).
Applying similar levels of uncertainty to the Ice Stream A/B boundary allows for an estimate of uncertainty in the size of the entire Ice Stream Β catchment area (values used for the A/B boundary position and catchment-area size are those determined by Whillans and Bindschadler (1988)). For velocity data, the area is 147(32) x 103 km2. The standard deviation in area is 22%. Using elevation data, the catch-ment area works out to be 147(14) x 103 km2 The standard deviation in area is 9%.
Discussion
The uncertainty estimate determined from elevation measurements is about 40% of that determined from velocity measurements. in part, this could be because there are 25% more elevation measurements in the catchment area than velocity measurements. As the uncertainty is modeled to be proportional to the number and nearness of field measurements, more elevation data lead to narrower confidence limits. However, the discrepancy is much too large to be due to data density alone. The main reason for the discrepancy is that fiowlines determined from velocities are much more variable than fiowlines determined from elevation contours. in terms of the factor A in Table 1, the variability in velocity-determined flow directions is four times that for elevation-determined flow directions.
The reduced variability in flow directions given by elevations may be inherent. While one v elocity measurement is needed to indicate the flow direction at a point, at least three elevation measurements are needed to infer the flow direction. This means that flow directions from elevations are averages over a large area, whereas velocity measurements apply at a specific point. As a result, fiowlines based on elevation measurements are smoother than fiowlines based on velocities. The larger variance observed in velocity-determined flow directions may be due to complex flow conditions that are not adequately sampled by the velocity data. Reference Hodge and DoppelhammerHodge and Doppelhammcr (1996) report on ice-stream segments that extend into the catchments of Ice Streams C and D. There may be other such segments near the Ice Stream B/C boundary. The large variability in velocity-measurement-based flow directions relative to elevation-measurc-mcnt-based flow directions may be evidence of this.
There is also a small difference in the positions of the boundary determined by the two methods. For the most part, these differences fall with in the ranges of uncertainty. The largest difference occurs in the upper part of the catchment area, where the velocity-determined boundary lies to the south of the elevation-determined boundary (figs 5 and 6). The différence is due to measured velocities that are not parallel to the regional surface slope, but are consistently more clockwise (Fig. 1). The offset is larger than subglaciol effects measured along the BSSN allow for (the short-scale uncertainty described above).
This raises the intriguing possibility that the difference in boundary positions may be real, possibly due to migration and evolution of the B/C boundary with time. However, it is difficult to devise a physical process that could account for such a difference. The momentum of the ice is so small that large-scale ice motion should follow the mean surface slope. We therefore discount the proposition that the two sets of flow directions are different in reality, and propose that the calculated differences are due to problems in the sampling of velocities.
Conclusions
The largest contributor to uncertainty in the boundary position is the sparsity of field measurements. Increasing the level of confidence significantly would require a substantial increase in the number of measurements, and thus a much more ambitious field program. High-density data-sets, such as those obtained through radar interfcromelry and radar and laser altimetry, may be expected to yield more precise results.
Using velocity data, the method results in a very large uncertainty, presumably because velocity directions are locally complex. The boundary position and confidence given by elevation data provide belter estimates.
Other catchment areas on polar ice sheets may be defined by a similar level of precision. Applying the cleva-tion-measuremenl-based formula of σ = 0.058L (applied io the lateral boundaries), the standard deviation in the “East Antarctica into the Ross Ice Shelf” catchment area (defined by Bentley and Giovinetto, 1991) works out to be 7% (168(13) x 104km2). For this much larger catchment area, the uncertainty is proportionally similar to that given for the Ice Stream Β catchment.
These new results bring into question the “capture” hypothesis, in which Ice Stream Β caused the stagnation of Ice Stream C by stealing parts of its catchment area (Rose. 1979; Reference Shabtaie and BentleyShabtaie and Bentley, 1987). The boundary determined here (Fig. 6) does not restrict the supply of ice flowing into the head of Ice Stream C. Moreover, velocities in the upper part of Ice Stream C (Fig. 1) are similar to those in the upper part oflce Stream B. It is only the middle to lower regions of Ice Stream G that are nearly stopped. There is no evidence for ongoing capture of the Ice Stream C drainage.
Acknowledgements
Helpful comments were made by K. van der Veen and an anonymous reviewer. Data were collected under a joint Ohio State University and NASA field program. Research was supported by U.S. National Science Foundation grant No. OPP-9316509. This is Byrd Polar Research Center contribuì ion No. 1064.



