1. Introduction
The world population is projected to reach 9.8 billion by 2050, requiring steady growth in the production of food, feed, and bioenergy sources (United Nations, 2009; FAO, Reference FAO2011). The latter is likely to put significant pressure on the natural land cover and it risks causing resource degradation and desertification, potentially leaving little room for soil nutrient regeneration (Vosti and Reardon, Reference Vosti, Reardon, Vosti and Reardon1997; Bai et al., Reference Bai, Dent, Olsson and Schaepman2008; Nkonya et al., Reference Nkonya, Gerber, Baumgartner, von Braun, Pinto, Graw, Graw, Kato, Kloos and Walter2011). Fuglie and Rada (Reference Fuglie and Rada2013) document the fact that the share of fallow land in Africa south of the Sahara has declined steadily over the past 50 years, and a recent report finds that a third of the global land is severely degraded, losing fertile soil at the rate of 24 billon tons per year (UNCCD, 2017).
Previous research has highlighted the potentially severe consequences that resource degradation could exert on vulnerability and poverty of millions of rural households whose livelihoods depend primarily on agriculture.Footnote 1 The interdependence of poverty, the environment, and agriculture also has been considered as a ‘critical triangle’ for achieving economic development (Vosti and Reardon, Reference Vosti, Reardon, Vosti and Reardon1997). In an encompassing literature review, Scherr (Reference Scherr2000) underlines how the existence of a poverty–environment downward spiral remains controversial, given the substantial heterogeneity in individuals' ability to manage resources and adapt to changes. Although some coping strategies, such as the depletion of household assets, can exacerbate poverty (Kazianga and Udry, Reference Kazianga and Udry2006), others may involve diversification into non-farm activities (thereby easing the pressure on land) or may foster investments on improved innovations to simultaneously enhance productivity and protect the natural resource base (Forsyth et al., Reference Forsyth, Leach and Scoones1998; Templeton and Scherr, Reference Templeton and Scherr1999; Davies, Reference Davies2016).
The fact that, after almost 20 years of debate in the literature, we still lack clear evidence of the environment–poverty vicious circle is largely attributable to the scarcity of long panel microdata to credibly test alternative hypotheses. Macro-level analysis shows that poverty and land quality are closely related (Ravallion, Reference Ravallion1994), but to understand the causal mechanisms, georeferenced microdata – rarely available in existing literature – are needed (Malik, Reference Malik1998; Scherr, Reference Scherr2000). For example, Braun (Reference Braun, Vosti and Reardon1997: 70) notes that ‘until poverty becomes adequately georeferenced, linkages among agriculture, environmental degradation, and health and nutrition will not be comprehensively identified, and the ability to guide policy relevant to them will be limited’. Spatial analysis has been proposed for studying these linkages (Berry et al., Reference Berry, Olson and Campbell2003; Gyawali et al., Reference Gyawali, Fraser, Wang and Bukenya2004; Bremner et al., Reference Bremner, Carr, Suter and Davis2010; Dang et al., Reference Dang, Lanjouw and Swinkels2014), but empirical evidence on this relationship also remains limited, seldom observed through the lens of socio-economic analysis (Turner, Reference Turner, Steffen, Jäger, Carson and Bradshaw2002; Barrett and Carter, Reference Barrett and Carter2013).
This study addresses this gap by proposing an innovative approach to examine the link between land use and cover changes (LUCC) and agricultural performance over 20 years (1994–2014) using data from northern Ghana. During this period, not only has the region had disappointing economic performance relative to the rest of the country, but it also has witnessed a high level of resource degradation caused by unsustainable farming practices, deforestation, and urbanization. These economic and physical conditions make it an ideal setting to examine the linkage between LUCC and agricultural performance. The novelty of our approach lies in our ability to combine georeferenced household- and plot-level primary data collected in 2014 with publicly available remotely sensed land-cover data in both 1994 and 2014. Although the cross-sectional nature of the household data makes it arduous to establish causality, our analysis provides insightful evidence of the strong interdependences at play through partial identification.
The rest of the paper is organized as follows. Section 2 outlines the conceptual framework, section 3 describes the study setting, section 4 summarizes the data used in the empirical analysis, and section 5 sketches the identification strategy. Section 6 discusses the results and section 7 concludes the paper.
2. Conceptual framework
A vast literature describes the spatial distribution of poverty in clusters of indigence; in Africa south of the Sahara, as elsewhere, these spaces are often located in rural areas dominated by subsistence farming (Amarasinghe et al., Reference Amarasinghe, Samad and Anputhas2005; Benson et al., Reference Benson, Chamberlin and Rhinehart2005; Minot and Baulch, Reference Minot and Baulch2005; Ayadi and Amara, Reference Ayadi and Amara2009; Lanjouw et al., Reference Lanjouw, Marra and Nguyen2013). Transient poverty is mainly caused by temporary shocks, whereas chronic poverty results mostly from scarcity of productive assets (Barrett, Reference Barrett2005), which in the case of subsistence, farmers are mostly constituted by the natural capital of the land cultivated (Dasgupta et al., Reference Dasgupta, Deichmann, Meisner and David2003; Okwi et al., Reference Okwi, Ndeng'e, Kristjanson, Arunga, Notenbaert, Omolo, Henninger, Benson, Kariuki and Owuor2007). The current state and change of land cover could exert a significant impact on agricultural production and welfare of rural households that heavily depend on farming and livestock for their livelihood (Ikefuji and Horii, Reference Ikefuji and Horii2007; Kangalawe, Reference Kangalawe2009).
To study these linkages, our framework considers three main land-cover classes defined based on their contribution to livelihoods. This classification allows us to examine our hypotheses on the specific LUCC likely to be positively or negatively correlated with rural livelihoods. The first class, which we label natural cover, includes forest, watersheds, shrubs, and savannah, representing areas not transformed by human action. Natural cover is a source of fodder, fuel, food, and timber for adjacent communities; it also plays an important role in land regenerative processes and is a stock of genetic resources for future agricultural needs (Alavalapati, Reference Alavalapati2003; Sunderlin et al., Reference Sunderlin, Dewi, Puntodewo, Muller, Angelsen and Epprecht2008). The second class is defined as productive cover, comprising croplands and urban areas. This class is shaped by human action, being characterized by areas where most of the economic activities take place. Cropland is allocated to agricultural production and livestock breeding, while urban areas host industry and service activities. The third class is bare soil cover. Bare land could encompass either soils depleted by land degradation, or fertile soils in areas cleared at the time of data acquisition (e.g., owing to deforestation). As such, the link between bare soils and level of soil fertility is an empirical question.
The three land-cover classes create nine possible land-cover trajectories between the 2 years, with some of them more frequent than others in line with the literature (Vitousek et al., Reference Vitousek, Mooney, Lubchenco and Melillo1997; Lambin et al., Reference Lambin, Geist and Lepers2003; Mustard et al., Reference Mustard, Defries, Fisher, Moran, Gutman, Janetos, Justice, Moran, Mustard, Rindfuss, Skole, Turner and Cochrane2012). Two of these trajectories are dominant in northern Ghana. The first is a change from natural cover to productive cover, mostly due to human activity (Wood et al., Reference Wood, Tappan and Hadj2004; Braimoh and Vlek, Reference Braimoh and Vlek2005; Braimoh, Reference Braimoh2009). The second is a change from natural cover to bare soils, due to both natural and human factors.
Shifting from natural cover to productive cover is expected to improve production and productivity up to a certain point, beyond which the increased scarcity of natural resources will start to negatively impact livelihoods (Coomes et al., Reference Coomes, Takasaki and Rhemtulla2011). A change from natural to productive cover first and then to degraded land will negatively impact agricultural productivity (Berry et al., Reference Berry, Olson and Campbell2003; Bhattacharya and Innes, Reference Bhattacharya and Innes2006; Diao and Sarpong, Reference Diao and Sarpong2011), which in turn may result in a drop in total expenditure unless the household is able to react by investing in conservation practices or diversifying into off-farm activities. Moreover, these relationships might be non-linear and affected by economic, environmental, and institutional factors (Wiebe, Reference Wiebe2003). The empirical analysis examines how different LUCC between 1994 and 2014 are correlated with agricultural performance in 2014.
3. Study setting
About 40 per cent of the global land surface is already allocated to cropland and pastures. Africa south of the Sahara experienced relatively high rates of agricultural expansion over the period 1961–2005 (Foley et al., Reference Foley, Defries, Asner, Barford, Bonan, Carpenter, Chapin, Coe, Daily, Gibbs, Helkowski, Holloway, Howard, Kucharik, Monfreda, Patz, Prentice, Ramankutty and Snyder2005; Nkonya et al., Reference Nkonya, Pender, Kaizzi, Kato, Mugarura, Ssali and Muwonge2008). Despite this expansion, about 65 per cent of the region's arable land is deemed to be too degraded for sustainable food production, posing serious challenges for supporting the growing population (Montpellier Panel, 2014). This threat could be especially severe in arid and semi-arid environments, such as the savannah region of West Africa (Pinstrup-Andersen and Watson, Reference Pinstrup-Andersen and Watson2010), where desertification is more prominent. When soils become so degraded that they severely hamper farming, people tend to migrate into areas with no previous agricultural production, typically characterized by low potential. In addition, farmers tend to apply traditional agricultural practices, which might prove detrimental in a different environment (Cleaver and Schreiber, Reference Cleaver and Schreiber1994).
The north of Ghana accounts for 40 per cent of the country's land area, where 80 per cent of the population relies primarily on agriculture. In contrast with the rest of the country, poverty rates in this area have remained high and stable over the past decade. For example, whereas the national average poverty rate fell from 56 to 24 per cent between 1992 and 2013, the poverty ratio in the northern region declined by only six percentage points (56 to 50 per cent) and is ranked the highest in the country (Cooke et al., Reference Cooke, Hague and McKay2016). The area is also affected by severe land degradation caused by unsustainable farming practices such as the dominant bush-fallow rotation system, clearing of natural vegetation cover, and growing urbanization (Braimoh and Vlek, Reference Braimoh and Vlek2005; Diao and Sarpong, Reference Diao and Sarpong2011; World Bank, 2011). Additionally, chemical fertilizer use is limited, with a relatively high dependence on natural soil fertility management (Braimoh and Vlek, Reference Braimoh and Vlek2005). Moreover, the northern two-thirds of the country is covered by savannah (a tropical grassland with a scattering of shrubs and trees), featuring shea trees, acacias, and baobabs. These characteristics create an ideal setting to empirically examine the effects of LUCC on household welfare and identify potential entry points for intervention.
4. Data
4.1 Land-cover classification
Land-cover classification in 1994 and 2014 is produced using Landsat (Landsat 5 and Landsat 8) satellite images from the United States Geological Survey that cover the entire area of northern Ghana.Footnote 2 The year 1994 is selected as the baseline year since the quality of satellite imagery was significantly lower before the 1990s, rendering it difficult to identify different land-cover types at an adequate resolution. Furthermore, whereas 1991/92 and 1995 were characterized by abnormally intense floods (Codjoe and Owusu, Reference Codjoe and Owusu2011), 1994 can be considered a normal year in terms of climatic conditions such as rainfall and temperature.
The classification is obtained by assigning one of the seven land-cover classes defined by the Food and Agriculture Organization (FAO) to each 30-by-30 m pixel within each image (Campbell and Wynne, Reference Campbell and Wynne2011). The seven classes considered are: bare soil, cropland, forest, savannah, shrubs, urban settlements, and water bodies. For each year, satellite data from different growing periods are used to take into account seasonal variation in the classification. For example, cropland changes drastically between growing and harvest seasons, and the size of water bodies varies significantly between rainy and dry seasons. For this reason, each classification is based on four images that capture seasonal variationFootnote 3 and, within each image, on several spectral bands that are sensitive to different spectral properties.
A maximum likelihood (ML) classification algorithm is applied to the 2014 classification (Johnson and Wichern, Reference Johnson and Wichern1988). The algorithm considers both variance and covariance of the classes across the ground-truthing points and extrapolates the classification to the remaining pixels. Under the normality assumption, a class can be characterized by mean and covariance matrix. Given these two characteristics, the probability of each cell belonging to any of the seven classes is computed, and each cell is assigned to the class showing the highest probability of occurrence. The heterogeneity in the 2014 land-cover types is analyzed through the iterative self-organizing data (ISODATA) classification algorithm, where pixel-level observations are clustered into smaller groups based on the reflectance values of the spectral bands (Tou and Gonzalez, Reference Tou and Gonzalez1974).
Ground-truthing points are collected from different sources. For cropland, they are taken from georeferenced boundaries of 278 plots as part of the household survey we collected (discussed in section 4.2), while the ground-truthing points for the remaining six classes are identified through Google Earth. In total, about 200 ground-truthing points for each land-cover type are collected across three study regions, of which two-thirds are used to train the classification algorithm and the rest are used for validation.
To evaluate the quality of the land-cover classification in 2014, an accuracy assessment of the prediction is needed. Thus, one-third of ground-truthing points not used to train the algorithm are used to assess the statistical accuracy of the entire classification as well as the assignment of individual classes. Results from the accuracy assessment show an overall accuracy of over 70 per cent with urban, forest, and water bodies classes associated with a relatively high accuracy rate (above 90 per cent).
The methodology used for the 2014 classification cannot be directly applied to 1994 owing to the lack of historical ground-truthing points (Mostseller and Tukey, Reference Mostseller and Tukey1977; Richards, Reference Richards2013). As a result, the 1994 images are analyzed through unsupervised classification methods using the ISODATA classification algorithm, which clusters pixels into groups based on their reflectance values of the spectral bands (Tou and Gonzalez, Reference Tou and Gonzalez1974). Because different land-cover types exhibit unique spectral properties, the ISODATA unsupervised classification algorithm takes advantage of the spectral properties of pixels and groups them based on their similarities. In a second step, the ML classification matches the spectral profiles identified in 2014 with the spectral properties of the 1994 land classes to identify the same classes. Finally, initial land-cover classifications have been updated based on feedback from local experts.
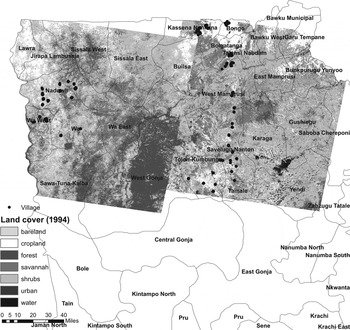
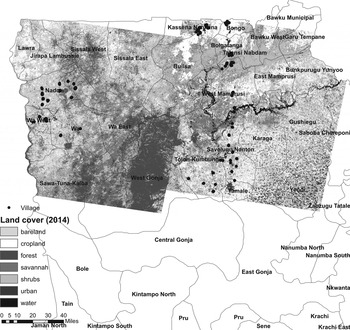
Figures 1 and 2 illustrate the results of this land classification exercise. An expansion in crop and bare land across the three regions at the expense of shrubs and grassland is visible, implying agricultural extensification. Indeed, as discussed below, land conversion from vegetation to crop or settlement (henceforth, productive cover), as well as from bare land to productive cover, are the two most common changes we observe between 1994 and 2014.
Map of 1994 land cover classification.

Map of 2014 land cover classification.

4.2 Socio-economic and biophysical data
The Ghana Africa RISING Baseline Evaluation Survey (IFPRI, 2015) is the primary microdata used in the empirical analysis. Conducted in 2014, this survey includes detailed socio-economic data collected from 1,285 agricultural households drawn from 50 communities from the upper east, upper west, and northern regions. Agricultural data refer to the cropping season from April 2013 to December 2013. The Global Positioning System (GPS) coordinates of the survey households as well as the boundaries of 287 agricultural plots were collected from a subsample of survey households that were subsequently used to validate crop land classification.
Two outcome variables – maize yield (tons/hectare (tons/ha)) and value of harvest (Ghanaian Cedi (GHC)) – as well as several socio-economic variables that may affect these outcomes are constructed. The conditioning variables include household demography, wealth (land holding, livestock wealth in Tropical Livestock Unit, and household and agricultural durable assets), plot characteristics, agricultural input use and practices, and access to basic services. Indices of durable assets and access to services are constructed using factor analysis (principal-component factor method) following Filmer and Pritchett (Reference Filmer and Pritchett2001). Access to basic services is based on self-reported travel time to selected infrastructure (such as asphalt and all-weather roads) and services (such as weekly and daily market places and bus stops) using the usual mode of transportation.
As discussed in the conceptual framework, both poverty and population pressure can lead to unsustainable land practices that could negatively impact welfare. To account for these factors, we control for regional poverty rate and district population, both growth rate and baseline value. Regional poverty statistics are computed from two rounds (repeated cross-sectional) data of the nationally representative Ghana Living Standards Survey (1998/99 and 2012/13) collected by the Ghana Statistical Services (GSS), roughly around the time of the land-cover data (1994 and 2014). District-level population data are calculated from two census data sets (2000 and 2008) collected by GSS (available from Minnesota Population Center, 2017). We control for gridded data on the length of growing period (measured in days, at five arc-minutes resolution) (Guo, Reference Guo2013) and travel time to the nearest town of at least 20,000 people (measured in hours, at 1 km resolution) (Guo and Cox, Reference Guo, Cox and Sebastian2014) as a proxy for agricultural potential.
4.3 Household–land-cover mapping
Land cover can be mapped to georeferenced households in many ways. One option is to map each household to the land-cover type assigned to the 30-by-30 m pixel (p) in which it is located, based on its GPS location. Alternatively, different buffer zones can be defined around the pixel of the household location. In the latter case, a question arises regarding the size of the buffer zone as well as the assignment rule when there are multiple land classes per buffer zone. The wider the buffer zone, the better the information on the affecting environment, especially given the reported travel time between the homestead and the closest plot owned by the household (30 min on average). Nonetheless, a wider buffer zone is likely to result in overlapping pixels for neighboring households, thereby reducing the variation across pixels.
For comparability, we initially consider four buffer zones based on 9p (3 pixels wide and 3 pixels tall around the homestead), 25p (52p), 49p (72p), and 81p (92p). Next, a land class is assigned to a given buffer zone if the class accounts for the highest share of the pixelated zone. Figure 3 summarizes the shares of each land class. Due to challenges in distinguishing shrubs from savannah covers based on Google Earth, we have merged these two types. Crop land, savannah/shrubs, and bare soils were the three most dominant types in 1994; cropland, savannah/shrubs, and urban were most common in 2014. These trends are consistent with recently released land-cover maps (Hackman et al., Reference Hackman, Gong and Wang2017). As these patterns are largely consistent across the four buffer zones, the subsequent analysis focuses on the 25p buffer zone.
Share of land cover types by year and buffer zone.

Figure 4 summarizes the three (regrouped) land classes consistently with the conceptual framework: natural cover (forest, shrubs, savannah, and watersheds), productive cover (crop land and settlement), and bare soils. Productive cover accounted for about 50 and 70 per cent of land area in 1994 and 2014, respectively, with both natural cover and bare soils declining during the reference period (figure 4A). Given the three land-cover types, there will be nine (32) possible change combinations between 1994 and 2014. In our case, <5 per cent of the sample is mapped to three changes: productive cover (in 1994) to bare soils (in 2014), bare soils to productive cover, and bare soils in both years. Owing to their small sample, these three groups are excluded from the subsequent analysis.
Reclassified land cover types (level and change) (25-pixel buffer zone)

Figure 4B shows the incidence of LUCC over time. Areas with productive cover (crop land or settlement) in both years (productive-productive) are the most common, followed by changes from natural to productive cover (natural-productive) and from bare soils to productive cover (bare soils-productive). Irrespective of the state of land use in 2014, areas with natural cover in 1994 are associated with both higher harvest value (figure 5A) and yield (figure 5B), relative to areas with either productive cover or bare soils at baseline.
Land cover change, harvest value and yield (25-pixel buffer zone)

5. Identification strategy
Given the dominance of agriculture in the study area, household welfare is expected to be highly correlated with agricultural production, measured here using total value of harvest (in GHC) and, to a lesser extent, productivity proxied by maize yield (in tons/ha). These outcomes could be affected not only by household-level characteristics but also by landscape-level environmental factors that could in turn induce spatial autocorrelation (see Paraguas and Kamil, Reference Paraguas and Kamil2005, for a general discussion). If unaccounted, spatial autocorrelation in outcome variables (spatial lag) introduces measurement errors with ordinary least-squares estimates, thereby producing biased and inconsistent parameter estimates (LeSage, Reference LeSage1999). In addition, the spherical disturbances assumption would be violated if the model disturbances are spatially correlated (spatial error), thereby producing inefficient estimates. In our case, pixel-based indicators of LUCC could also introduce a bias since, by construction, the buffer zones of neighboring households could overlap.
To explore spatial autocorrelation, we first perform Moran's I test of spatial correlation (Moran, Reference Moran1950; Jeanty, Reference Jeanty2012) that shows a positive correlation between the two outcomes and LUCC variables and their spatial lags. For a given (n × 1) vector X, its spatial lag is computed by averaging the values of the variable for ‘neighboring’ units and Moran's I statistic given by  $\displaystyle{n \over {\sum\nolimits_i {\sum\nolimits_i {w_{ij}} } }} \times \displaystyle{{\sum\nolimits_i {\sum\nolimits_j {w_{ij}} } \left( {X_i - {\bi \bar X}} \right)\left( {X_j - {\bi \bar X}} \right)} \over {\sum\nolimits_i {{\left( {X_i - {\bi \bar X}} \right)}^2} }}\;$, where n is the number of observations, w ij parameterizes the distance between i and j,
 $\forall \, i\comma \; \, j$ and w ij = 0 for i = j, and
 $\bar{\bi X}$ is the average computed over n. In this study, the weight w ij is defined by 1/d ij, where d is the geographic distance (in kilometers) between the residence of households i and j, defined based on the GPS coordinates of i and j. Under the null hypothesis of no spatial autocorrelation, Moran's I has an asymptotically normal distribution with expectation (−1/n − 1) and values ranging between −1 and +1, so that values near −1 (+1) suggest high negative (positive) spatial autocorrelation, while those near zero imply weaker autocorrelation. Moran's I test results show the presence of positive spatial lag, with autocorrelation coefficients ranging from 0.04 to 0.26.
For the multivariate analysis, we follow a nested approach and specify a spatial first-order autoregressive (SAC) model (Kelejian and Prucha, Reference Kelejian and Prucha1998; LeSage, Reference LeSage1999; Drukker et al., Reference Drukker, Prucha and Raciborski2013b, Reference Drukker, Prucha and Raciborski2013c) that also includes spatially lagged LUCC variables, as shown in equation (1).
 $$\matrix{ {\bf y} \hfill & { = \rho {\bf Wy} + \sum\limits_{k = 1}^5 {\beta ^k} {\bf LC}{\bf C}^k + \sum\limits_{k = 1}^5 {\phi ^k} {\bf WLC}{\bf C}^k + {\Lambda }^{\prime}{\bf Z} + {\bf \varepsilon }\comma \; } \hfill \cr }$$
 $$\matrix{ {\bf \varepsilon } \hfill & { = \lambda {\bf M\varepsilon } + {\bf u}\comma \; } \hfill \cr }$$
where y is an nx1 vector of either outcome variable – harvest value and maize yield – with n indexing sample size; W is an nxn spatial weighting matrix with elements w ij = 1/d ij, with d ij as defined above; LCCk ( $\forall k=1\comma \; \ldots\comma \; 5\rpar $ is a column vector of indicators for the five LUCC variables summarized in section 4.3, with the bare soils-productive combination used as the reference category; Z is an nxp matrix of household- and landscape-level conditioning variables discussed in section 4.2, where we progressively increase its elements to check for sensitivity; ε is an nx1 vector of error terms allowed to be spatially correlated as modeled in equation (2); and
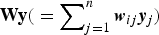 ${\bf Wy}{\rm (} = \sum\nolimits_{j = 1}^n {{\bi w}_{ij}{\bi y}_j} {\rm )}$ and
 ${\bf WLC}{\bf C}^k{\rm (} = \sum\nolimits_{j = 1}^n {w_{ij}{\bf LCC}_{ij}^k } {\rm )}$ are the first-order spatial lags of y and LCCk, respectively.
Equation (2) models the disturbance terms as a spatially weighted average of the disturbances of the other households; M is an nxn spatial-weighting matrix with elements m ij = 1/q ij such that m ij = 0 if i = j and m ij = 1/q ij, where q ij parameterizes the distance between i and  $j \ \forall i\comma \; j$ once gain measured in kilometers; Mε is a spatial lag of ε; and u is an nx1 vector of errors assumed to be independently and identically distributed. As is commonly done in empirical applications (see Kelejian and Prucha, Reference Kelejian and Prucha2010; Drukker et al., Reference Drukker, Prucha and Raciborski2013b, for general discussion), we assume that W = M. Although the values of the spatial-weighting matrix are sometimes truncated, Drukker et al. (Reference Drukker, Peng and Prucha2013a) note that truncation should be applied only if supported by theory. The weighting matrix is row-standardized (W*) so that W* × T = T, where T is an nx1 vector with elements
 $t_{ij} = 1 \forall \, i\comma \; \, j$.
The parameters ρ and λ are the spatial autoregressive parameters to be estimated,Footnote 4 along with β k and ϕ k (∀ k), Λ, and the standard deviation of the model disturbance – σ. If  $ \hat \rho $ is statistically significant but
 $\widehat{\lambda}$ is insignificant, the SAC model reduces to a spatially autoregressive-dependent variable (spatial lag) SAR model with
 $ \hat \rho $ measuring the ‘multiplier effect’. If the opposite holds, the SAC model reduces to a spatially autoregressive lagged disturbance (spatial error) SEM model.
Equations (1) and (2) are estimated using ML (Jeanty, Reference Jeanty2012; Drukker et al., Reference Drukker, Prucha and Raciborski2013c). Lagrange multiplier tests we conducted (Paraguas and Kamil, Reference Paraguas and Kamil2005) fail to reject the null that the SAR model is nested in the SAC model; that is, we could not reject that  $\widehat{\lambda}$ is zero. The χ2 tests also do not reject that the coefficients of the spatially lagged land-cover trajectory variables (WLCC) are jointly zero. In the next section, therefore, we present ML estimates of equation (1) without controlling for WLCC and report White–Huber standard.
Finally, observed relationships between LUCC and agricultural productivity in 2014 may merely be an artifact of how long the land has been cultivated. As a sensitivity analysis, we therefore re-estimate a version of equation (1) that controls for 1994 land-cover type, as opposed to LUCC between 1994 and 2014. Given that the multivariate analysis is based on cross-sectional micro data, we acknowledge that these analyses do not establish causal attribution, but instead provide suggestive evidence on the linkage between LUCC and agricultural performance.
6. Results and discussion
Tables 1 and 2 report ML estimates of the model for total value of harvest and maize yield, respectively, based on the 25p buffer zone. Different specifications are estimated, where the set of conditioning variables increases progressively. The parameter estimate  $ \hat \rho $ (rho) is positive and consistently significant across the different specifications, suggesting the existence of a multiplier effect among neighboring households. Such spatial dependence could be driven by homogeneity in crucial determinants of agricultural performance, such as soil quality, weather condition, and (physical) access to production technologies and factors.
Land-cover change and harvest value ('000 GHC)

Coef, coefficient estimates; SE, standard errors; GHC, Ghanaian Cedi.
Notes: *** p < 0.01, ** p < 0.05, * p < 0.1. Reported are heteroscedasticity-robust standard errors. The omitted category is bare soils–productive trajectory.
Land-cover change and maize yield value (tons/ha)

Coef, coefficient; SE, standard errors.
Notes: *** p < 0.01, ** p < 0.05, * p < 0.1. Reported are heteroscedasticity-robust standard errors. The omitted category is bare soils–productive trajectory.
Table 1 shows that most socio-economic variables have the expected correlation with harvest value, including positive relationship with household wealth; agricultural inputs, including chemical fertilizers; agricultural labor; irrigation; and better-quality soil, proxied by the share of black and brown soil that is high in organic matter. Female household headship, travel time to basic services, and exposure to soil erosion are all negatively correlated with harvest value. Results from the most parsimonious specification show that, relative to households living in bare soils-turned-productive areas (reference group), those in natural-turned-productive areas have higher harvest value by about 1,021 GHC (table 1, column 5).
This is equivalent to 969 in constant 2011 international $ (purchasing power parity (PPP)). Similarly, natural-turned-productive cover is associated with higher maize yield (0.17 tons/ha) than bare soils-turned-productive cover, significant at the 10 per cent level (table 2, column 5). These results are notably robust to different specifications (columns 2–4 of table 1 for harvest value and of table 2 for maize yield).
These findings may imply the influence of past land-cover type on current agricultural performance through its effect on soil quality. Northern Ghana has been affected by a relatively high level of land degradation owing to unsustainable farming practices, such as the dominant bush-fallow rotation system, the removal of natural vegetation cover, the low adoption of soil and water management practices, and urbanization (FAO, 2000; World Bank, 2007; Nkegbe et al., Reference Nkegbe, Shankar and Ceddia2011). All the same, even though natural-turned-productive covers are associated with better agricultural outcomes, the overexploitation of productive land, especially in the absence of conservation practices, could reverse the association in the long term.
Results from our sensitivity analysis once again show that areas under savannah or shrubs in 1994 have a higher maize yield and harvest value in 2014, relative to areas identified as bare soils at baseline, all other things being equal. Depending on the model specification, harvest value was 521–1,003 GHC higher (equivalent of $495–$952 PPP), whereas maize yield was higher by 0.14–0.17 tons/ha.Footnote 5 These results are consistent with the estimates from the main model that controls for LUCC between 1994 and 2014, from which conversion from a vegetation cover in 1994 (mostly savannah and shrub land) to productive land in 2014 (mostly crop land) is associated with higher maize yield and harvest value than conversion from bare soils to productive land.
Before concluding the paper, and as a way of identifying areas for future research, we note the following limitations of this study. Owing to the lack of ground-truthing points, we could not use the ML algorithm to classify baseline land-cover types. Instead, we first used unsupervised learning to identify pixels in 1994 that have similar spectra patterns as those in 2014. Subsequently, pixels from the same location with similar spectra patterns are assumed to represent similar land-cover types. To the extent that this assumption does not hold, baseline land-cover classification and the results thereof would be prone to measurement error.
Another potential source of measurement error is the difficulty in discerning urban settlement and bare soils in small villages with relatively low urbanization, as is mostly the case in the study area. The identification of the buffer zone around the homestead is also an empirical challenge. If plots are scattered and relatively far away from the homestead, the 25p buffer zone may be too narrow to adequately capture the land-cover type relevant for livelihood. Without georeferenced historical socio-economic data, we are also unable to simultaneously examine trends in LUCC and agricultural productivity to control for potential confounding factors and establish a causal mechanism. Finally, and given our sampling frame, we caution that our findings may not hold in other parts of Ghana or beyond.
7. Conclusion
Existing environmental science literature highlights the causal nexus from poverty to resource degradation, where degradation can worsen and perpetuate poverty through its effects on yields, water quality, reduced physical capacity, market participation, and climate. However, LUCC can have a multifaceted effect on poverty and vulnerability through its environmental impact, the quantity and quality of natural resources, and ecosystem service in general. In this paper, we addressed that gap in the economics literature: to assess the effect of LUCC on agricultural productivity in northern Ghana, a region that has simultaneously experienced both a relatively high poverty rate and severe natural resource degradation.
By combining remotely sensed data with cross-sectional georeferenced primary household survey data, we examined how LUCC between 1994 and 2014 affected agricultural performance in 2014. Methodologically, we demonstrated how availability of georeferenced plots associated with their characteristics based on traditional in-person interview could help refine land-cover classification based on remotely sensed data. In addition, we showed how the unsupervised land-cover classification method can be applied to historical land-cover data when past ground-truthing points are not available.
Our land-cover maps for 1994 and 2014 showed a significant expansion of agricultural land and, to some extent, bare soils at the expense of natural vegetation and watersheds. ML estimation of a spatial first-order autoregressive model allowing for spatial lag shows that households in areas with former natural cover (forest, shrubs, savannah, or watersheds) that later became productive cover (crop land or settlement) report higher maize yield (0.17 tons/ha) and harvest value (1021 GHC, equivalent to $969 in 2011 PPP) relative to their counterparts in areas converted from bare soils to productive cover.
Although these results do not establish a causal mechanism, they suggest the importance of historical land-cover conditions in affecting current agricultural performance. Extensification into areas with natural cover may be associated with higher agricultural performance in the short term, but overexploitation of productive cover that prevents the regeneration of soil nutrients can reverse the positive outcome, especially when supportive sustainable natural resource management practices are inadequate. Therefore, further research is needed to assess the evolution of LUCC, soil quality, and agricultural productivity using additional data points to establish attribution and help identify promising entry points to sustainably promote agricultural productivity and rural livelihoods.
Acknowledgments
This study was conducted as part of the Africa Research In Sustainable Intensification for the Next Generation (Africa RISING) program, funded by the United States Agency for International Development (USAID). The authors thank three anonymous reviewers for their insightful feedback on the draft manuscript. The views expressed here belong to the authors, and do not necessarily reflect those of IFPRI, CGIAR, USAID, or Africa RISING partners.