Colorectal cancer (CRC) meets the requirements for mass screening. In the European Union, it is one of the most frequent cancers in both sexes with an estimated 380,000 new cases and 205,000 deaths in 2006 (Reference Boyle and Ferlay6). Despite advances in diagnostic techniques and treatment, 5-year survival remains poor (Reference Berrino, De Angelis and Sant4). However, it can be cured when detected early (10) and even prevented by the removal of adenomas (Reference Citarda, Tomaselli and Capocaccia8;Reference Winawer, Zauber and Ho32). In this context, mass screening could decrease colorectal cancer mortality and incidence. Three European population-based controlled studies have demonstrated that it is possible to reduce colorectal cancer mortality using a biennial unrehydrated guaiac fecal occult blood test (G-FOBT) followed by colonoscopy in case of a positive test (Reference Faivre, Dancourt and Lejeune14;Reference Hardcastle, Chamberlain and Robinson18;Reference Kronborg, Fenger and Olsen21). They reported a 15–18 percent reduction in CRC mortality after an average follow-up of 10 years.
Although the G-FOBT presents high specificity, it has been criticized for its poor sensitivity (Reference Gyrd-Hansen, Sogaard and Kronborg16;Reference Jouve, Remontet and Dancourt20;Reference Launoy, Smith, Duffy and Bouvier22). The introduction of more sensitive tests could be attractive. This is particularly the case of immunochemical fecal occult blood tests (I-FOBT). They are based on the use of a specific antibody of human hemoglobin. These tests have been developed to offer improved diagnostic performance (Reference Guittet, Bouvier and Mariotte15;Reference Morikawa, Kato and Yamaji26). Until now, no studies have attempted to estimate the reduction in colorectal cancer mortality associated with the use of I-FOBT. Moreover, few studies have compared the cost-effectiveness of I-FOBT with those obtained with G-FOBT and followed health economics guidelines (Reference Angell-Andersen, Tretli and Coleman1;Reference Berchi, Bouvier and Réaud3;Reference Shimbo, Glick and Eisenberg28).
Thus, the aim of this study was to use a simulation model to estimate the effectiveness and the cost-effectiveness of biennial CRC screening based on G-FOBT and I-FOBT in the general population compared with the absence of screening.
MATERIALS AND METHODS
General Description of the Decision Model
A state-transition Markov model was developed to assess the effectiveness, and the cost of different screening strategies for CRC. This model has already been described and validated (Reference Lejeune, Arveux and Dancourt24). The Markov model allowed us to simulate disease progression through several specified health states of a population of 100,000 individuals aged 50 to 74 invited to participate in a screening program and monitored over a 20-year period or until the age of 85 or until death. Five health states were modeled: absence of CRC or adenoma, CRC, large adenoma (1 cm or more in diameter), death from CRC, and death from another cause. At each new cycle of 1 year, subjects could move from one state of health to another through predefined probability transitions, and the model estimated how many subjects were in each state. Thus, at the end of the study period, the model was able to estimate the cumulative number of CRC-related deaths, the cumulative number of life-years lost from CRC and the cumulative cost of the screening strategies.
Screening Strategies
Three strategies were compared: absence of screening, screening with the three-stool unrehydrated G-FOBT (Hemoccult-II; Beckman Coulter Inc, Fullerton, CA, USA) performed on three consecutive stools and repeated every 2 years, and screening with I-FOBT (Instant-view; Alpha Scientific designs, Poway, CA, USA) performed on two stools and repeated every 2 years.
Data used in the Markov model were mostly obtained from two studies conducted in Burgundy (France): a controlled study comparing G-FOBT screening to the absence of screening and a study comparing the performance of a G-FOBT (Hemoccult-II) and an I-FOBT (Instant-view) within a population-based screening program. The design and the results of these studies have already been reported (Reference Dancourt, Lejeune and Lepage11;Reference Faivre, Dancourt and Lejeune14).
Epidemiological Parameters of the Model
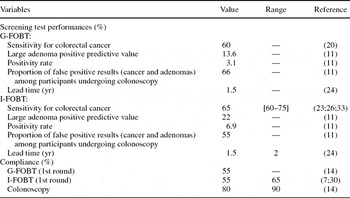
All epidemiological parameters required by the model are shown in Table 1.
Baseline Values of Epidemiological Parameters Used in the Model

G-FOBT, unrehydrated guaiac fecal occult blood test; I-FOBT, immunochemical fecal occult blood test.
Diagnostic Performances of Screening Tests
Diagnostic performances of the G-FOBT and I-FOBT were directly provided by data from the results of the Burgundy study (Reference Dancourt, Lejeune and Lepage11). The diagnostic performance of the screening tests included the positivity rate and the positive predictive value for large adenomas. Given uncertainty concerning the prevalence of large adenomas in the general population, the positive predictive value was used to predict the number of adenomas larger than 1 cm that will be detected during screening campaigns among individuals accepting colonoscopy after a positive screening test. Sensitivity for cancer was used in the model to estimate the number of cancers detected by the screening tests among participants in the screening campaigns. Sensitivity for cancer associated with G-FOBT was obtained from the Burgundy study, which aimed to assess the reduction in CRC mortality due to G-FOBT compared with the absence of screening (Reference Jouve, Remontet and Dancourt20). Sensitivity for cancer associated with I-FOBT was the only data obtained from international studies (Reference Launoy, Bertrand and Berchi23;Reference Morikawa, Kato and Yamaji26;Reference Zappa, Castiglione and Paci33).
Participation
An acceptability rate of 55 percent associated with the use of G-FOBT and obtained from the Burgundy trial was included in the model (Reference Faivre, Dancourt and Lejeune14). This rate was also considered appropriate for I-FOBT.
Natural History of the Disease
Most of the parameters used to represent the natural history of the disease and taken into account in the model were obtained from the Burgundy study (Reference Faivre, Dancourt and Lejeune14), and supplemented when necessary by data from international studies. To determine the number of CRCs diagnosed in the control group, the observed annual incidence of CRC in the area was used. To determine the number of detectable CRCs in the screening cohort, the model estimated the prevalence of detectable CRCs for each screening campaign. For a given screening campaign, the estimation of this prevalence depended on the observed annual CRC incidence, and on asymptomatic detectable CRCs which would have remained undiagnosed in the absence of screening. These asymptomatic detectable CRCs represent the real benefit of the screening program. The estimation of their number depends on the sojourn time and the lead time which have to be estimated by the model. The sojourn time is defined as the time period during which the cancer is asymptomatic but detectable by a screening test. The lead time is the part of the sojourn time by which the diagnosis of cancer has been brought forward by screening. Using data from the Burgundy study (Reference Lejeune, Arveux and Dancourt24), the sojourn time for G-FOBT was estimated to be 2.5 years and the lead time 1.5 years. The lead time was considered similar for I-FOBT.
It was also assumed that colorectal cancers would arise from adenomas larger than 1 cm. The estimation of the number of these cancers was based on the cumulative risk of cancer in subjects with an adenoma larger than 1 cm left in situ over a 20-year period (Reference Stryker, Wolff and Culp29), and on the reduction in the incidence of CRC after removal of a large adenoma (Reference Jorgensen, Kronborg and Fenger19).
On the basis of the results of the Burgundy study (Reference Faivre, Dancourt and Lejeune14), the model also used the distribution of CRC by stage in screen-detected cancers, interval cancers, cancers in nonresponders, cancers in the control group, and the corresponding survival rates.
Cost Data Used in the Model
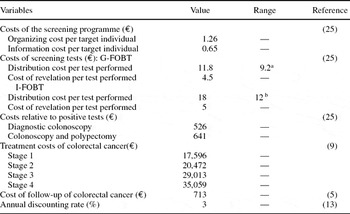
The cost-effectiveness analysis was conducted on the basis of costs to the French Health Care Insurance system. Only direct costs were considered in the analysis. They are expressed in 2006 prices (€). All costs are summarized in Table 2. They included the following:
(i) The cost of organizing the screening program, including labor and equipment. It was similar for G-FOBT and I-FOBT screening programs. This cost was calculated from data from the Burgundy trial (Reference Lejeune, Arveux and Dancourt25).
(ii) The cost of informing and inviting the population was also similar for the two screening tests. This cost was also calculated using data from the Burgundy study. It included the design and printing of the invitation letter and of the information leaflet sent at the beginning of each screening campaign, the manpower for preparing the mail and postage, the training cost of general practitioners (GPs), and the cost of informing the entire medical profession (Reference Lejeune, Arveux and Dancourt25).
(iii) The distribution cost varied according to the test used. It included the cost for tests conducted during a normal consultation with a GP (taking into account the purchase price of the test kit and a special fee paid to GPs according to the number of tests received at the central analysis center, therefore, depending on participation in the screening program), the cost of the test sent by mail if the screening test was not performed during the medical phase (test kit, letter, envelope, instruction for use, stamp), and the cost of a reminder letter. The purchase price of the G-FOBT kit was €2.87 in 2006. Using information provided by the manufacturer, the purchase price of the I-FOBT kit was estimated to be €6.00 in 2006.
(iv) The cost of test revelation in a centralized analysis center included overhead costs, capital expenditure, running costs, and labor. The process cost also included the cost of sending test results to the participants and to their GPs. Using micro-costing methods, the revelation costs was estimated to be €4.50 for the G-FOBT and €5.00 for the I-FOBT with a 55 percent participation rate.
(v) The cost of a colonoscopy performed after a positive test. The cost of colonoscopy in case of polypectomy was estimated to be €641. The cost of a diagnostic colonoscopy performed among patients with false positive results was estimated to be €526 (Reference Lejeune, Arveux and Dancourt25).
(vi) The cost of follow-up after large adenoma resection was similar to the cost of a diagnostic colonoscopy as patients undergo surveillance colonoscopy 3 years after the polypectomy (Reference Lejeune, Arveux and Dancourt25).
(vii) The cost of follow-up of treated CRCs was calculated from a retrospective cohort of individuals living in Burgundy who underwent colorectal cancer resection in 1998, and were followed over a 3-year period (Reference Boulin, Lejeune and Le Teuff5). It was estimated to be €713 per patient on average.
(viii) The average cost of treatment of CRC by stage was estimated to be €17,556 for stage 1, €20,472 for stage 2, €29,013 for stage 3, and €35,059 for stage 4 (Reference Lejeune, Arveux and Dancourt25).
Baseline Values and Ranges of Economic Parameters Used in the Model

aThe calculation of the distribution cost per G-FOBT was based on a purchase price of €1.50, instead of the baseline value of €2.87.
bThe calculation of the distribution cost per I-FOBT was based on a purchase price of €3, instead of the baseline value of €6.
G-FOBT, unrehydrated guaiac fecal occult blood test; I-FOBT, immunochemical fecal occult blood test.
The cost of the screening program was calculated as the sum of all the costs described above. The cost in the absence of screening was calculated as the sum of the cost of CRC treatment, and the cost of follow-up of treated CRC.
Effectiveness Criteria
Mortality Estimation. The first effectiveness criterion assessed by the Markov model is the reduction in CRC mortality associated with G-FOBT compared with no screening, and the reduction in CRC mortality associated with I-FOBT compared with no screening. Mortality rates for CRC were calculated within each cohort as the number of deaths divided by the person-years of observation. The ratio of mortality rates allowed us to calculate the reduction in mortality.
Estimation of Life-Years Gained. The difference between the number of life-years lost due to CRC in the G-FOBT cohort and the control cohort allowed us to calculate the number of life-years gained by using G-FOBT compared with absence of screening. A similar calculation was made for I-FOBT. Life-years lost were estimated from CRC-related deaths and life-expectancy.
Cost-Effectiveness Results. The cost-effectiveness analysis was based on the determination of an incremental cost-effectiveness ratio (ICER). It was calculated by dividing the incremental costs by the incremental life-years lost from CRC-related deaths between two strategies. Life-years gained and costs were discounted at an annual rate of 3 percent. Undiscounted results are also presented. Uncertainties related to epidemiological and economic data were processed using sensitivity analyses. For the I-FOBT, plausible ranges for sensitivity for cancer and the lead time were tested. An analysis was also performed on the purchase price of G-FOBT and I-FOBT.
RESULTS
Base-Case Analysis
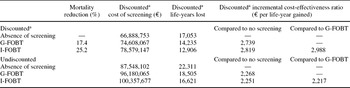
Compared with no screening, all strategies reduced CRC mortality over a 20-year period in a cohort of 100,000 subjects over 50. Screening with G-FOBT decreased CRC mortality by 17.4 percent compared with no screening, and I-FOBT decreased CRC mortality by 25.2 percent.
Compared with no screening, screening with both G-FOBT and I-FOBT decreased the number of life-year lost due to CRC at a reasonable cost (Table 3): G-FOBT was associated with a discounted gain of 2,818 life-years per 100,000 and with an incremental cost-effectiveness ratio of €2,739 per life-year gained. I-FOBT was the most effective strategy, gaining 4,147 life-years per 100,000 compared with no screening with an incremental cost-effectiveness ratio of €2,818 per life-year gained. Compared with G-FOBT, I-FOBT presented a discounted incremental cost-effectiveness ratio of €2,988 per life-year gained. Undiscounted results are also given in Table 3.
Estimated Costs, Effectiveness and Incremental Cost-Effectiveness Ratios of Biennial screening with Chemical and Immunochemical Tests over a 20-Year Period

aAn annual discount rate of 3% was used.
G-FOBT, unrehydrated guaiac fecal occult blood test; I-FOBT, immunochemical fecal occult blood test.
Cost Distribution of Biennial Screening
Considering cost distribution, the management of adenomas (diagnosis, treatment, and surveillance) was twice as high when I-FOBT were modeled (14.5 percent of total costs) as with G-FOBT (6.4 percent of total costs). Inversely, the proportion of costs related to CRC treatment and follow-up was lower with I-FOBT compared with G-FOBT (73.2 percent and 83.8 percent, respectively). The cost of the screening campaign by itself accounted for, respectively, 12.3 percent and 9.8 percent of the overall costs (Supplementary Figure 1, which is available at www.journals.cambridge.org/thc2010003).
Sensitivity Analyses
The value of key epidemiological and economic parameters was changed. However, whatever the variation in the values of the parameters tested, I-FOBT remained the most effective and most costly screening strategy compared with the absence of screening and compared with G-FOBT, with discounted ICERs remaining below €3,000 and €3,600 per life-year gained, respectively.
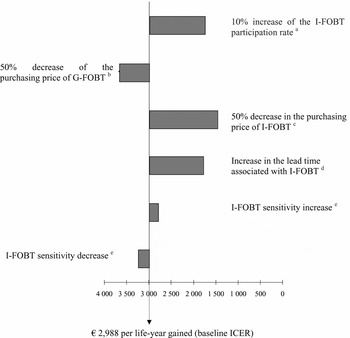
The influence of epidemiological and economic parameters on the incremental cost-effectiveness ratio of I-FOBT when compared with G-FOBT is presented in Figure 1, and when compared with the absence of screening is presented in Supplementary Figure 2, which is available at www.journals.cambridge.org/thc2010003. The epidemiological parameters with the strongest influence on the incremental cost-effectiveness ratio of I-FOBT were the lead time and the participation rate to screening. The baseline hypothesis of the model was a lead time of 1.5 years whatever the screening test (Reference Lejeune, Arveux and Dancourt24). Because I-FOBT is more sensitive than G-FOBT, we attributed a lead time of 2 years. In this case, when compared with the absence of screening, the I-FOBT ICER was estimated to be €2,336 per life-year gained instead of €2,819 per life-year gained, that is to say a decrease of 17 percent. When compared with G-FOBT, the ICER with I-FOBT was decreased by 40 percent (€1,787 per life-year gained instead of €2,988 per life-year gained).
Impact of changes in values of epidemiological and economic parameters on the discounted cost-effectiveness ratio of immunochemical fecal occult blood test (I-FOBT) compared with unrehydrated guaiac fecal occult blood test (G-FOBT).aThe participation rate for I-FOBT was increased by 10% (65% instead of 55%). bThe baseline purchase price of I-FOBT was €6. A price of €3 was tested. cThe purchase price of G-FOBT was decreased by 50% (€1.5 instead of €2.87). dThe baseline lead time for G-FOBT and I-FOBT was 1.5 years. A 2-year lead time for I-FOBT was tested. eSensitivity of I-FOBT (baseline value of 65%) was tested in the [60%–75%] range.

Several authors showed that the participation rate can be higher for I-FOBT than for G-FOBT (Reference Castiglione, Zappa and Grazzini7;Reference van Rossum, van Rijn and Laheij30). The baseline participation rate to screening in the model was 55 percent for both tests. In the sensitivity analysis, a 10 percent increase of the participation rate for I-FOBT was tested, leading to a 42 percent decrease of the ICER compared with G-FOBT. A sensitivity analysis was also performed on the compliance rate for colonoscopy performed after a positive test. Results showed that a 10 percent increase (90 percent instead of 80 percent) did not affect the cost-effectiveness ratio estimated to be €2,996 per life-year gained instead of €2,988 per life-year gained (results not shown).
The sensitivity of I-FOBT was obtained from international studies, and it is known to be higher than that of guaiac tests. Baseline I-FOBT sensitivity was 65 percent. Increasing sensitivity to 75 percent led to an ICER of €2,760 per life-year gained compared with the absence of screening while decreasing it to 60 percent led to an ICER of €2,886. These figures were €2,801 and €3,219, respectively, per life-year gained when compared with G-FOBT.
Among economic parameters, only the purchase prices of G-FOBT and I-FOBT were tested. This analysis was justified by the continuing fall in the purchase price of screening tests. The baseline price of G-FOBT was €2.87. A decrease of 50 percent (€1.50) led to an increase in the ICER for I-FOBT of 18 percent when compared with G-FOBT (€3,660 instead of €2,988 per life-year gained). A similar analysis was performed with the purchase price of I-FOBT. The baseline price used was €6. When we assumed a fall to 3 €, the I-FOBT ICER decreased by 18 percent when compared with the absence of screening and by 51 percent when compared with G-FOBT with a price fixed at €2.87.
DISCUSSION
Colorectal cancer screening using G-FOBT has been found to be effective (Reference Faivre, Dancourt and Lejeune14;Reference Hardcastle, Chamberlain and Robinson18;Reference Kronborg, Fenger and Olsen21) and cost-effective (Reference Gyrd-Hansen17;Reference Lejeune, Arveux and Dancourt25;Reference Whynes, Neilson, Walker and Hardcastle31) compared with no screening. Results of the present study suggest that I-FOBT performed on two stool samplings can be considered an appropriate alternative to a biennial G-FOBT with regard to effectiveness as well as cost-effectiveness when compared either with the absence of screening or with G-FOBT. When compared with G-FOBT, discounted I-FOBT ICER was estimated to be €2,988 per life-year gained. Taking the UK threshold level of £20,000 per QALY, the ICER of our study can be considered as acceptable (Reference Devlin and Parkin12). To our knowledge, no studies have attempted to estimate mortality reduction associated with I-FOBT. The validity of our conclusions depends on the validity of our model. Our model's prediction of a 17.4 percent reduction in colorectal cancer mortality with the G-FOBT is consistent with available data (Reference Faivre, Dancourt and Lejeune14).
Comparison of our results with other published results is difficult. Different studies have compared different immunochemical tests with G-FOBT: Hemeselect, OC-Hemodia, Monohaem, Iatro Hemcheck, and Magstream. Most of these are no longer commercialized. Moreover, few studies respected guidelines published by health economists (Reference Drummond and Jefferson13): some studies calculated average cost-effectiveness ratio instead of incremental ratios; while in others, no details were provided either on sensitivity analyses, or on cost references, or on the study point of view. To our knowledge, only three studies that satisfied the guidelines could be compared with our results (Reference Angell-Andersen, Tretli and Coleman1;Reference Berchi, Bouvier and Réaud3;Reference Shimbo, Glick and Eisenberg28). However, the Australian (Reference Angell-Andersen, Tretli and Coleman1) and the Japanese studies (Reference Shimbo, Glick and Eisenberg28) assessed the efficiency of an immunochemical test (Hemeselect) which was no longer produced in 2008. The most recent study was French. It aimed to compare the Hemoccult-II with the Magstream test. The cost-effectiveness analysis was based on data from a study conducted in Normandy, and was really close to the design of our work (Reference Berchi, Bouvier and Réaud3). In this study, the biennial two-stool Magstream test was compared with the biennial G-FOBT over a 20-year period and provided an ICER of €2,980 per life-year saved compared with G-FOBT. An almost identical result was found in our work (€2,988 per life-year gained).
The sensitivity analyses performed in our work showed the robustness of the results, all ICERs remaining largely below €3,600 per life-year gained. Moreover, unreasonable and unrealistic values for economic and/or epidemiological parameters would have been required to reach the maximum accepted value of £20,000 per QALY.
The sensitivity analyses showed the strong influence of lead time and participation rate to screening. The introduction of lead time in the simulation model is an original aspect of this work compared with other already published cost-effectiveness analyses. Lead time is not observable and has to be estimated. In a previous study, we estimated the mean lead time associated with G-FOBT at 1.5 years (Reference Lejeune, Arveux and Dancourt24). There are few data and a great deal of uncertainty concerning the lead time that should be attributed to immunochemical tests. To our knowledge, only one study is available. It estimated that a one-stool I-FOBT anticipated colorectal cancer diagnosis by approximately 2.5 years (range, 1.7–4.4 years) (Reference Castiglione, Zappa and Grazzini7). In our sensitivity analyses, we applied a lead time of 2 years. Results showed that the introduction of a longer lead time in the model improved the effectiveness because CRCs were detected at an earlier stage which is associated with higher survival. Therefore, the cost-effectiveness ratio of immunochemical tests was decreased. Participation rate to screening was shown to be another important parameter, a 10 percent increase leading to an ICER of €1,741 per life-year gained compared with G-FOBT (instead of €2,988 per life-year gained at baseline).
No sensitivity analyses were performed on the treatment costs because a published study demonstrated they have no impact on the ICER (Reference Lejeune, Arveux and Dancourt25). Moreover, we did not take into account in the model the adverse effects due to colonoscopy. Some studies have estimated that the overall risk of complications for routine colonoscopy was extremely low (Reference Arora, Mannalithara and Singh2). Additionally, despite I-FOBT higher positivity rate compared with G-FOBT, we considered that the impact of colonoscopy complications on the cost-effectiveness ratio would have been marginal. Finally, we did not assess the impact on the cost-effectiveness results of a change in the positivity rate of I-FOBT. This is due to the fact that Instant-View cannot be totally considered as a quantitative test because the positivity threshold cannot be modified automatically.
To conclude, this work can be used to better understand the place of immunochemical tests as surrogate screening tests to G-FOBT. The introduction of a biennial two-stool I-FOBT, such as the Instant-View test, could be an interesting alternative to the G-FOBT, considered at the moment as the reference mass screening test in Europe (27). However, the decision to implement a mass screening program using the I-FOBT should also take into consideration the positivity rate threshold as a parameter that could influence financial and human resources raising.
SUPPLEMENTARY MATERIALS
Supplementary Figure 1
Supplementary Figure 2 www.journals.cambridge.org/thc2010003
CONTACT INFORMATION
Catherine Lejeune, PhD (catherine.lejeune@u-bourgogne.fr), Associate Professor, Vincent Dancourt, MD, (vincent.dancourt@wanadoo.fr), Doctor, University of Burgundy, 7, bd Jeanne d'Arc, BP 87900, 21079 Dijon cedex, France
Patrick Arveux, MD, PhD (parveux@dijon.fnclcc.fr), Doctor, Georges-François Leclerc Center, University of Burgundy, EA 4184, 1, rue Professeur Marion BP 77980, 21079 Dijon cedex, France
Claire Bonithon-Kopp, MD, PhD (bonithon@u-bourgogne.fr), Professor, Jean Faivre, MD, PhD (jean.faivre@u-bourgogne.fr), Professor, University of Burgundy, 7, bd Jeanne d'Arc, BP 87900, 21079 Dijon cedex, France