Introduction
Fishery bycatch ranks as the top threat by impact to populations of albatrosses and large petrels/shearwaters (Croxall et al. Reference Croxall, Butchart, Lascelles, Stattersfield, Sullivan, Symes and Taylor2012, Dias et al. Reference Dias, Martin, Pearmain, Burfield, Small, Phillips and Yates2019). Recognized as a serious global concern, it threatens 17 of the 22 albatross species with extinction and puts an additional seven petrel species under elevated risk (IUCN 2020). With K-selected life history strategies, these impacted species have relatively long lifespans, slow growth, late maturation, low fecundity, and low natural mortality rates, making them particularly vulnerable to even low levels of anthropogenic mortality (Croxall and Rothery Reference Croxall, Rothery, Perrins, Lebreton and Hirons1991, Musick Reference Musick1999, Lewison and Crowder Reference Lewison and Crowder2003, Barbraud et al. Reference Barbraud, Marteau, Ridoux, Delord and Weimerskirch2008). Of all the seabird species that have been documented interacting with fishing gear, over half of them interact with hook gear, i.e. longlines and handlines (Pott and Wiedenfeld Reference Pott and Wiedenfeld2017). Specifically, longline fisheries are responsible for at least 160,000 seabird mortalities annually (Anderson et al. Reference Anderson, Small, Croxall, Dunn, Sullivan, Yates and Black2011).
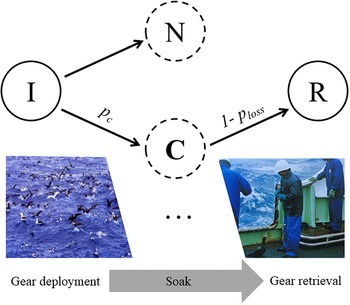
Formal knowledge of the extent and scale of seabird bycatch mainly draws upon two sources: 1) the observation of seabird interactions (or contacts) with fishing gear (I in Figure 1) and 2) the observation of retrieved carcasses (R in Figure 1). Both are common areas of research and monitoring, with the former common in studies on seabird interactions with fisheries and mitigation (Boggs Reference Boggs, Melvin and Parrish2001, Gilman et al. Reference Gilman, Boggs and Brothers2003, Bull Reference Bull2007, Gilman et al. Reference Gilman, Brothers and Kobayashi2007, Favero et al. Reference Favero, Blanco, García, Copello, Seco Pon, Frere and Quintana2011, Domingo et al. Reference Domingo, Pons, Jiménez, Miller, Barceló and Swimmer2012, Melvin et al. Reference Melvin, Guy and Read2014) and the latter common in large scale regional and national observer programmes, such as the Pelagic Observer Program in the western North Atlantic (Diaz et al. Reference Diaz, Beerkircher and Restrepo2009) and the Pacific Islands Region Observer Program in the Pacific Ocean (DiNardo Reference DiNardo1993). However, neither provides a direct measure of the underlying bycatch risk because of the way seabirds are captured in longline fisheries and how these captures are recorded in a typical observer programme. Other, more indirect evidence of seabird bycatch may come from band returns from beached carcasses (Dunn and Mead Reference Dunn and Mead1982), interviews with fishers (Merkel Reference Merkel2004, Deroba et al. Reference Deroba, Butterworth, Methot, De Oliveira, Fernandez, Nielsen and Cadrin2015) or hook recovery from birds at nesting colonies (Nel and Nel Reference Nel and Nel1999, Phillips et al. Reference Phillips, Ridley, Reid, Pugh, Tuck and Harrison2010).
Seabird interactions (I) and retrieved carcasses (R) are routinely observed to assess bycatch risk in pelagic longline fisheries. By themselves, these observations only provide indirect measures of incidental captures (C) of seabirds. Many interactions are not risky, i.e. they do not result in captures (N). Those captured during gear deployment (C) are subject to loss during the remainder of the gear deployment, soak period and gear retrieval. For each interaction, pc denotes the probability of its capture; ploss denotes the probability of a capture becoming lost before it can be recorded by an observer present at gear retrieval. Interactions between species of different sizes and foraging capabilities can be intense during gear deployment especially when birds are present in large numbers (lower left photo); the photo on the right shows a White-chinned Petrel carcass hauled aboard during gear retrieval.

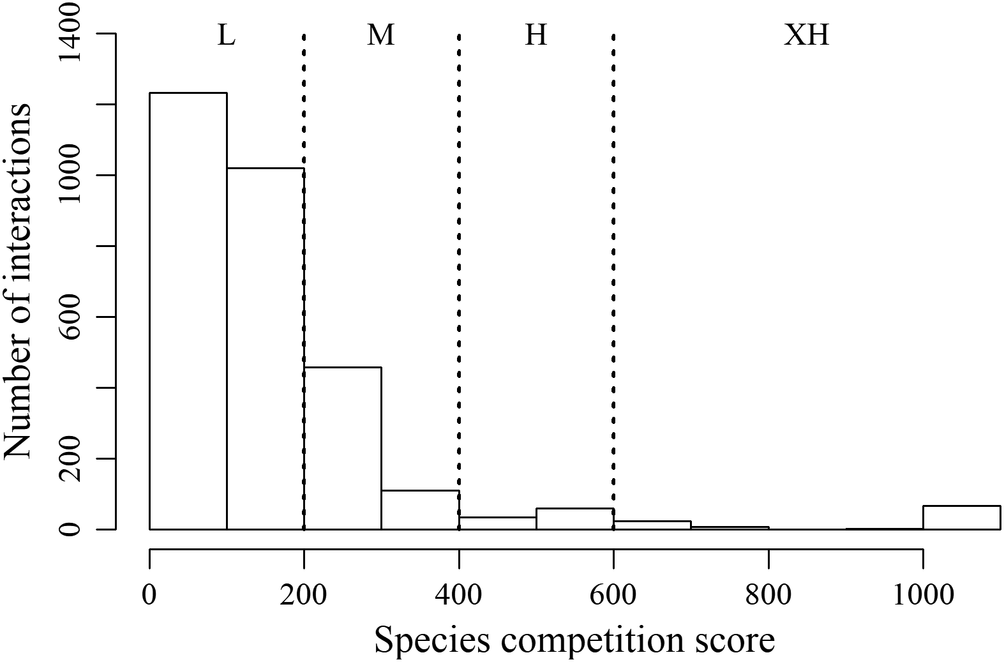
Histogram of species competition score. L: low competition, M: medium competition, H: high competition, and XH: extra-high competition.

Seabirds foraging near longline fishing vessels are vulnerable to incidental capture primarily during gear deployment and to a lesser extent during gear retrieval when baited hooks are accessible near the surface (Camphuysen et al. Reference Camphuysen, Calvo, Durinck, Ensor, Follestad, Furness and Garthe1995, Gilman et al. Reference Gilman, Brothers and Kobayashi2005, Dietrich et al. Reference Dietrich, Melvin and Conquest2008, Brothers et al. Reference Brothers, Duckworth, Safina and Gilman2010, Robertson et al. Reference Robertson, Candy, Wienecke and Lawton2010, Brothers Reference Brothers2016, Pott and Wiedenfeld Reference Pott and Wiedenfeld2017). Those captured during gear deployment are subject to substantial loss (c. 50%) during the remainder of gear deployment, soak period and gear retrieval (Brothers et al. Reference Brothers, Duckworth, Safina and Gilman2010), and those captured during gear retrieval may also fail to be hauled aboard because of crew interference (Gales et al. Reference Gales, Brothers and Reid1998). Most fishery observer programmes only monitor catch/bycatch during gear retrieval, and as a result, those captured but dropped off or depredated, i.e. cryptic bycatch (Gilman et al. Reference Gilman, Suuronen, Hall and Kennelly2013), are absent from routine observations. Due to this issue, the current estimate of seabird bycatch in longline fisheries grossly underestimates the real bycatch risk (Brothers et al. Reference Brothers, Duckworth, Safina and Gilman2010, Anderson et al. Reference Anderson, Small, Croxall, Dunn, Sullivan, Yates and Black2011).
Many metrics have been used to measure seabird bycatch rate, but they stop short of providing a direct measure of the underlying capture risk. Bycatch rate, or more properly carcass retrieval rate, by far the most commonly used measure, especially for data generated from observer programmes (Anderson et al. Reference Anderson, Small, Croxall, Dunn, Sullivan, Yates and Black2011, Zhou and Jiao Reference Zhou and Jiao2017), understates the underlying capture risk due to the unaccounted-for bycatch loss. On the other hand, contact rate, or the number of interactions per thousand hooks, another commonly used measure (McNamara et al. Reference McNamara, Kaaialii and Torre1999, Boggs Reference Boggs, Melvin and Parrish2001), overstates the risk because many interactions are nonetheless capture-safe, i.e. they do not result in captures (N in Figure 1). As such, bycatch rate and contact rate at best serve as a lower and upper bound, respectively, for the underlying capture rate, and a direct capture rate measure is still missing.
Aiming to improve our understanding of seabird bycatch risk in longline fisheries, this study proposes a direct measure of seabird bycatch risk, which accounts for bycatch loss, and based on a long-term large scale seabird interaction and carcass retrieval dataset, illustrates how to estimate the underlying bycatch risk, and identifies associated risk factors. This study extends and updates a recent seabird bycatch study (Zhou et al. Reference Zhou, Brothers, Browder and Jiao2020). The findings of this study are relevant to conservation biologists as well as resource managers in measuring the effect of fishery bycatch on susceptible seabird populations and in aiding the design of effective bycatch mitigating strategies.
Methods
Bait-taking attempts and outcome confirmation observations
The observations of seabird bait-taking attempt and confirmation in pelagic longline fisheries were collected by NB from 1988 to 2003 in four geographical regions: Indian Ocean, Coral Sea, Southern Ocean, and Central Pacific. This dataset contains observed seabird interactions from a total of 726,626 baited hooks. An interaction occurs when a seabird makes a deliberate attempt to remove a bait from a hook, regardless of the outcome, whether the attempt is successful or not, and whether the attempt leads to the bird’s capture or not. Herein, ‘an interaction’ is used synonymously with ‘a bait-taking attempt’ and ‘a contact’. See Appendix S1 in the online supplementary material for details on the observation protocol.
Process of seabird bycatch
Observations of seabird interactions during gear deployment and observations of retrieved carcasses each have limitations when attempting to estimate underlying capture events. For the observations during gear deployment, the limiting factor takes the form of misclassification due to the long distance between the observer and the interaction, e.g. the farthest observed interaction in this study occurred c. 500 m away, and the dynamic nature of a bird getting captured while feeding and competing with other individuals. For the observation during gear retrieval, the limiting factor takes the form of bycatch loss: only those remaining on the hook (R in Figure 1) can be recorded by the observer present during gear retrieval. By linking these two types of observations, inferences can be made on the underlying capture events, and the modelling approach adopted here takes into account both sources of uncertainty.
A capture (event) has a 1−p loss probability of producing a retrieved carcass during gear retrieval, and it is different from the capture event as defined by Gilman et al. (Reference Gilman, Boggs and Brothers2003). In this study, both ‘capture’ and ‘bycatch’ refer to the underlying capture, but occasionally, ‘bycatch’ refers to only the retrieved portion due to its prevalent usage in the literature, and the meaning should be clear from context.
Seabird bycatch vulnerability (pc ) is a parameter of direct conservation interest. For a collection of seabird interactions, the higher the pc , the higher the expected number of incidental captures. Bycatch vulnerability (pc ) defined here measures the capture probability of a bait-taking attempt, and it is part of an aggregate bycatch rate, which depends on both how many interactions seabirds can produce and how risky those interactions are. The former quantity, i.e. contact rate, can be obtained through direct observation in the field, and the aggregate bycatch rate can be calculated as the product of a normalized contact rate and bycatch vulnerability.
In contrast, bycatch loss rate (ploss ) is a rather problematic parameter as it does not confer any information on capture risk per se. Loss rate is unrelated to seabird bycatch vulnerability, but nonetheless it remains an important parameter to estimate because of observation uncertainty and the prevalence of the haul-only observation protocol in current observer programs. The data generating process of retrieved carcasses inevitably involve both bycatch vulnerability (pc ) and bycatch loss rate (ploss ) with carcass retrieval rate being p c (1−p loss ) for a given interaction.
Risk factors
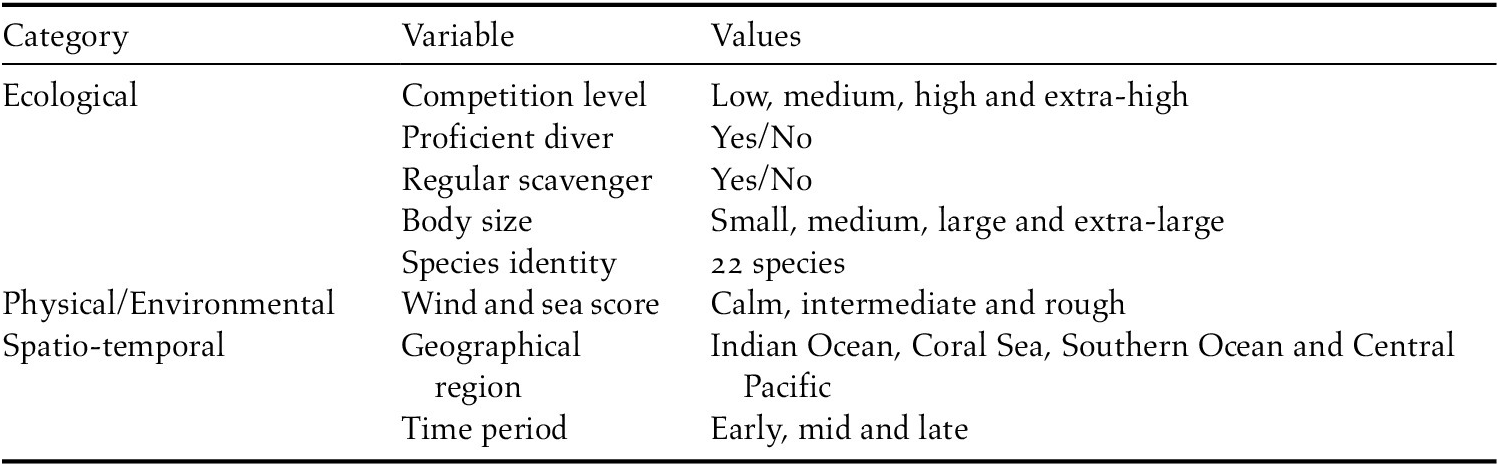
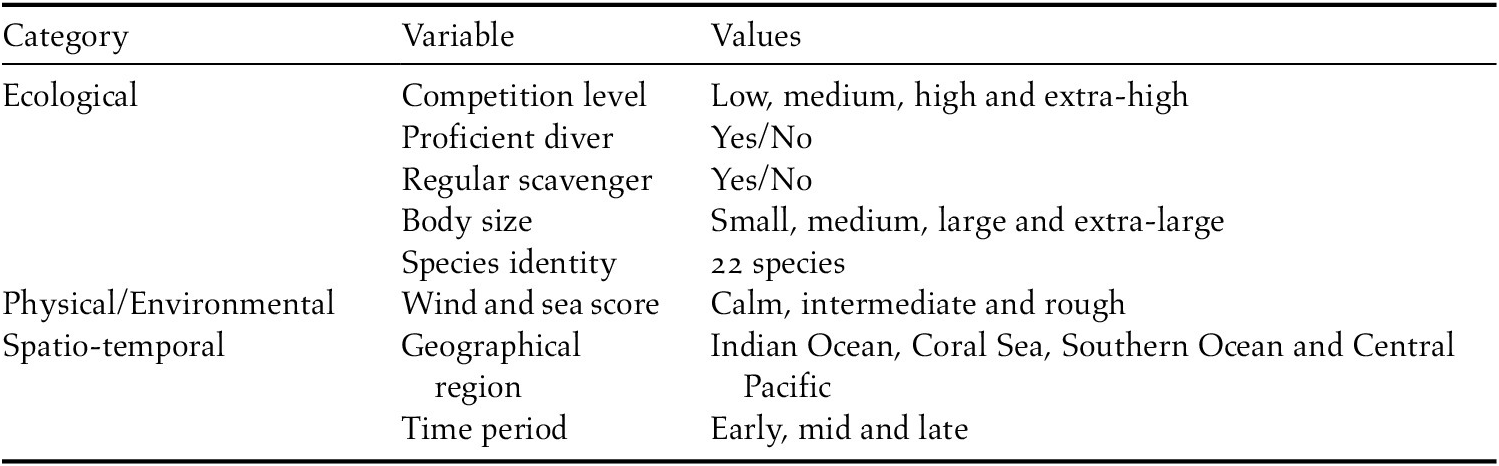
Feeding strategies, competitive potential of seabirds, the level of competition involved, physical oceanic condition, and spatio-temporal factors could influence how seabirds approach a baited hook and subsequently lead to different capture rates. Here, seven factors were examined for their effect on bycatch vulnerability, including five ecological factors, one physical/environmental factor and two spatio-temporal factors (Table 1). See Appendix S1 for model fitting and selection with additional details on the risk factors, and the formulation of eight alternative hypotheses on the variability of bycatch vulnerability against the null (Table 2).
Summary of variables and brief descriptions. See Appendix S1 for more details.
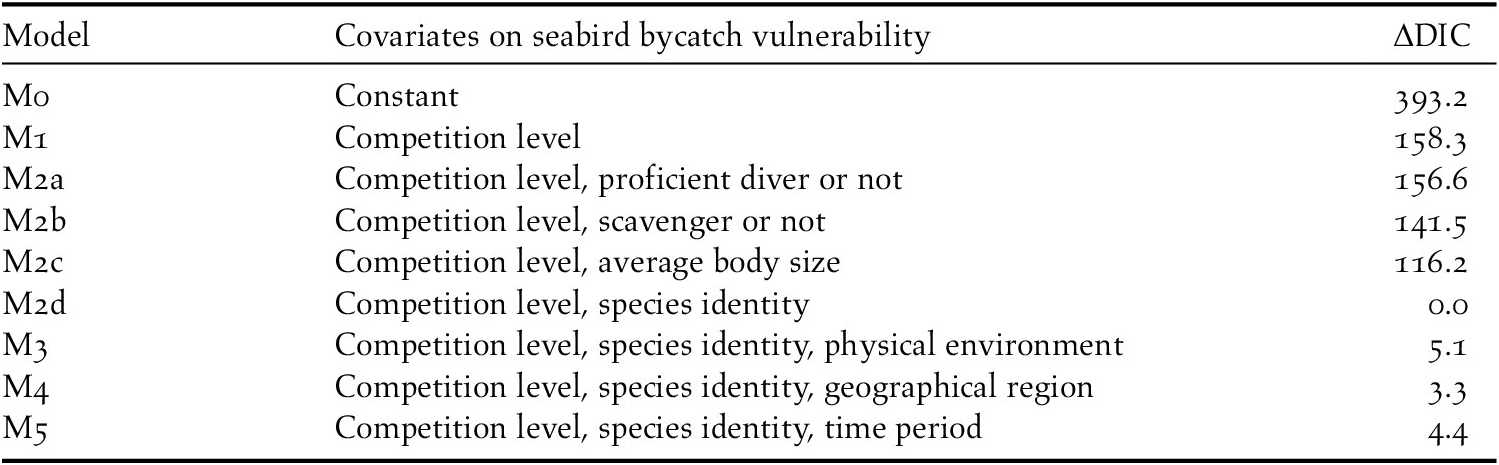
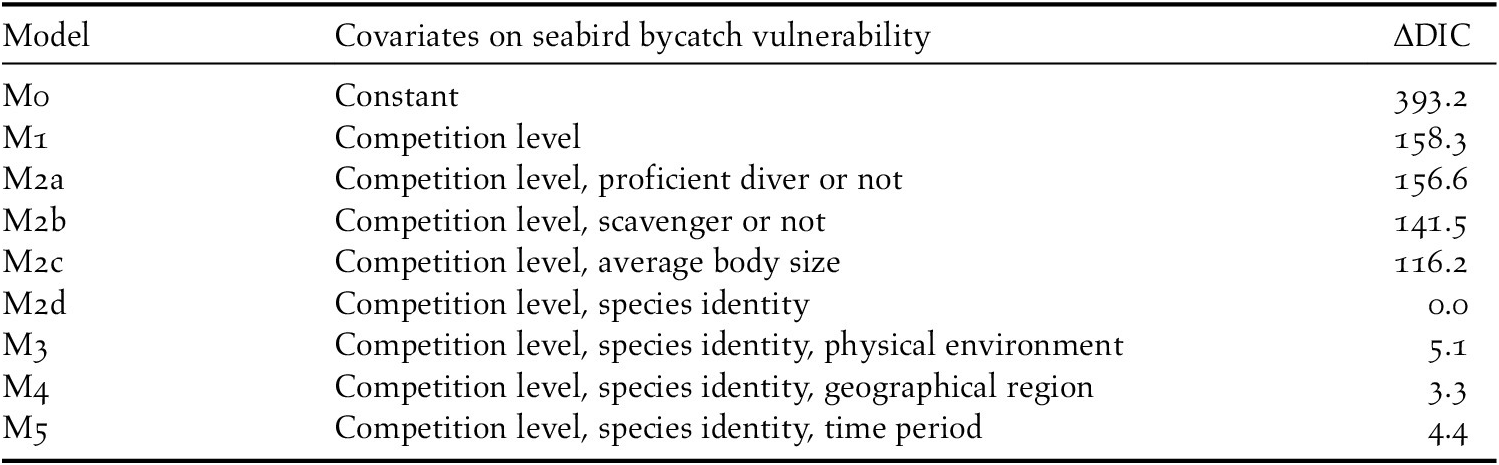
Candidate models and model selection results based on DIC.
Results
Competition was found to be the most significant factor affecting the likelihood of getting incidentally captured. Model selection showed that the best predictors of seabird bycatch vulnerability were the level of competition at the time of interaction and species identity (Table 2). The selected model (M2d) showed substantially improved performance compared to the null (M0). Ecological variables explained a significant portion of species effect. Species competitive potential and foraging behaviour differences were found to significantly affect the bycatch vulnerability of seabird interactions. On the other hand, no evidence was found supporting any additional effect from either the physical oceanic condition or the spatio-temporal factors.
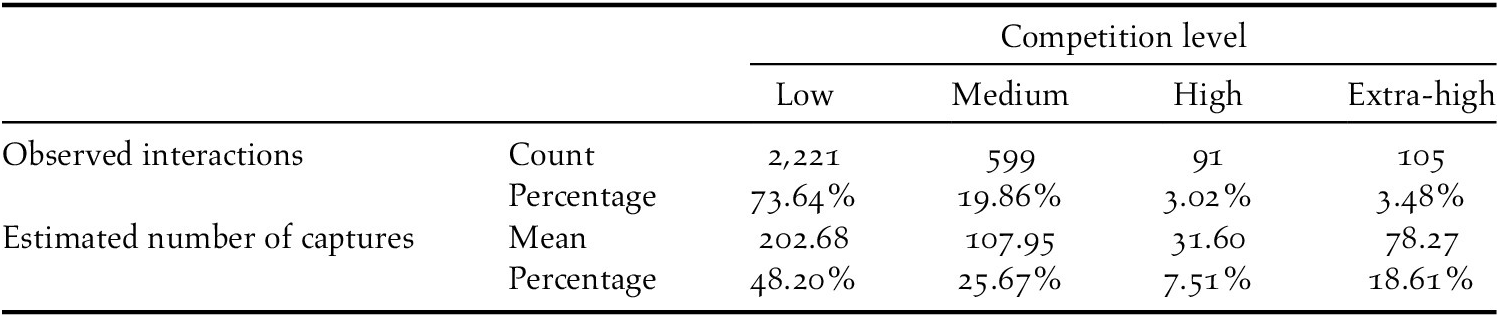
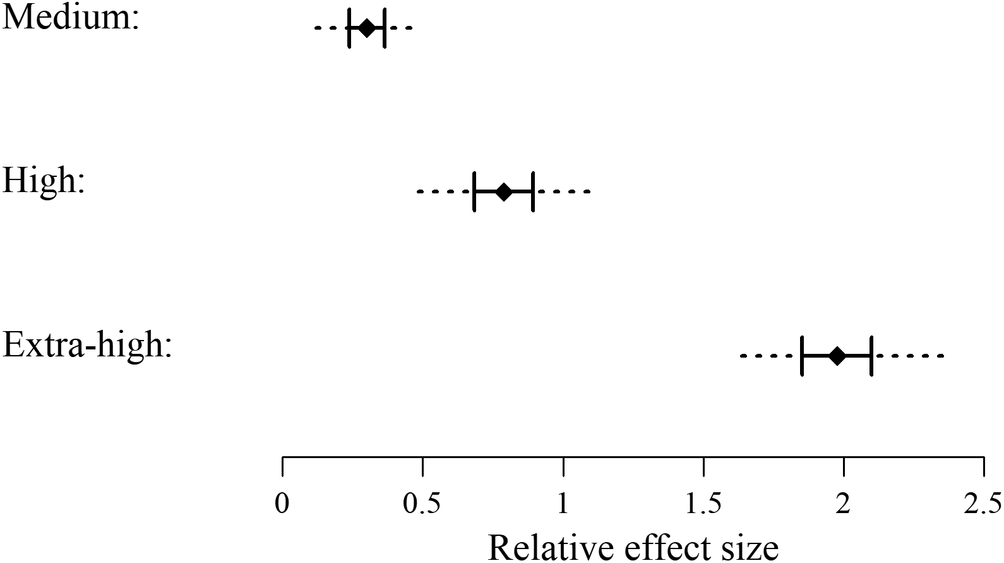
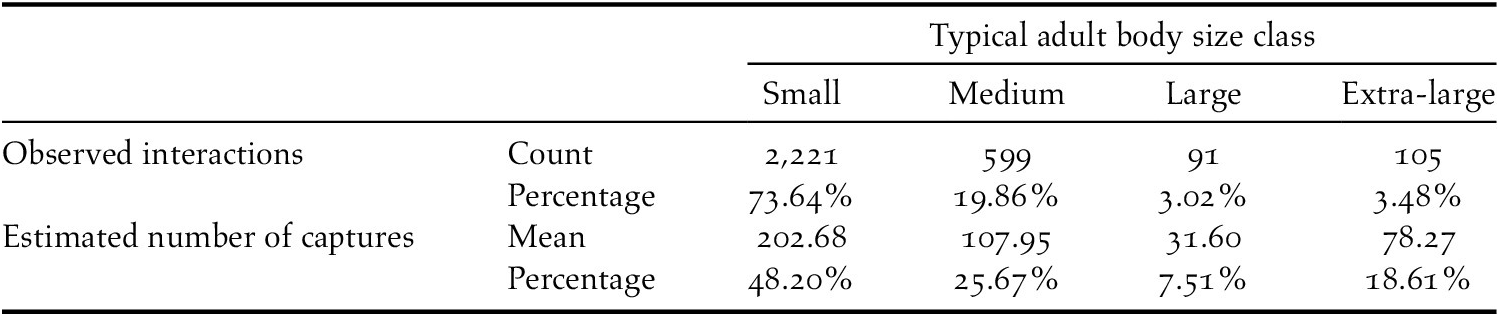
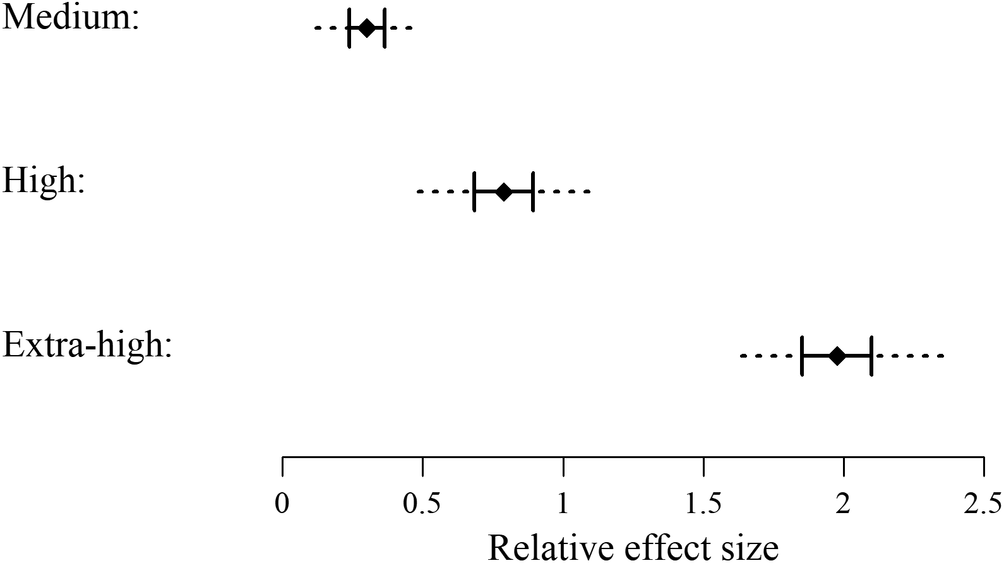
Competitive environments strongly affected seabird bycatch vulnerability. The number of observed interactions trended lower with increasing competition, with the exception of a bump when species competition score was over 1,000 units (Figure 2). Most interactions (73.64%) occurred in a low competition environment than in more competitive environments (Table 3). The inclusion of competition level improved model performance substantially (Table 2). The effect of competition levels on bycatch vulnerability was estimated based on the selected model (M2d). Medium, high, and extra-high competition environments were associated with a significantly higher bycatch vulnerability than the low competition environment (Figure 3). The relative effect on bycatch vulnerability more than doubled on average transitioning from medium to high competition (× 2.62), and again from high to extra-high competition (× 2.51). Particularly, although an extra-high competition environment only accounted for 3.48% of all the observed interactions, it was responsible for 18.61% of all the captures, highlighting the detrimental effect of crowding on the bycatch safety of seabird interactions (Table 3).
Incidence of observed seabird interactions and estimated captures across different levels of competition. See Table S4 and Table S5 for additional results.

Relative effect of medium, high, and extra-high competition environments on seabird bycatch vulnerability. The low competition environment was used as a reference with its effect being subtracted. A positive value indicates higher bycatch vulnerability with respect to the low competition environment, and vice versa for negative values. Solid diamond marks median estimate, solid interval marks interquartile range estimate, and dashed line marks the estimate of a 95% credible interval.
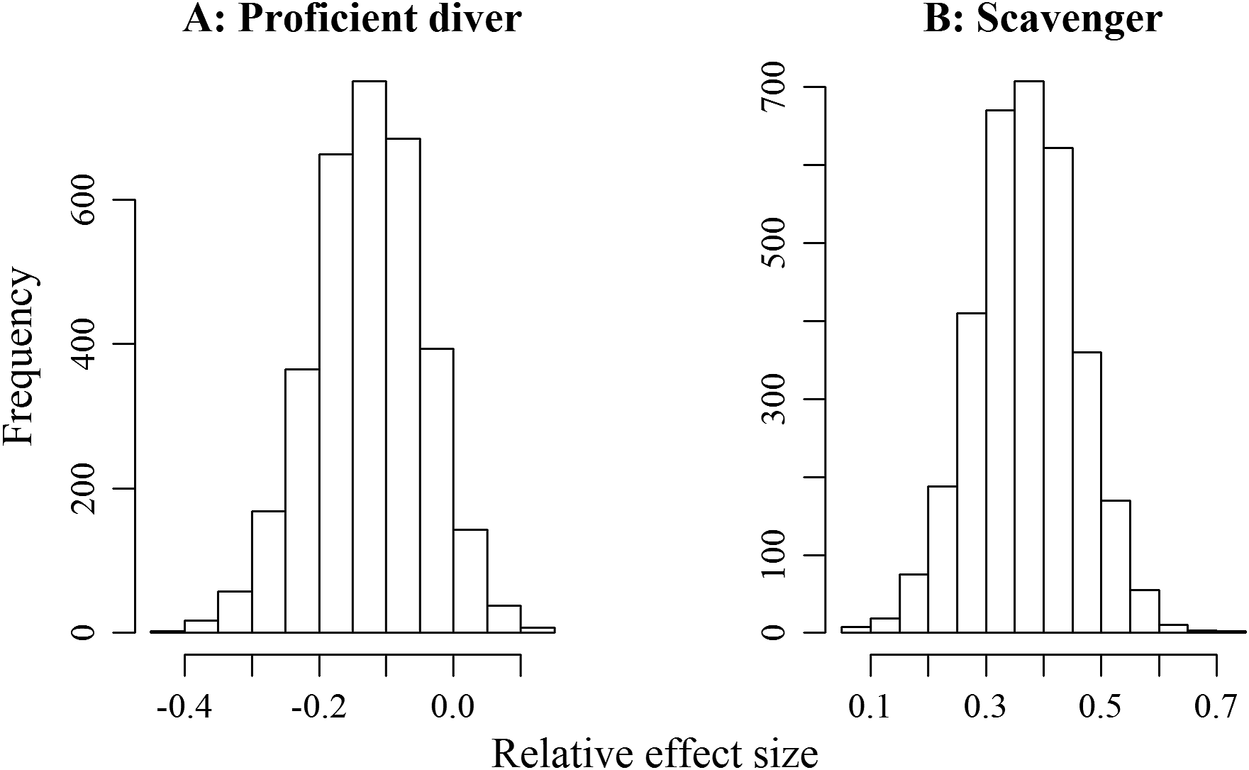
Mediated through ecological traits, species identity was found to significantly affect bycatch vulnerability. Species effect was decomposed into three ecological traits relating to foraging behaviours and competitive potential of the species. There were significantly more interactions initiated by proficient divers (1,784 vs 1,233, χ 2 test of independence P < 0.01), and more interactions from scavengers (1,571 vs 1,446, χ 2 test of independence P = 0.02). The inclusion of diving behaviour improved model performance marginally (Table 2), and being a proficient diver had a non-significant negative effect of −0.13 on average with a 95% credible interval of (−0.30, 0.035) (Figure 4A). On the other hand, the inclusion of scavenging behaviour improved model performance substantially (Table 2) and being a scavenger incurred a significant positive effect of 0.37 on average with a 95% credible interval of (0.19, 0.54) (Figure 4B).
Relative effect of being a proficient diver (A) or a scavenger (B) on bycatch vulnerability. Non-proficient-divers and non-scavengers were used as references with their effects being subtracted. For either a proficient diver or a scavenger, a positive value indicates higher bycatch vulnerability with respect to their respective counterparts, and vice versa for negative values.

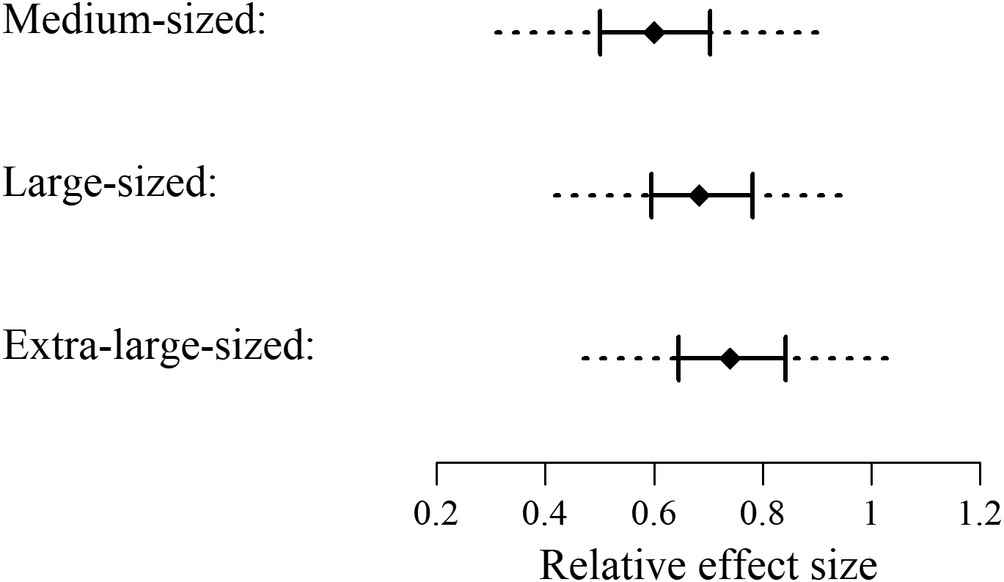
Additionally, the inclusion of body size brought the most improvement to model performance among the ecological traits examined (Table 2). Between small-sized species and species with a larger body size (medium, large, and extra-large sized), larger species have a significantly higher bycatch vulnerability, and bycatch vulnerability increased with each increase in body size category (Figure 5). There were more observed interactions initiated by species with a larger body size than by those with a smaller body size (Table 4). Due to both lower effective participation and lower bycatch vulnerability from small-sized species, they only accounted for 5.64% of all the captures (Table 4).
Relative effect of medium-, large-, and extra-large-sized seabird species on bycatch vulnerability. Small-sized group was used as a reference with its effect being subtracted. A positive value indicates higher bycatch vulnerability with respect to a small-sized species, and vice versa for negative values. Solid diamond marks median estimate, solid interval marks interquartile range estimate, and dashed line marks the estimate of a 95% credible interval.

Incidence of observed seabird interactions and estimated captures across different body sizes. See Table S6 and Table S7 for additional results.

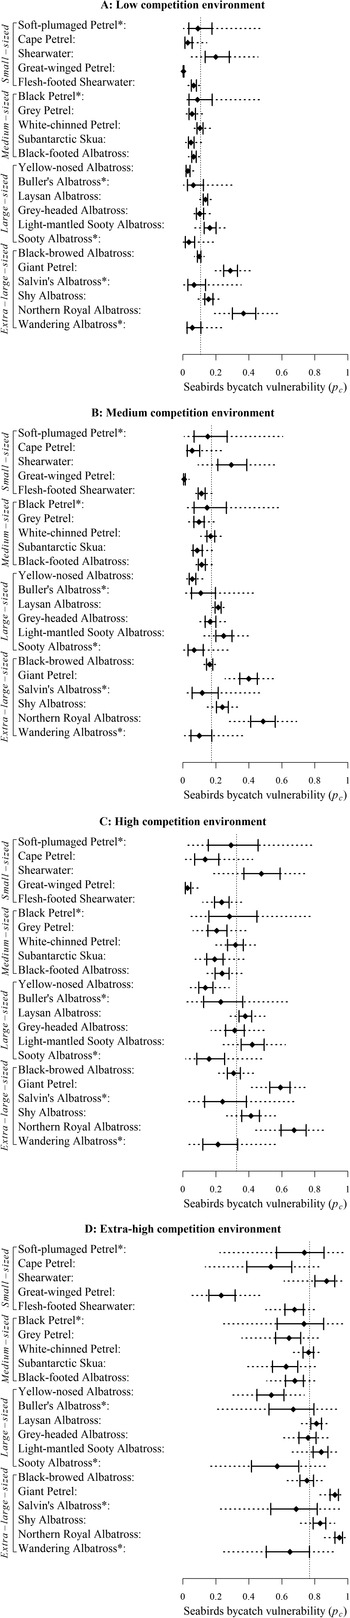
Bycatch vulnerability varied widely among species. The average bycatch vulnerability in a low competition environment across all observed species was 11.58% on average with a 95% interval of (0.25%, 40.86%). Particularly, interactions from Northern Royal Albatross Diomedea sanfordi had the highest average bycatch vulnerability of 37.22%, followed by Giant Petrel, including both Macronectes giganteus and M. halli, with an average bycatch vulnerability of 29.05% (Figure 6A). Both Northern Royal Albatross and Giant Petrel belong to the extra-large-sized group. At the other end of the spectrum, interactions from Great-winged Petrel Pterodroma macroptera, which belongs to the small-sized group, have the lowest bycatch vulnerability of 0.48% (Figure 6A). The order of bycatch vulnerability of bait-taking interactions among species was preserved across competition levels due to the assumed linearity of the species effect and competition level effect in the selected model.
Estimates of species-specific bycatch vulnerability (pc ) in a low (A), medium (B), high (C), and extra-high (D) competition environment. In each panel, the dotted vertical line marks the mean bycatch vulnerability under the respective competition environment. Seabird species are ordered by their typical adult body size and grouped by body size categories. See Table S2 for seabird species included under each common name. Species marked with * have no more than 10 observed records. On each row, solid diamond marks median estimate, solid interval marks interquartile range estimate, and dashed line marks a 95% credible interval.
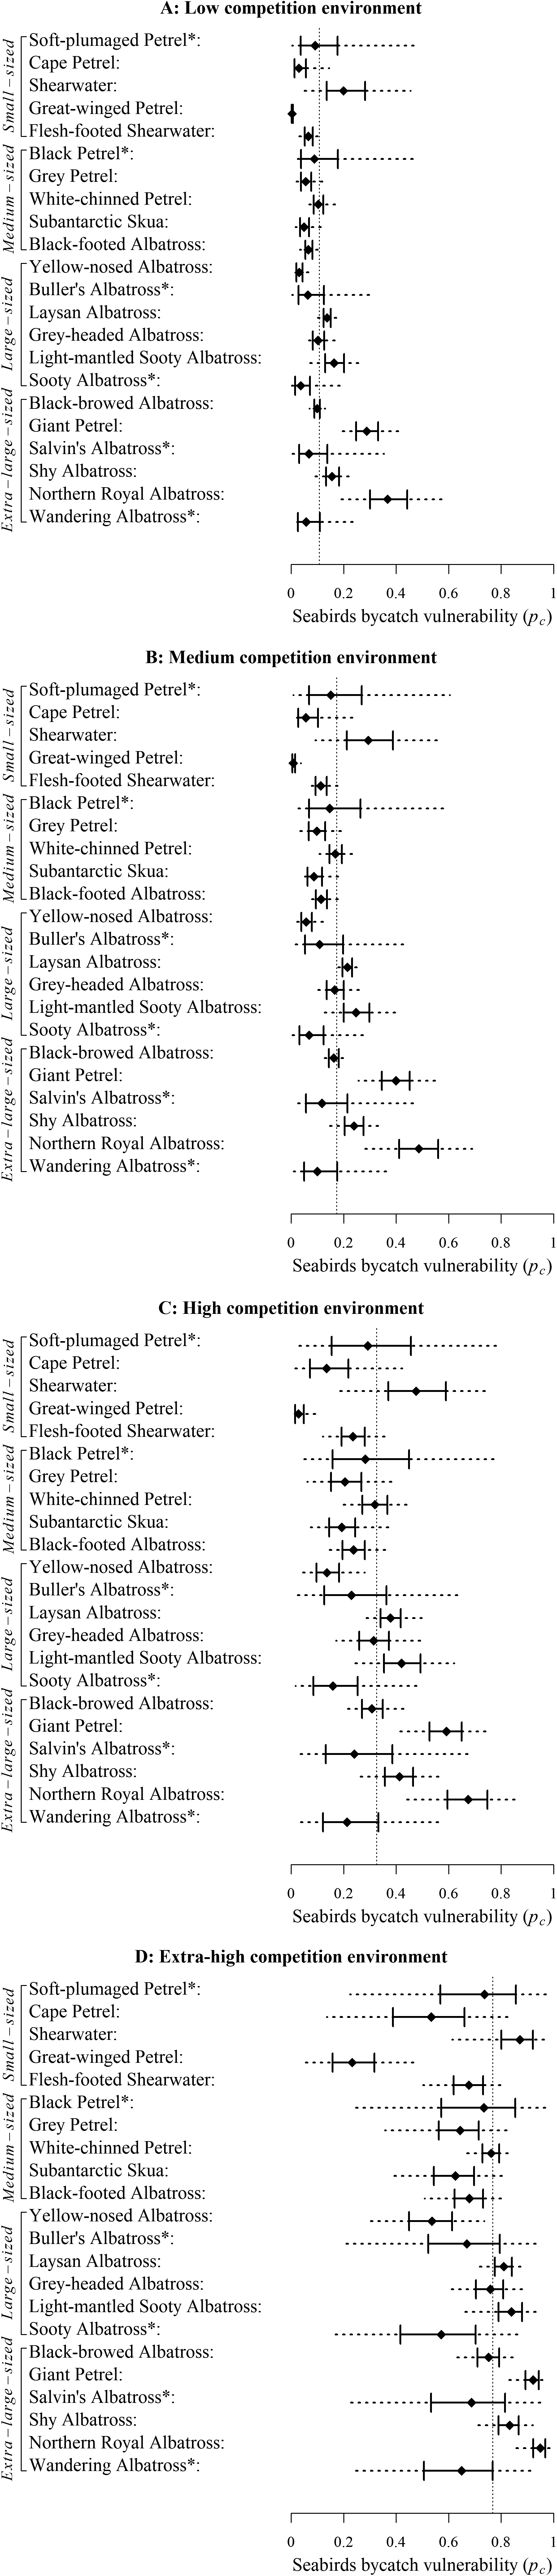
Competition substantially magnified bycatch vulnerability. On average, bycatch vulnerability was 1.5, 2.6 and 6.0 times as high in a medium, high, and extra-high competition environment, respectively, as in a low competition environment (Figure 6B, C and D). Moreover, the magnitude of increase differed for each species. In particular, for Northern Royal Albatross, the average vulnerability increased to 48.56%, 66.62% and 94.03% with increasing levels of competition, and for Great-winged Petrel, the corresponding rates were 1.08%, 3.41% and 24.14%. Transitioning from a low to an extra-high competition environment, bycatch vulnerability saw a lower-than-average 3-fold change for Northern Royal Albatross, but a massive 50-fold change for Great-winged Petrel. Changes for other species varied between these two extremes.
Discussion and conclusions
Bycatch vulnerability (pc ) provides a direct measure of the capture risk of fishery interactions of seabirds. Since bycatch vulnerability links an observed interaction directly to the underlying capture event, it is not affected by subsequent bycatch loss. Combined with a normalized contact rate, bycatch vulnerability provides an unbiased estimate of the aggregate bycatch rate. Further, based on a long-term dataset, competition was found to play a central role in determining seabird bycatch vulnerability. More competitive environments were riskier for seabirds, and larger and thus more competitive species were more at risk than smaller sized and less competitive species. Ecological traits of seabirds explained a substantial amount of bycatch vulnerability variation at the species level, further suggesting its use to infer bycatch risk for seabird species with limited bycatch records (e.g. Zhou et al. Reference Zhou, Jiao and Browder2019b). On the other hand, we did not find any evidence of the additional effect of physical oceanic condition or spatio-temporal factors on bycatch vulnerability.
Recognized as a seabird research and conservation priority (Lewison et al. Reference Lewison, Oro, Godley, Underhill, Bearhop, Wilson and Ainley2012), obtaining unbiased and accurate estimates of bycatch rates is essential in understanding the magnitude of bycatch effects and in developing reference points or thresholds for seabird conservation (Moore et al. Reference Moore, Curtis, Lewison, Dillingham, Cope, Fordham and Heppell2013, Small et al. Reference Small, Waugh and Phillips2013, Good et al. Reference Good, Baker, Gummery, Votier and Phillips2020). Common measures of bycatch rate are plagued by limited direct carcass observations, e.g. undetected carcass drop-offs (Ryan and Watkins Reference Ryan and Watkins2008, Brothers et al. Reference Brothers, Duckworth, Safina and Gilman2010) and carcass degradation during gear retrieval (Trebilco et al. Reference Trebilco, Gales, Lawrence, Alderman, Robertson and Baker2010). Bycatch vulnerability proposed here solves the problem, and it is not obscured by subsequent bycatch loss because as a capture rate, it relates an interaction directly to its underlying capture outcome (Figure 1).
Valuable lessons can still be learned from seabird interaction observations collected more than a decade ago. The original observations used in this study were conducted between 1988 and 2003, when the problem of fishery bycatch only started to become recognized. A lot has happened since then with many countries/regions implementing National Plans of Action to reduce their domestic fishery seabird bycatch (Good et al. Reference Good, Baker, Gummery, Votier and Phillips2020 and references therein), along with widespread promotion of mitigation measures by the Agreement for Conservation of Albatrosses and Petrels (ACAP) and some uptake of these measures in high sea fisheries under the administration of key tuna Regional Fisheries Management Organizations (RFMOs). These changes may lead some to question the relevance of this dataset irrespective of ongoing evidence of widespread mitigation measure non-compliance (Winnard et al. Reference Winnard, Hochberg, Miller, Kroodsma, Small and Augustyn2018, Brothers and Robertson Reference Brothers and Robertson2019).
Unfortunately, there have been no independent field studies conducted during the past decade to either corroborate or update the historical data. While similar studies do exist in the literature (e.g. Brothers Reference Brothers1991, Gales et al. Reference Gales, Brothers and Reid1998, Gilman et al. Reference Gilman, Boggs and Brothers2003, Reference Gilman, Brothers and Kobayashi2007, Zhou et al. Reference Zhou, Jiao and Browder2019a), they are pseudo-replicates that depend on different subsets of the observations examined here. Jiménez et al. (Reference Jiménez, Domingo, Abreu and Brazeiro2012) reported a 26% loss rate in a Uruguayan longline fishery between 2005 and 2010. It remains unknown whether recent changes significantly affected the bycatch vulnerability of seabird interaction or not, and the reduction in the observed bycatch in recent years may be due to other factors further discussed below. Meanwhile, the 16 years of observations showed no evidence of any additional temporal effect, after the species effect and competition effect have been accounted for, suggesting the invariant nature of the underlying biological process of getting captured. To thoroughly investigate this issue, it becomes necessary to collect new observations of seabird interaction to confirm today’s pelagic longline fisheries situation.
To monitor the underlying capture risk, it is necessary to collect both interaction observations during gear deployment and carcass retrievals during gear retrieval, potentially doubling the typical workload of a fishery observer, who is generally only tasked to collect any catch/bycatch data at gear retrieval. In a survey, 54% of seabird observer data users regard collecting interaction data as either critical or preferred, even though only 21% of observer programmes collect such data in some form (Dietrich et al. Reference Dietrich, Cornish, Rivera and Conant2007). Such observations can also greatly assist to better understand the efficacy of mitigation because a measure of risk based on bird counts during line setting can be determined reliably using proven count methodology (Tasker et al. Reference Tasker, Jones, Dixon and Blake1984).
The costs may be prohibitive for full adoption of seabird interaction observations to every observed longline set in an observer programme, but it remains a viable option to augment just a subset of the observed longlines with an extra interaction observation component (Warden and Murray Reference Warden and Murray2011). Interaction observations involve much uncertainty even to an experienced field worker (Pacific Islands Regional Office 2017), and as a result, the selection of qualified observers can be difficult, and the required specialized training may also be a concern, e.g. to identify behaviour response of specific seabird species at a distance. However, the potential benefit of those additional observations is even higher as they enable unbiased and direct monitoring of the underlying capture risk. Even though the existing haul-based observations appear to provide a clear measure of seabird bycatch in terms of implementation, the errors involved in terms of bycatch loss (c. 50% and Figure S1) are overwhelmingly higher than those associated with interaction observations at gear deployment (c. 2% and Table S8). With an efficient experimental design, interaction observations have the potential to provide a clearer picture of the scale of seabird bycatch in current global fisheries. A stratified sampling design may be adopted to focus on areas/time periods that are known or suspected to produce high bycatch rates. Meanwhile, for scenarios with relatively low bycatch risks, the underlying bycatch may be extrapolated based on haul-based measures alone (e.g. Zhou et al. Reference Zhou, Jiao and Browder2019a). In addition, electronic monitoring may have the capacity to alleviate some of the issues mentioned above (Emery et al. Reference Emery, Noriega, Williams and Larcombe2019). Further research is needed to analyse how much sub-sampling is needed to ensure bycatch monitoring objectives of the programme.
Seabird species complex, and differences in gear and fishing practices are known to affect the observed bycatch rate (Cherel et al. Reference Cherel, Weimerskirch and Duhamel1996, Brothers et al. Reference Brothers, Gales and Reid1999, Gilman et al. Reference Gilman, Brothers and Kobayashi2005). Pre-capture bait-taking participation is highly variable among different seabird species. Some species, e.g., Laysan Albatross Phoebastria immutabilis, readily attempts to take baits, while other species, e.g. White-headed Petrel P. lessonii, do not participate in bait-taking at all (Brothers et al. Reference Brothers, Duckworth, Safina and Gilman2010). It is possible that among seabird species that do participate in bait-taking, their participation also varies according to their differential preference. Species with a higher participation in bait-taking would produce a higher per capita bycatch rate than those only occasionally participating in bait-taking but with a similar bycatch vulnerability. Most seabird interactions covered in this study were collected onboard fishing vessels equipped with bycatch mitigation measures to reduce seabird participation in bait-taking (Gilman et al. Reference Gilman, Brothers and Kobayashi2007, Brothers et al. Reference Brothers, Duckworth, Safina and Gilman2010); when an interaction is initiated, its capture rate is unlikely altered, even though the observed bycatch (R) is effectively reduced.
Competition plays a central role in determining the capture risk of an interaction. The elevated bycatch vulnerability for larger sized and hence more competitive seabirds makes them even more vulnerable because of their generally lower fecundity and lower maturation rate as compared with smaller sized species. In particular, Northern Royal Albatross has the highest bycatch vulnerability among all the species examined. They often seize baits already taken by another species, and their dominance by aggressiveness and intimidation may be responsible for the high capture risk (Brothers et al. Reference Brothers, Duckworth, Safina and Gilman2010). Elevated bycatch risk among larger sized species has also been found in the western North Atlantic (Zhou and Jiao Reference Zhou and Jiao2017, Zhou et al. Reference Zhou, Jiao and Browder2019b). Meanwhile, Great-winged Petrel has the lowest bycatch vulnerability. They are unique in that even in abundance they tend to feed amicably and safely on baits, and among other species, they tend to avoid conflict and assumes a secondary role in bait-taking (Brothers Reference Brothers2008), and such behaviours lead to a lower capture risk. Moreover, Cape Petrel Daption capense has a special role in identifying where the bait is still accessible and is readily intimidated by most other species but nevertheless is still ‘rewarded for effort’ with smaller bait pieces in the process of the whole bait being consumed by larger, more aggressive competitors. Hence, mutual incentive for such interspecies interaction is perpetuated unless mitigation, and in particular use of appropriately weighted lines should be employed to deny birds ready access to baited hooks (Melvin et al. Reference Melvin, Guy and Read2014, Jiménez et al. Reference Jiménez, Domingo, Forselledo, Sullivan and Yates2019).
Competition effect can work with us when a bycatch mitigation strategy reduces the rate of bait-taking interactions: the strategy is doubly effective because of 1) a reduced number of interactions and 2) a lower bycatch vulnerability due to reduced competition. For the controlled bycatch mitigation experiments compiled in Gilman et al. (Reference Gilman, Brothers and Kobayashi2005), the reduction in the observed bycatch rate was generally greater than the reduction in contact rate, suggesting that reduced participation further reduced capture rate through a lower competitive environment. Alternatively, such a phenomenon may be due to a non-linear density effect, and its confirmation requires further analysis. When competition is high, competition effect works against us even harder (Figure 6C and D). Even though high and extra-high competition environments can be localized either in space or time, they are nonetheless responsible for disproportionally high proportions of captures (Table 3). These situations can occur for particularly vulnerable species at hotspots (Yamaguchi Reference Yamaguchi1989, Lewison et al. Reference Lewison, Crowder, Wallace, Moore, Cox, Zydelis and McDonald2014), where more stringent bycatch mitigation requirements or even closed areas (Game et al. Reference Game, Grantham, Hobday, Pressey, Lombard, Beckley and Gjerde2009) may be enacted to counteract the heightened risk.
The risk of capture variability among individual species, which is part determined by their different behavioural and interaction tendencies (both with the fishing gear and between individuals or species), can be included in species risk assessments (e.g. Richard and Abraham Reference Richard and Abraham2013), and be added to the ever-improving data of all species’ at-sea distributions (BirdLife International 2004). This information can then be used, in the absence of adequate seabird bycatch monitoring, both in accuracy and in its regional and seasonal coverage proportional of fishing effort limitations, to identify potential bycatch hotspots and at least ensure best options of bycatch mitigation measures are required where they are needed the most. Preferably however, universally effective mitigation should be required irrespective of capture risk variability as that is likely to remain or even become more unpredictable, especially if rapidly changing oceanic conditions due to warming climatic conditions persist and drive not only seabird distribution and abundance changes but also established spatio-temporal distribution patterns of fishing effort (Barbraud et al. Reference Barbraud, Rolland, Jenouvrier, Nevoux, Delord and Weimerskirch2012).
Combined with a normalized contact rate, bycatch vulnerability provides an unbiased estimate of seabird bycatch rate in pelagic longline fisheries. It is recommended as a replacement for the commonly used observed bycatch rate or carcass retrieval rate. For resource managers, the first step forward would be to assess the potential risk, through at-sea trials and/or simulations (Zhou et al. Reference Zhou, Jiao and Browder2019a), and evaluate if unaccounted seabird bycatch poses a substantial danger to the conservation of protected species being managed under existing strategies, and determine whether or not to make adjustments in monitoring the seabird bycatch rate. Regional variations may exist. This issue will be especially urgent for biodiversity rich regions currently under high fishing pressure due to a greater and more imminent danger of biodiversity loss. In either case, simply ignoring the bycatch loss issue is not an environmentally responsible decision to make.
Supplementary Materials
To view supplementary material for this article, please visit http://doi.org/10.1017/S0959270921000046.
Acknowledgements
The observations of seabird interactions during gear deployment and carcass retrieval during gear retrieval from longline fisheries were extracted from appendices in Brothers (Reference Brothers2008), without which none of the findings in this work would have been possible. This manuscript also benefited from an earlier discussion with David Grémillet and Grant Humphries, and insightful comments and suggestions from two anonymous reviewers on previous versions of the manuscript.