Introduction
Wildfires and other natural disturbances maintain a mosaic of habitats on forest landscapes (Hunter Reference Hunter1993), contributing to maintenance of biodiversity, because forest succession structures biotic assemblages (Jonsson and Esseen Reference Jonsson and Esseen1990; Boulinier et al. Reference Boulinier, Nichols, Sauer, Hines and Pollock1998; Tews et al. Reference Tews, Brose, Grimm, Tielbörger, Wichmann, Schwager and Jeltsch2004). However, increasing industrial activities associated with natural resource extraction over large areas (e.g., harvesting, and oil and gas developments) has altered disturbance regimes in Canadian forests, affecting natural succession and resulting in unintended consequences for populations of sensitive species (e.g., Spence et al. Reference Spence, Langor, Niemelä, Carcamo and Currie1996; Langor et al. Reference Langor, Hammond, Spence, Jacobs and Cobb2008; Work et al. Reference Work, Koivula, Klimaszewski, Langor, Spence, Sweeney and Hébert2008). A full understanding of how commercial forestry affects the biota in comparison to natural disturbances requires research that includes all phases of succession (e.g., Buddle et al. Reference Buddle, Spence and Langor2000, Reference Buddle, Langor, Pohl and Spence2006). In fact, it appears that decades are required to adequately assess whether assemblages recover to predisturbance conditions (Buddle et al. Reference Buddle, Langor, Pohl and Spence2006; Venier et al. Reference Venier, Work, Klimaszewski, Morris, Bowden and Kwiaton2017).
Few studies, most focused on plants or arthropods, have explored response of biodiversity in Canadian forests over a postdisturbance period greater than five years (e.g., Corns and La Roi Reference Corns and La Roi1976; Buddle et al. Reference Buddle, Spence and Langor2000, Reference Buddle, Langor, Pohl and Spence2006; Venier et al. Reference Venier, Work, Klimaszewski, Morris, Bowden and Kwiaton2017). Carabid beetles are frequent model arthropods for such research, both in North America and elsewhere (e.g., Niemelä et al. Reference Niemelä, Langor and Spence1993; Heliölä et al. Reference Heliölä, Koivula and Niemelä2001; Lemieux and Lindgren Reference Lemieux and Lindgren2004; Osawa et al. Reference Osawa, Terai, Hirata, Nakanishi, Makino, Sakai and Sibata2004; Pearce and Venier Reference Pearce and Venier2006; Work et al. Reference Work, Koivula, Klimaszewski, Langor, Spence, Sweeney and Hébert2008; Johansson et al. Reference Johansson, Hjältén, Olsson, Dynesius and Roberge2016) because the family is diverse and relatively well understood, both taxonomically and ecologically; they are easily sampled in a standard way; and much relevant ecological literature exists, allowing changes in patterns of habitat use to be better interpreted for carabids than for many other invertebrate groups (Rainio and Niemelä Reference Rainio and Niemelä2003; Niemelä et al. Reference Niemelä, Koivula and Kotze2007; Turin et al. Reference Turin, Kotze, Müller-Kroehling, Saska, Spence and Heijerman2022). Although surface habitats are changed in character, they are not eliminated by disturbances that remove the canopy, and therefore, changes in epigaeic arthropod assemblages are especially useful for comparing effects of forest disturbances (Work et al. Reference Work, Shorthouse, Spence, Volney and Langor2004).
Several studies of Canadian boreal mixedwood forests suggest that recovery of epigaeic arthropod assemblages differs significantly between clear-cut and burned stands in the first decade after disturbance (Buddle et al. Reference Buddle, Spence and Langor2000, Reference Buddle, Langor, Pohl and Spence2006; Cobb et al. Reference Cobb, Langor and Spence2007; Work et al. Reference Work, Klimaszewski, Thiffault, Bourdon, Pare and Bousquet2013). This has been attributed to obvious differences in habitat conditions following these two disturbance types, such as degree of exposure of mineral soil, amount of charred material, and overall amount of deadwood (Cobb et al. Reference Cobb, Langor and Spence2007). However, structure of epigaeic assemblages converges approximately 30 years after either wildfire or harvest in aspen-dominated boreal mixedwood stands (Buddle et al. Reference Buddle, Langor, Pohl and Spence2006). Few studies have addressed recovery of epigaeic assemblages over longer periods or in other forest types (e.g., Gobbi et al. Reference Gobbi, Bernardi, Pelfini, Rossaro and Brandmayr2006), but some evidence suggests that those of conifer-dominated stands begin to resemble those of comparable old-growth stands roughly 40 years postdisturbance (Johansson et al. Reference Johansson, Hjältén, Olsson, Dynesius and Roberge2016; Venier et al. Reference Venier, Work, Klimaszewski, Morris, Bowden and Kwiaton2017). Nonetheless, the extent to which postharvest assemblages recover to preharvest condition of pyrogenic stands and the time required for complete recovery have not been established.
Study of a 27-year chronosequence of regenerating lodgepole pine stands following clear-cut harvest in west–central Alberta showed how carabid assemblages changed with increasing stand age (Niemelä et al. Reference Niemelä, Langor and Spence1993). Carabid species appeared to fall into three broad categories in relation to responses to disturbance: open-habitat specialists, forest generalists, and mature-forest specialists. Subsequent researchers have used this pattern to describe postdisturbance dynamics in various forest types across Canada, especially over the early stages of succession (Spence et al. Reference Spence, Langor, Niemelä, Carcamo and Currie1996; Lemieux and Lindgren Reference Lemieux and Lindgren2004; Buddle et al. Reference Buddle, Langor, Pohl and Spence2006; Koivula et al. Reference Koivula, Cobb, Déchêne, Jacobs and Spence2006; Cobb et al. Reference Cobb, Langor and Spence2007; Venier et al. Reference Venier, Work, Klimaszewski, Morris, Bowden and Kwiaton2017). Immediately following forest disturbance, species richness is generally high, consisting of open-habitat species, habitat generalists, and dwindling populations of mature-forest specialists that may persist for a few seasons following harvest (Niemelä et al. Reference Niemelä, Langor and Spence1993; Gandhi et al. Reference Gandhi, Spence, Langor and Morgantini2001; Buddle et al. Reference Buddle, Beguin, Bolduc, Mercado, Sackett and Selby2005; Saint-Germain et al. Reference Saint-Germain, Larrivée, Drapeau, Fahrig and Buddle2005). After several decades, and with increasing canopy closure, mature-forest species begin to re-establish as open-habitat species disappear, and assemblages become increasingly similar to those seen before disturbance (Buddle et al. Reference Buddle, Langor, Pohl and Spence2006; Johansson et al. Reference Johansson, Hjältén, Olsson, Dynesius and Roberge2016; Venier et al. Reference Venier, Work, Klimaszewski, Morris, Bowden and Kwiaton2017).
Although the postharvest assemblages studied by Niemelä et al. (Reference Niemelä, Langor and Spence1993) seemed to be recovering towards the structure of those found in unharvested stands 80–100 years old, recovery at the time of the study was incomplete in the oldest postharvest stands, and some species characteristics of unharvested mature stands were not found in the oldest recovering stands. Furthermore, stands that had been clear cut within the previous 15 years completely lacked species with poor dispersal abilities that were associated with mature forest. This prompted concern about their persistence under prevailing forestry practices, especially because the amount of surrounding unharvested forest that could provide sources for colonisation by these beetles was being steadily reduced and fragmented through continuing commercial harvest (Niemelä et al. Reference Niemelä, Langor and Spence1993; Spence et al. Reference Spence, Langor, Niemelä, Carcamo and Currie1996; Pohl et al. Reference Pohl, Langor and Spence2007). In addition to being limited by the age of postharvest stands available, this early work could not include a comparison with changes in assemblages after wildfire because at that time only a single accurately dated wildfire from the past century was available in the study area.
In the present paper, we further explore postharvest recovery of the carabid assemblages studied initially by Niemelä et al. (Reference Niemelä, Langor and Spence1993) to document assemblage changes over a longer chronosequence (12–53 years postharvest). Given a more recent wildfire on the landscape, we also could compare recovery between stands initiated by either harvest or wildfire and consider implications for conservation of these beetle species. New data collected in 2013–2014, and first presented here, are combined with those from Niemelä et al. (Reference Niemelä, Langor and Spence1993) to test the following five related predictions: (1) carabid assemblages of regenerating stands will become steadily more similar to those of 110-year-old pyrogenic stands (controls) with time since disturbance; (2) the assemblage recovery rate in harvested stands will be similar between the 1989–1990 and 2013–2014 studies; (3) based on findings of Buddle et al. (Reference Buddle, Langor, Pohl and Spence2006) from aspen stands, (a) assemblages of the youngest burned and harvested stands will differ, but their successional trajectories will converge with time, and (b) carabid assemblages will recover to the presumed predisturbance conditions more quickly following harvest compared to wildfire; (4) plant species composition and the extent of mineral soil exposed will correlate with carabid assemblage structure and help predict postdisturbance faunal recovery; and (5) responses of individual carabid taxa to harvesting will be consistent across the two study periods and similar for burned and harvested stands in the 2013–2014 study.
Methods
Study area
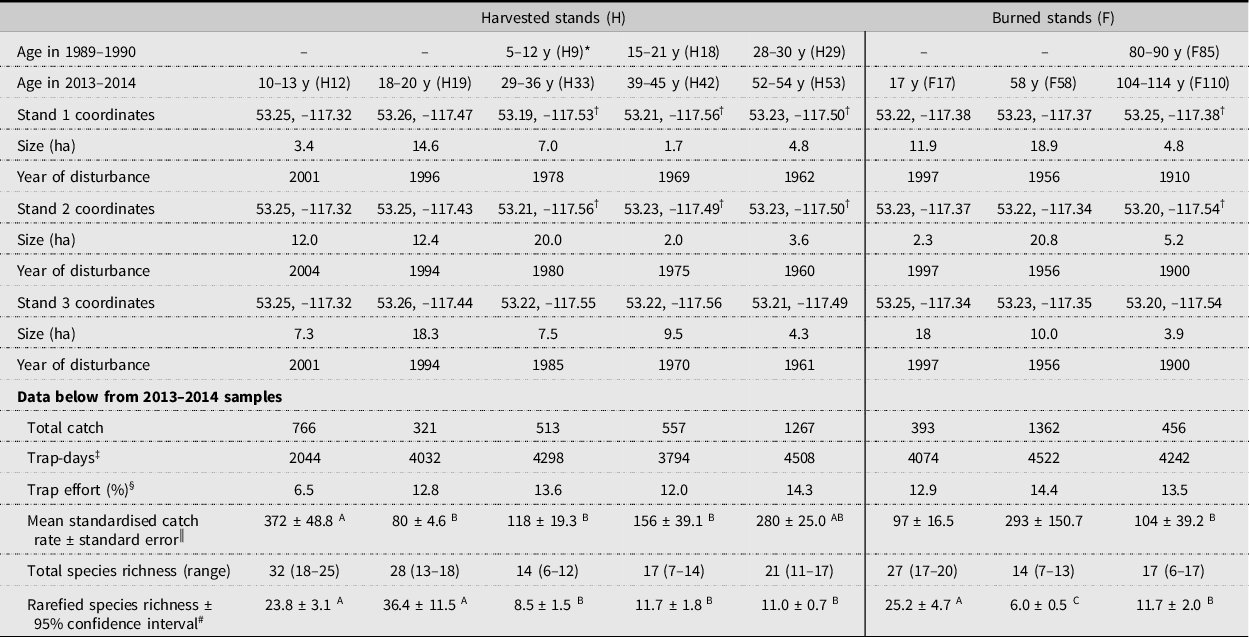
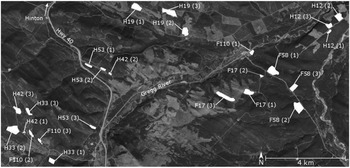
During 2013 and 2014, we sampled carabid beetle assemblages across a chronosequence of 24 lodgepole pine–dominated stands located in an approximately 160-km2 study area in the eastern foothills of the Rocky Mountains, 18–23 km south of Hinton, Alberta, Canada (Table 1; Fig. 1). Our study included postharvest regenerating stands and mature pyrogenic stands with trees 104–114 years old at the time of this study. Eight of these 24 stands were also sampled by Niemelä et al. (Reference Niemelä, Langor and Spence1993), but the 2013–2014 study also includes stands disturbed by wildfires: the 1956 “Gregg River Fire” (8000 ha) and the 1997 “Christmas Fire” (3000 ha; Udell et al. Reference Udell, Murphy, Bott and Stevenson2002). Furthermore, the 2013–2014 study focused strictly on regenerating and mature forest stands south of Hinton, in which trees were well established; that is, it does not include stands that are less than 10 years postharvest or wetter forests, both of which were represented only north of Hinton in Niemelä et al. (Reference Niemelä, Langor and Spence1993).
Age, location, and size of stands sampled in each age category during 1989–1990 (Niemelä et al. Reference Niemelä, Langor and Spence1993) and 2013–2014 (the present study). Data about sampling effort, catch, and species richness are from 2013 to 2014. Locations of stands are illustrated in Figure 1.

*Treatment labels (e.g., F110) denote disturbance types, harvest (H), and fire (F), followed by the mean age of the replicate stands.
†The stands that were sampled in both 1989–1990 and 2013–2014.
‡One trap-day is defined as one trap in operation for one day.
§Proportion of total trap-days for all stands combined.
║Standardised to individuals per 1000 trap-days. Means followed by the same upper-case letter (A or B) are not significantly different at α = 0.05, as determined by Tukey’s test (F17 and F58 treatments not included in analysis).
#Coverage-based rarefaction extrapolated to 97.9% coverage. Means followed by the same upper-case letter (A, B, or C) are not significantly different (i.e., no overlap in 95% confidence intervals).
Map of the study area, 20 km south of Hinton. See Table 1 for details about each stand and an explanation of the stand labels. The numbers in parentheses denote the assigned replicate number for each stand age class. Satellite image from Google Earth.

We worked in mesic stands comprised mainly of “Labrador tea–mesic” and “tall bilberry/arnica” ecosites that are common in the Upper Foothills Natural Subregion (Beckingham et al. Reference Beckingham, Corns and Archibald1996), and these harbour similar carabid assemblages (Langor et al. Reference Langor, Pohl and Hammond2006). Both regenerating and control stands were largely coniferous and dominated by lodgepole pine, Pinus contorta Douglas var. latifolia (Pinaceae), but some also had a high component of white spruce, Picea glauca (Moench) Voss (Pinaceae). The dominant shrubs included species of Alnus (Betulaceae) and Salix (Salicaceae), which were most common in younger stands (up to 20 years old) with open canopies. Dominant ground vegetation generally included more bryophytes in older stands and more forbs and graminoids in younger stands.
The stands studied differed in age and disturbance history (Table 1). Ages of postharvest stands were determined from records kindly provided by West Fraser Timber Co., Hinton, Alberta, and those of mature stands were estimated as averages of growth ring counts from cores of 2–3 dominant lodgepole pines in each stand. Our analysis considers data from two periods: “period 1” denotes 1989–1990 (Niemelä et al. Reference Niemelä, Langor and Spence1993), and “period 2” denotes 2013–2014. Five age classes of postharvest stands were sampled in period 2: 10–13 years (designated “H12” to represent the mean postharvest age in 2013), 18–20 years (H19), 29–36 years (H33), 39–45 years (H42), and 52–54 years (H53). No postharvest stands sampled in period 1 had reached the stage of canopy closure, but canopy closure was largely complete, with the exception of small gaps, in stands designated as H33, H42, and H53 in period 2. In addition, stands regenerated after the two wildfires (F17 and F58) and unharvested, pyrogenic-origin “control” stands aged 104–114 years postfire (F110) were also sampled.
We sampled carabids in three replicate stands for most postharvest (H) and all postfire (F) age classes during period 2 (see exceptions in the next section). Two of the replicates for each of the H33, H42, H53, and F110 stands had also been previously and similarly sampled in period 1, when their ages were, respectively, 5–12 years (herein designated “H9”), 15–21 years (H18), 28–30 years (H29), and 80–90 years old (F85; control stands for period 1).
Beetle sampling and identification
Carabids were sampled in both periods using pitfall traps of the same design (Spence and Niemelä Reference Spence and Niemelä1994). Each trap consisted of two parts: (1) a “sleeve” (1-L plastic yogurt container, 10 cm in top diameter, with perforations in the bottom to allow drainage) imbedded in the soil with the upper lip flush to the ground and (2) an inner removable “trapping cup” (0.5-L plastic yogurt container). This two-part trap facilitates maintenance of an undisturbed trap edge and, in this way, minimises effects of trap disturbance on subsequent captures (Digweed et al. Reference Digweed, Currie, Carcamo and Spence1995; Bergeron et al. Reference Bergeron, Spence, Volney, Pinzon and Hartley2013). The inner cup, which was removed for checks, contained approximately 150 mL of low-toxicity propylene glycol (silicate-free ethylene glycol was used in period 1), used as a killing agent and preservative. Each trap was shielded from precipitation and debris by an opaque lid suspended 1–2 cm above the trap on nails driven though the lid at two diagonal corners and pushed into the ground.
Six traps were deployed per stand during period 1, and eight traps were used during period 2 to increase sample sizes to compensate for anticipated trap losses due to wildlife disturbance. Most replicate stands were located at least 500 m apart to minimise spatial autocorrelation, although this appears to be only a minor consideration for carabids in northern forests (Blanchet et al. Reference Blanchet, Bergeron, Spence and He2013). Because of the limited availability of H12 stands in the study area in period 2, one pair of replicates was placed only 60 m apart but was separated by a road. Most traps within stands were separated by at least 40 m during both sampling periods to ensure that trapping transects covered a large portion of each stand. In four smaller stands sampled in period 2, H42 (replicate 1), H42 (2), F17 (2), and H12 (1; see Fig. 1), space constraints required that intertrap distance be reduced but not to less than 15 m, still sufficient distance to ensure sample independence (Digweed et al. Reference Digweed, Currie, Carcamo and Spence1995). Almost all traps were at least 50 m from the edges of stands and cut-blocks to minimise edge effects (Spence et al. Reference Spence, Langor, Niemelä, Carcamo and Currie1996; Magura et al. Reference Magura, Tóthmérész and Molnar2001a); however, because of the shape and size of stands H33 (2), H41 (2), and F17 (2), all sampled in period 2, 2–3 traps in each stand were only 15–20 m from the edge. This distance is believed sufficient to minimise edge effects on carabid catch (Bedford and Usher Reference Bedford and Usher1994; Spence et al. Reference Spence, Langor, Niemelä, Carcamo and Currie1996; Phillips et al. Reference Phillips, Cobb, Spence and Brigham2006).
During both periods, pitfall traps operated from late May to early September, encompassing most of the frost-free season in this region and totalling 100–110 sampling days in each year. Traps were placed in the exact same locations for both years of each period, except for the H12 (1), H12 (2), H12 (3), and H42 (3) stands that were sampled only in 2014 to replace other stands sampled in 2013. After a first year of sampling, these latter stands were deemed to be too distant (approximately 15 km) from the others to be included in the study.
Traps were serviced at approximately biweekly intervals, and catches were returned to the laboratory for sorting and preservation in 75% ethanol. Adult carabids were counted and identified to species, using mainly the keys of Lindroth (Reference Lindroth1961, Reference Lindroth1963, Reference Lindroth1966, Reference Lindroth1968, Reference Lindroth1969a, Reference Lindroth1969b) and comparison with authoritatively identified reference materials. Nomenclature followed Bousquet et al. (Reference Bousquet, Bouchard, Davies and Sikes2013). Vouchers of all species were deposited in the insect collection of the Northern Forestry Centre, Canadian Forest Service, Natural Resources Canada, Edmonton, Alberta.
Vegetation and soil variables
Environmental data were recorded around each trap deployed in period 2 and were averaged across all traps in each stand to calculate a value for analysis.
Plant and mineral soil cover
Percentage cover in the combined herb and ground layers was visually estimated for all plant species comprising at least 5% cover in 1-m2 quadrats placed approximately 2 m to the north of each trap, in areas similar to the trap’s immediate surroundings. Mineral soil cover was estimated as percentage of area within these same quadrats. Forbs were identified to species using keys in Royer and Dickinson (Reference Royer and Dickinson2007). Bryophytes and graminoids were not determined to species, but percentage cover was recorded for these broad categories.
Trees
Trees were counted in prism plots (plot radius factor = 3) centred on the trap (Bruce Reference Bruce1955), and each tree tallied was identified to species. The proportion of overall tree basal area represented by each tree species in the prism plot was calculated for each trap. In addition, a convex spherical densitometer (Model-A; Forestry Suppliers, Jackson, Mississippi, United States of America) was used to measure canopy cover over each trap (Strickler Reference Strickler1959). Readings were taken in each cardinal direction with the densitometer held approximately 1.4 m directly above each trap.
Climate data
Data about temperature and precipitation during May–September of both periods, as recorded by Alberta Climate Information Service (2018), were used to interpret changes between periods in data about activity of particular beetle species. We represented conditions for township T049R24W5 (the region of the sample area) by interpolating data from the eight nearest weather stations (Alberta Climate Information Service 2018).
Analyses
To accommodate variation in sampling effort across stands, sample periods, and successive years, all beetles trapped in the same stand during a sample period (i.e., two successive years) were pooled and standardised to number of individuals caught per 1000 trap-days. These standardised measures were compared among stands using analysis of variance as implemented in R (R Core Team 2016), with α = 0.05 to test significance of differences in catch across stand ages and disturbance types. The Shapiro–Wilk test done before analysis of variance confirmed that the catch data could be treated as normally distributed (W = 0.966, P = 0.73), and Bartlett’s test confirmed that variances may be treated as equal (K 2 = 21.9, df = 7, P = 0.003).
Carabid species richness was calculated for unstandardised catch data pooled over each “stand age × disturbance type” combination by coverage-based rarefaction (Chao and Jost Reference Chao and Jost2012) using the iNEXT package in R (Hsieh et al. Reference Hsieh, Ma and Chao2016). This approach estimates total species richness based on the “completeness” of a sample (i.e., its coverage), rather than limiting comparisons based on the lowest sample size as in traditional, individual-based rarefaction. We extrapolated species richness and the 95% confidence interval for each “stand age × disturbance type” combination from 100 randomisations, with total species richness set at twice that observed (Chao and Jost Reference Chao and Jost2012).
Carabid assemblage composition was compared among “stand age × disturbance type” combinations and sampling periods using nonmetric multidimensional scaling based on the standardised catch of each species pooled within each stand, as described above. Basic relationships among assemblages recovering after harvest were established in an initial nonmetric multidimensional scaling. For this ordination, standardised catch data from the harvested age classes collected during each sample period were Hellinger transformed to reduce the disproportionate effect of dominant species (Legendre and Legendre Reference Legendre and Legendre2012). The final nonmetric multidimensional scaling result was calculated after data transformation using distances from the Bray–Curtis dissimilarity index. Once the pattern for harvested stands was established, the species loadings from this initial nonmetric multidimensional scaling model were used to place the burned stands sampled during period 2 and all control stands from both sample periods on the ordination plot for purposes of comparison. The result depicts the relative positions of all stands in ordination space in relation to the best-fit configuration of harvested stands, supporting clear understanding of both the relative effects of fire and the extent of faunal recovery observed. Finally, a permutational multivariate analysis of variance was done to test whether the carabid assemblage data were statistically correlated with stand age. The nonmetric multidimensional scaling ordinations and permutational multivariate analysis of variance test were calculated using the “vegan” package in R using the “rda” and “adonis” functions, respectively (Oksanen et al. Reference Oksanen, Blanchet, Kindt, Legendre, Minchin and O’Hara2013).
A constrained redundancy analysis was also applied to data from period 2 alone to determine the extent to which environmental variables were correlated with carabid assemblage composition. Data about ground vegetation cover, canopy cover, mineral soil cover, and tree basal area, as described above, were included in the redundancy analysis as possible explanatory variables. Positions of all stands were plotted on each redundancy analysis ordination, and the 95% confidence interval was calculated for each “stand age × disturbance type” combination. Statistically significant environmental variables were projected onto the redundancy analysis plot as vectors that describe the strength (vector length) and influence (vector direction) of their effects on the assemblages. Standardised carabid catch data were again used to calculate Hellinger distances for the redundancy analysis. “Stand age × disturbance type” combinations for which 95% confidence intervals do not overlap in the redundancy analysis are considered to differ significantly. The statistical package R (Oksanen et al. Reference Oksanen, Blanchet, Kindt, Legendre, Minchin and O’Hara2013) was used to calculate the redundancy analyses (the “vegan” package) and to evaluate the significance of correlations between environmental variables and carabid assemblage structure (the “anova.cca” function).
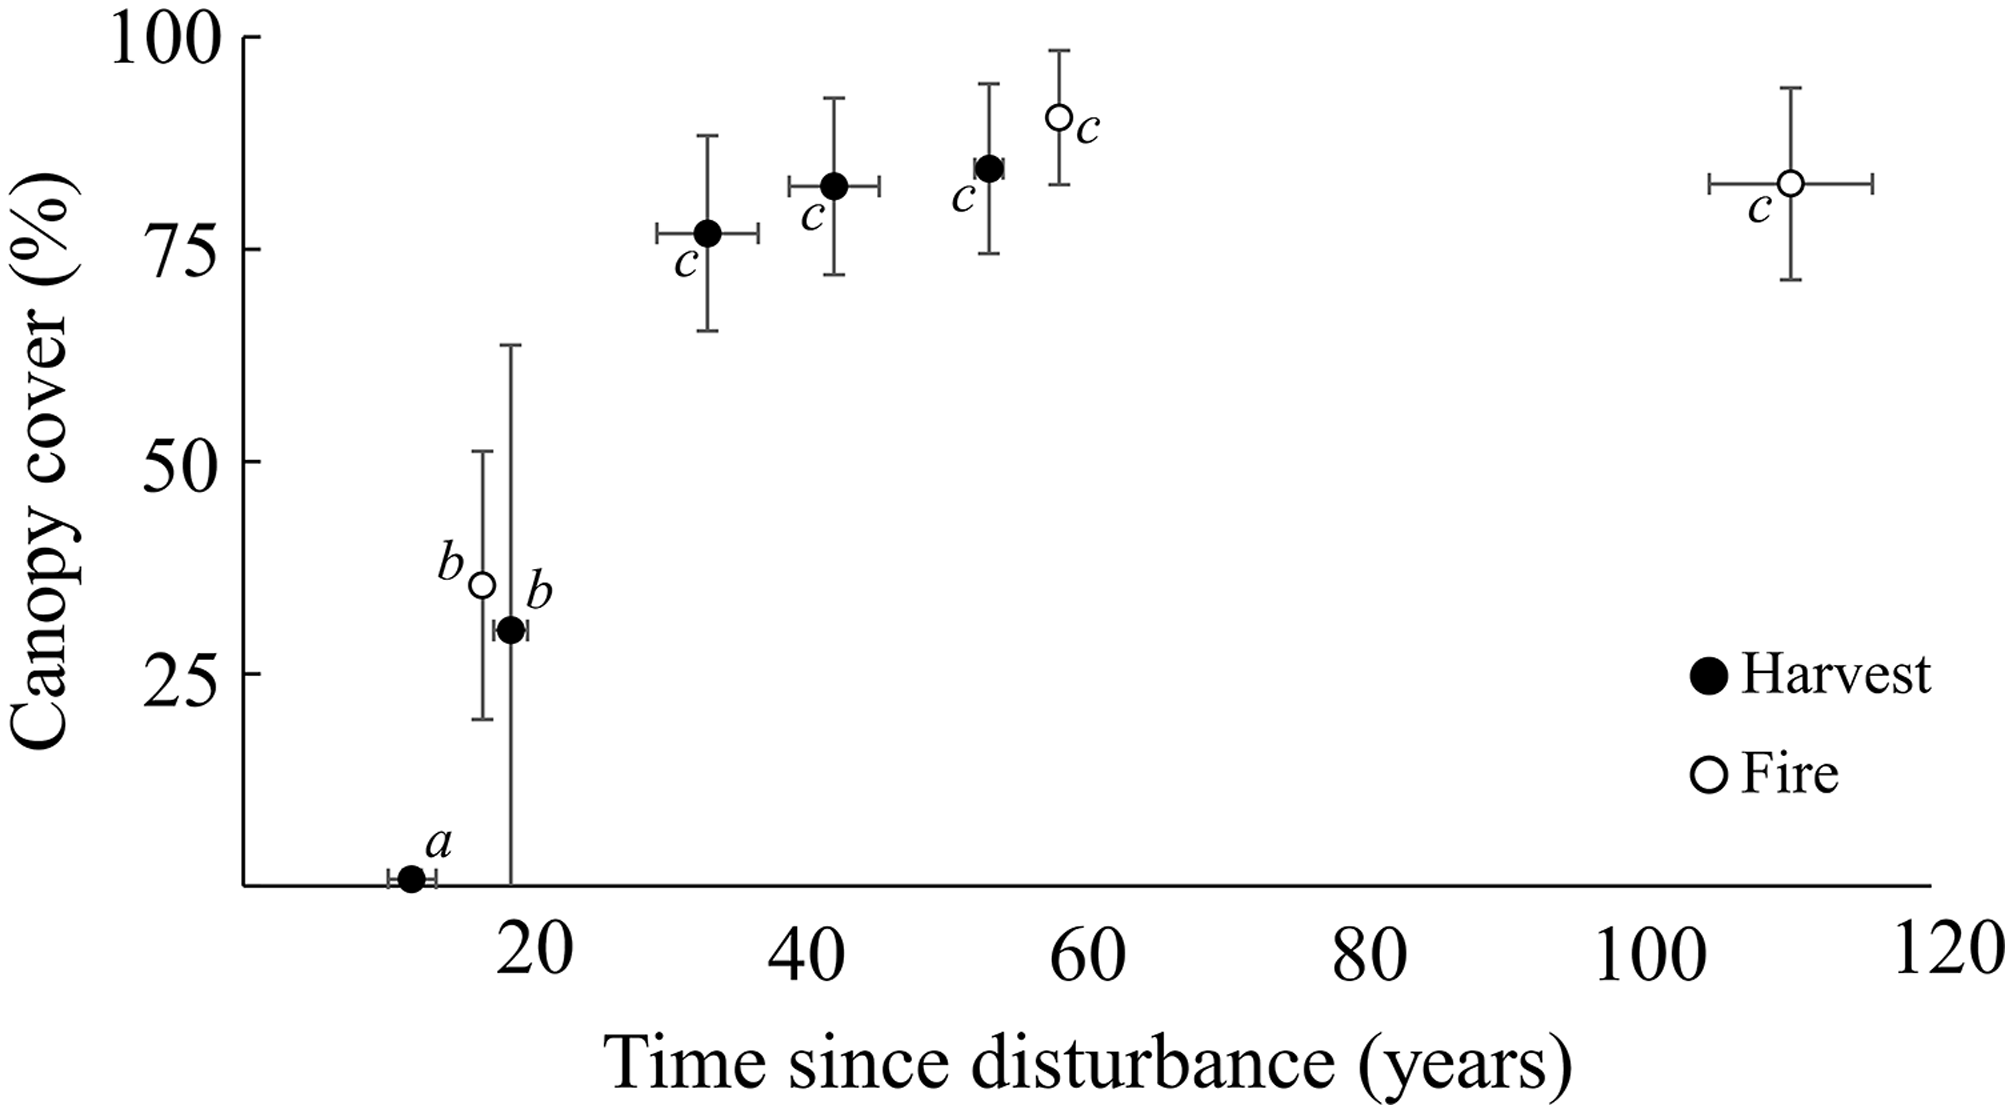
We used data from period 2 to examine the affinity of individual carabid species for stands with open or closed canopies. Because the densitometer data indicated that canopy closure differed dramatically between stands that were less than 19 years postdisturbance and those that were at least 33 years postdisturbance (Fig. 2), we asked whether pooled catch data for particular species were proportional to sampling effort in more open, younger (H12, F17, and H19) versus older (H33, H42, H53, F58, and F110) forest stands that had reached canopy closure. Following the general classification system for carabid affinity for postdisturbance habitats used by Niemelä et al. (Reference Niemelä, Langor and Spence1993), catches of habitat generalist species were not expected to vary greatly between stands of the two canopy-closure categories. In contrast, taxa with affinity for open or closed stands were expected to predominate in the younger and older stands, respectively.
Relationship of average canopy cover and age of postharvest (closed circles) and postfire (open circles) forest stands. Canopy cover is the average proportion of crown vegetation cover based on densiometer measurements taken at each trap. Error bars on the abscissa are the standard deviations among stand ages of each age category, and those on the ordinate axis are the standard deviations of the densiometer data (canopy cover) among all traps in each group. Analyses of variance and subsequent Tukey’s tests revealed three statistically distinct groups based on canopy cover: a, b, and c.

Significance of departure of observed catch data from expectations based strictly on sampling effort was assessed by Chi-square goodness-of-fit tests (df = 1, P < 0.05) using the raw data. Expected values were determined by multiplying the total catch for each species by the summed value for proportion of trapping effort in the stands included in each category from Table 1 (i.e., 0.322 for open stands and 0.678 for closed stands). Therefore, a minimum sample size of 16 individuals was required for each taxon tested to ensure an expected value of at least “5” in both cells, as required for the analysis (Everitt Reference Everitt1992).
Finally, we explored relationships of catch for each species closely associated with either open or closed stands to stand origin (i.e., harvest or fire) and age using simple graphical analyses of means and standard errors to compare catches across “stand age × disturbance type” combinations. When the number of individuals recovered was sufficient, we tested departure of recorded captures for that species in relation to expectations based on sampling effort using Chi-square goodness-of-fit tests (df = 3, P < 0.05), as outlined above, using data from Table 1 to partition effort among the stands as grouped in the histograms.
Results
Catch and species richness
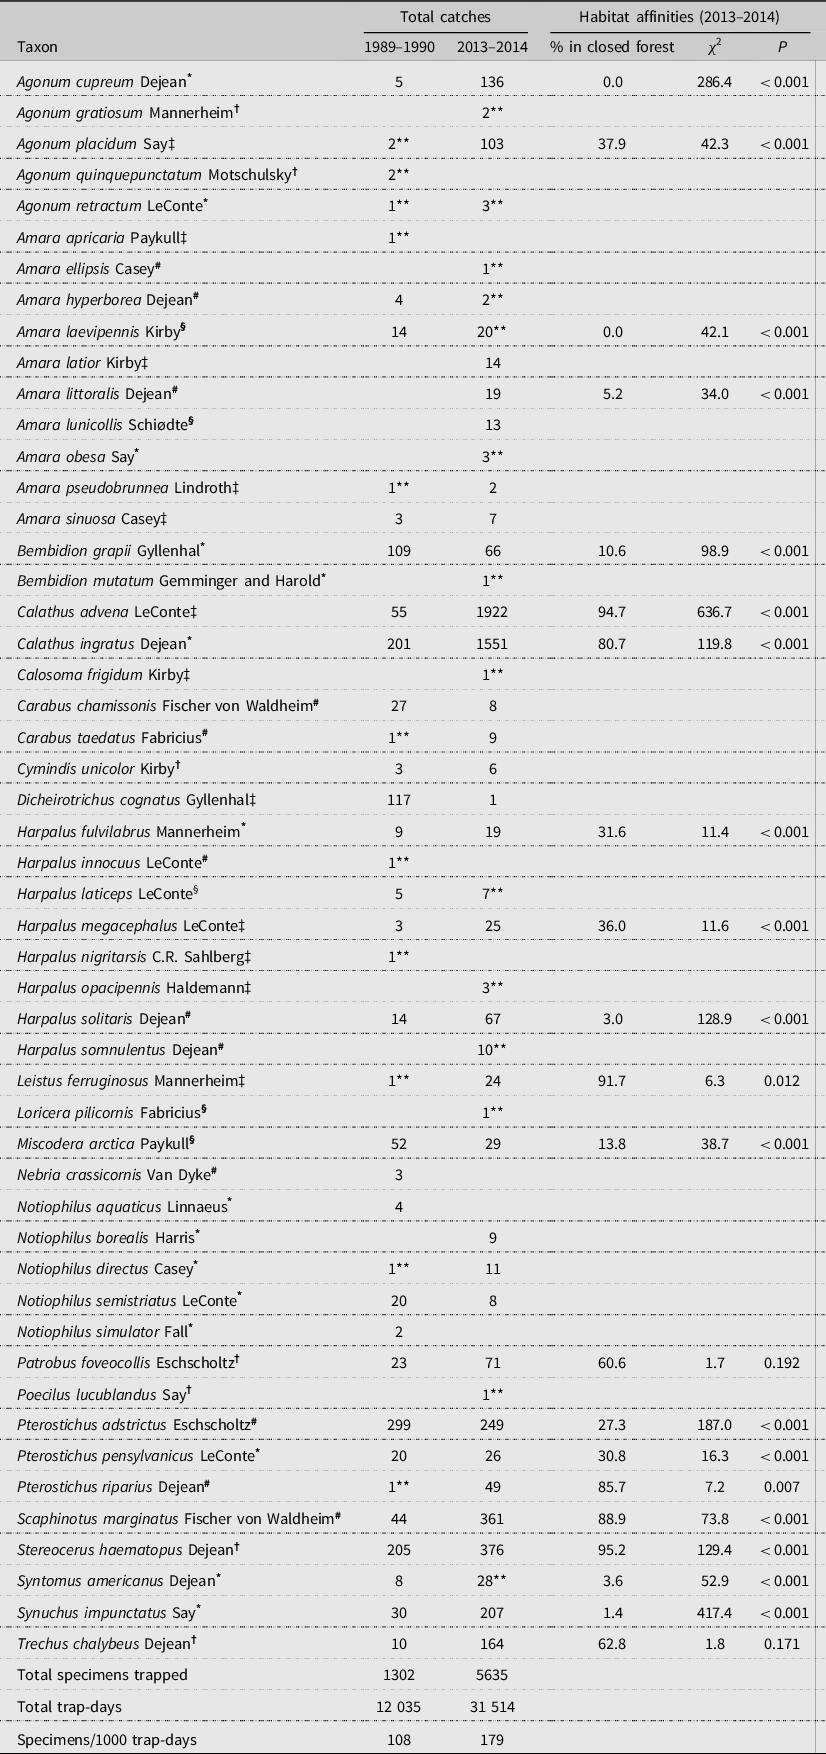
The 1302 beetles trapped from eight stands during period 1 comprised 38 carabid species in 12 035 trap-days (108 beetles/1000 trap-days). In contrast, 5635 ground beetles comprising 44 species were captured during period 2 (Table 2) over a total of 31 514 trap-days (179 beetles/1000 trap-days). Therefore, overall catch rate for carabids was 66% greater in period 2 than in period 1. However, the rate of species accumulation per 1000 trap-days of sampling effort was 4.4 times lower in period 2 (0.72) than in period 1 (3.16), suggesting that the local fauna was more completely sampled during period 2. The standardised catch of each captured species in each sample period and stand is provided in Supplementary material, Table S1.
Overall catch of each carabid species collected in 1989–1990 (12 035 trap-days) and 2013–2014 (31 514 trap-days). Each species with a catch greater than 15 in 2013–2014 was examined for affinity to open-canopy stands (H12, H19, and F17) and closed-canopy stands (all other stands). For each species, percentage of overall catch in old stands was calculated first, and then goodness-of-fit Chi-squared statistics were used to test whether catches in the two habitat categories were proportional to sampling effort (32.2% of effort in open stands; 67.8% in closed stands). Flight ability and known wing morphs are provided for each species as reported by Lindroth (Reference Lindroth1961, Reference Lindroth1963, Reference Lindroth1966, Reference Lindroth1968, Reference Lindroth1969b).

*Dimorphic for flight ability.
†Flightless.
‡Fully winged.
§ At least some individuals fly.
#Unknown.
**Species captured in only one of two sampling years.
The composition and the dominance structure of the fauna varied between the two sampling periods. Although 51 species were collected in total, only 31 (60.8%) were captured in both periods (Table 2). The differences reflected mainly captures of relatively rare species; that is, most of the seven species collected exclusively in period 1 and the 13 species collected only in period 2 were represented by only 1–2 specimens. The most commonly trapped species in period 1 were Pterostichus adstrictus Eschscholtz (23% of total catch), Stereocerus haematopus Dejean (16%), and Calathus ingratus Dejean (15%), and those in period 2 were Calathus advena (LeConte) (34%) and C. ingratus (28%; Table 2). Abundant species were caught in both years of each sampling period; however, some rare species were caught in only one year.
A two-way analysis of variance that included only data from harvested and burned stands of similar age in period 2 (i.e., H19 and F17; H53 and F58) indicated that overall standardised catch rates differed significantly between stand ages (F 1,5 = 6.2, P = 0.038) but not disturbance types (F 1,5 = 0.5, P = 0.82). Similarly, stand age also significantly affected carabid catch rates (F 5,17 = 11.9, P < 0.01) across the entire chronosequence of harvested age classes and the F110 stands (controls) sampled in period 2. Post hoc Tukey’s tests showed that the mean standardised catch rate of beetles was significantly higher in the youngest stands (H12) than in the H19, H33, H42, and F110 stands but that the mean catch rate in the oldest harvested stands (H53) was intermediate (Table 1). Mean overall catch rate in the F110 stands was among the lowest but differed statistically only from that in H12 stands. In contrast, a one-way analysis of variance that included all pyrogenic stand age classes (F17, F58, and F110) found no statistically significant differences in overall catch rates based on stand age (F 1,8 = 1.4, P = 0.28). However, inspection of the data suggests that the lack of a trend reflects high variability in catch rates among the F58 stands that is driven by a much higher beetle catch in just one of three replicates (F58 (1)). Thus, although overall carabid catch rates were higher in young and old stands than in intermediate-aged stands after harvest, this generalisation does not clearly fit the data from postfire stands. The data suggest that carabid catch rates in some older postfire stands are equivalent to or greater than those in the older postharvest stands.
The general pattern of carabid catches from harvested stands along the chronosequence in period 2 was remarkably similar to that from stands of equivalent age sampled in period 1. The highest and most species-diverse catches were from the younger stands in both periods. However, data from the longer chronosequence of period 2 suggest that, after this initial increase, carabid catch rate first falls one to two decades after harvest, rises steadily in older postharvest stands, and then falls again to the modest levels characteristic of the oldest pyrogenic stands. With just two data points for pyrogenic stands, we can say only that the catch in younger stands (F17) was 28.9% lower than in older stands (F58).
Coverage-based rarefactions over all “stand age × disturbance type” combinations based on period 2 data used a lowest maximum coverage value of 97.9% (F17; Table 1). A difference was considered significant if the 95% confidence intervals of the estimates did not overlap. In general, species richness was highest in the youngest harvested stands (H12 and H19), but it fell dramatically in H33 stands before increasing slightly in the middle-aged stands (H42 and H53). In burned stands, species richness was also higher in the younger F17 stands than in the older F58 stands.
Assemblage structure
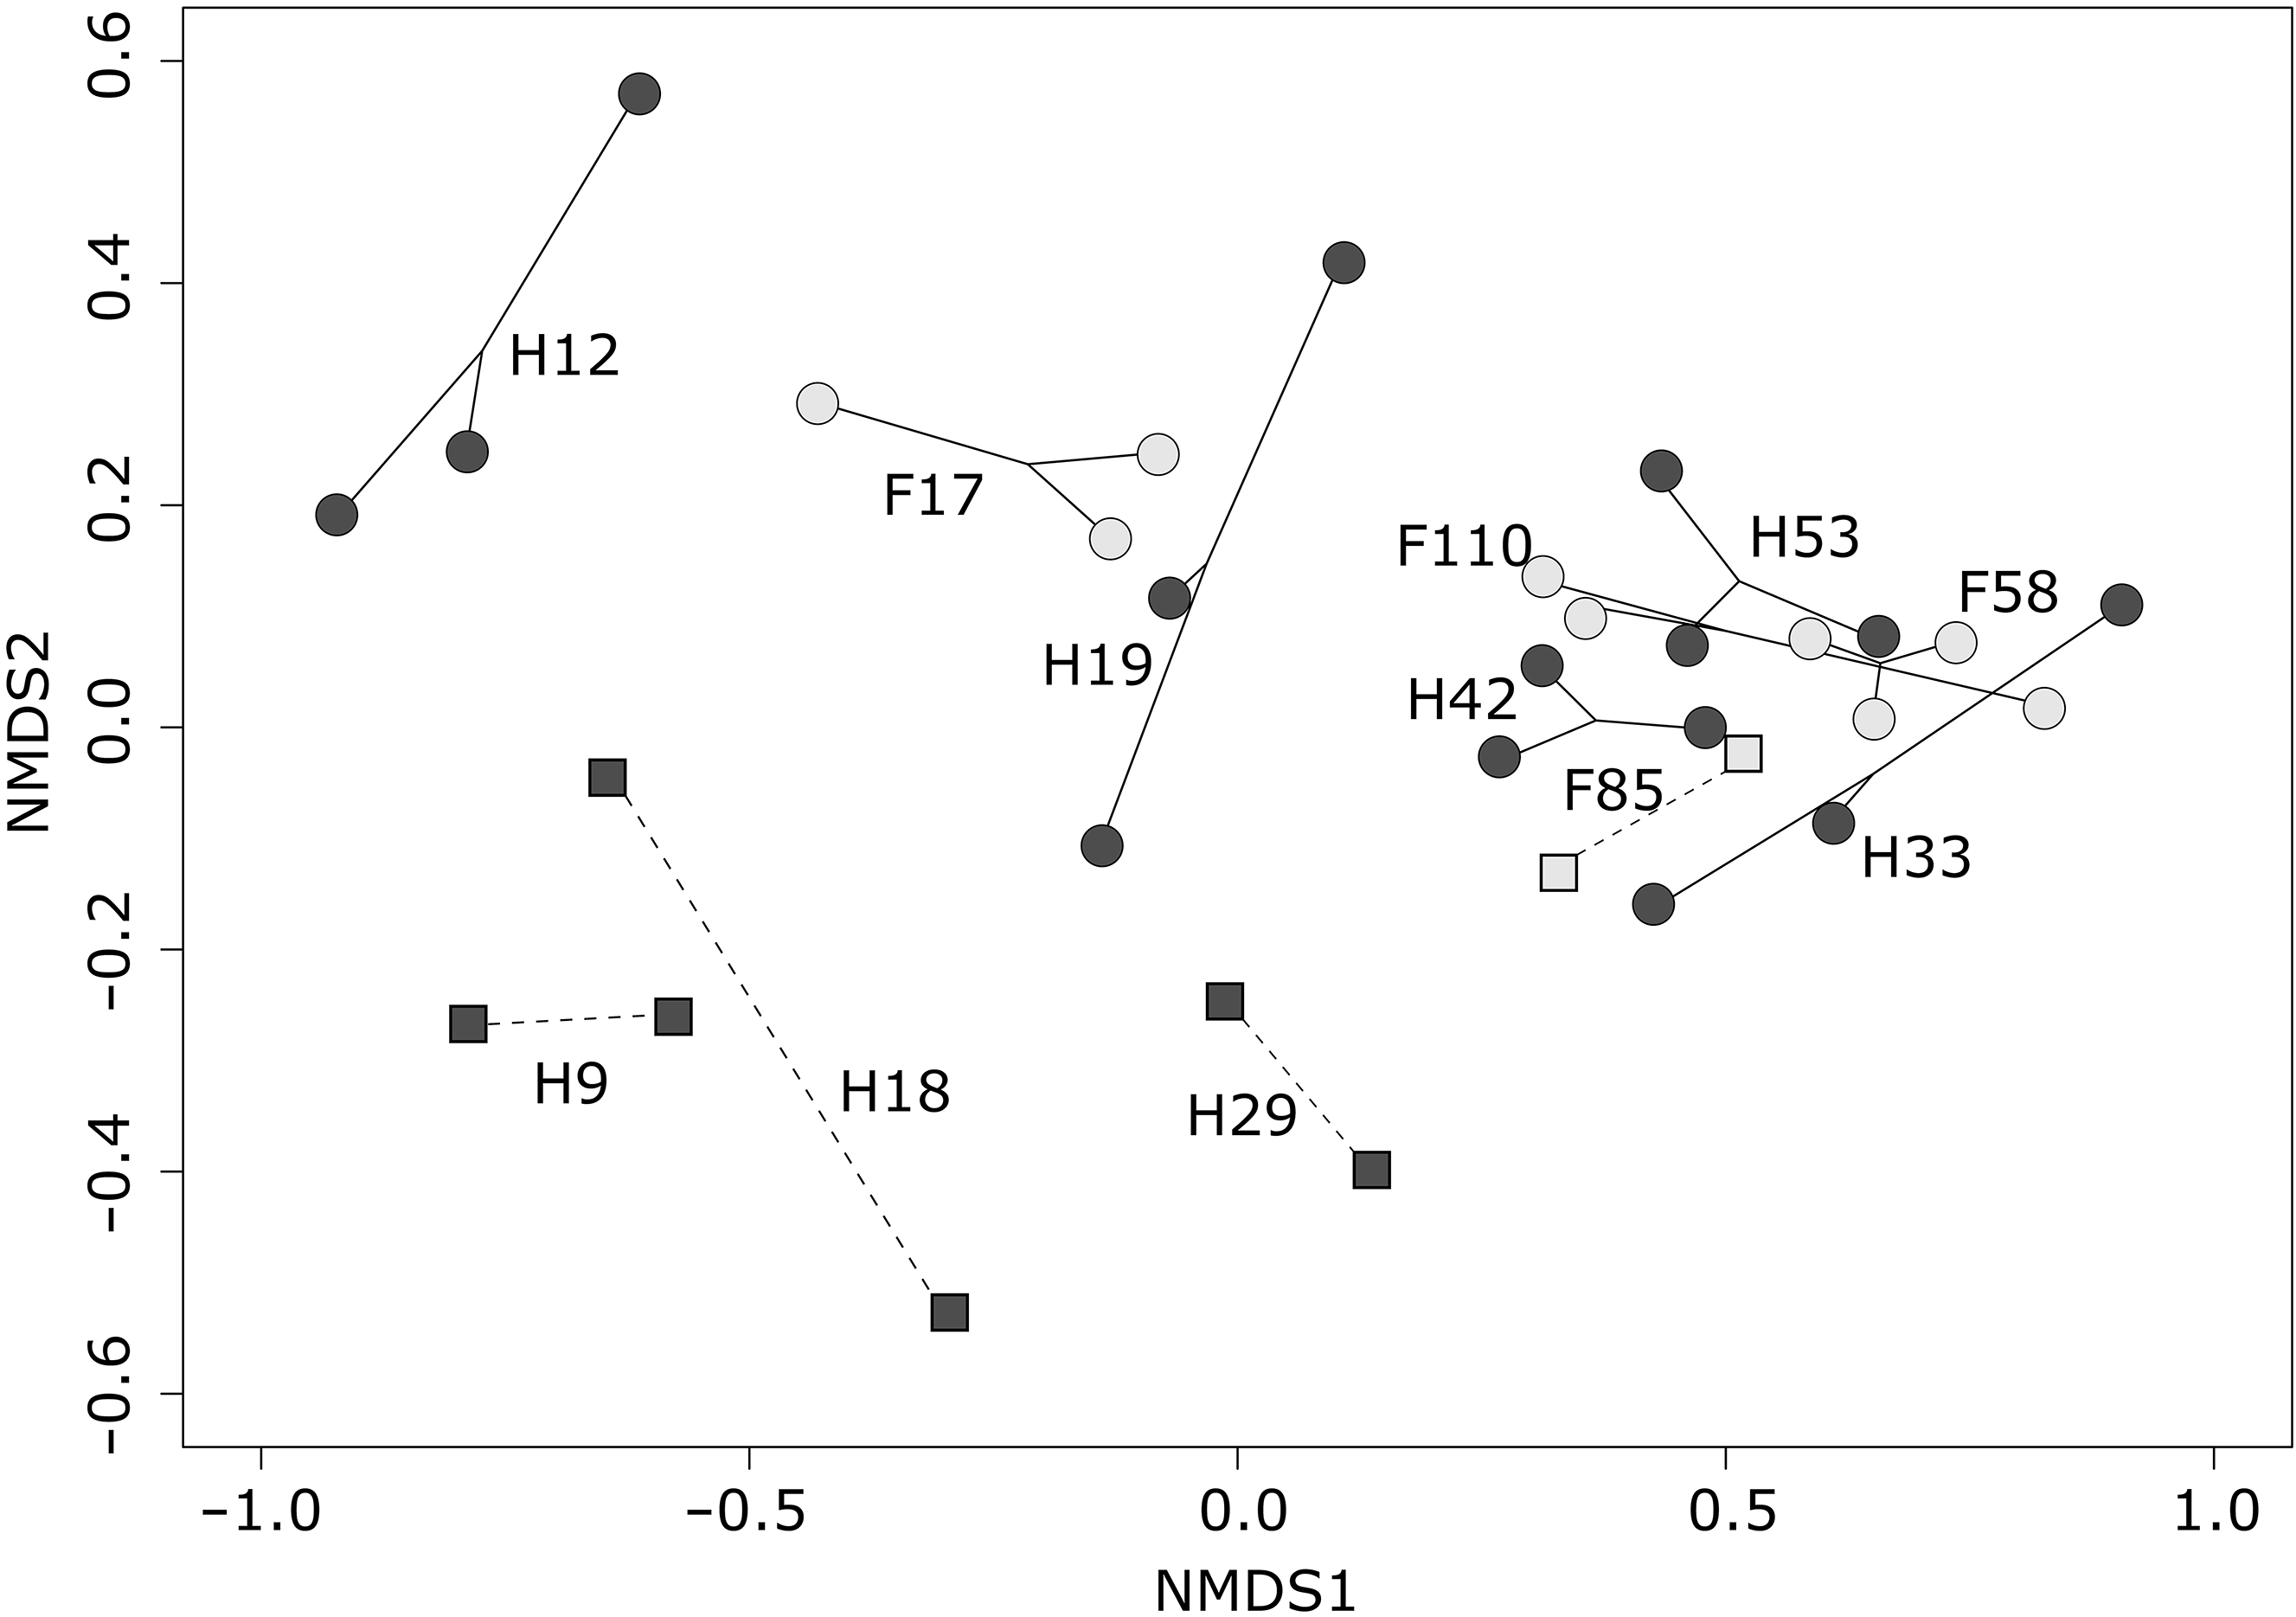
The nonmetric multidimensional scaling analysis resulted in a model (two-dimensional stress = 0.112) explaining 43.1% of total variance in structure of carabid assemblages from harvested stands in both periods (Fig. 3). Of the unconstrained variance, 18.1% and 6.7% were attributed, respectively, to the first two ordination axes. A permutational multivariate analysis of variance applied to the same data was statistically significant (F 7,13 = 4.6, P = 0.001), confirming that carabid assemblage structure was significantly associated with stand age. The data from burned stands superimposed on the ordination based on the species loadings from harvested stands alone convincingly fit the temporal pattern of assemblage change observed for harvested stands.
Nonmetric multidimensional scaling (NMDS1 and NMDS2) ordination of carabid assemblages sampled in harvested (H; black symbols) and burned (F; grey) stands in 1989–1990 (squares) and 2013–2014 (circles). Dissimilarity was calculated as the Bray–Curtis index. Replicate stands within each “stand age × disturbance type” combination are connected by solid lines (2013–2014 stands) or broken lines (1989–1990). Stand labels are defined in Table 1. The model was constructed using only Hellinger-transformed catch data from harvested stands, and coordinates of burned stands were calculated from the nonmetric multidimensional scaling loadings on each species and plotted on the initial ordination. The first two nonmetric multidimensional scaling ordination axes accounted for 18.1% and 6.7% of variation, respectively.

The chronosequence was reflected in the nonmetric multidimensional scaling ordination with stand age generally increasing from left to right (Fig. 3). Based on this, data from period 2 document recovery of carabid assemblages in both burned and harvested stands towards a structure target defined by the pyrogenic control stands (F110). Data about assemblages from stands less than three decades old were widely dispersed in the ordination. This indicates that succession of carabid assemblages is dynamic over the first 30 years postdisturbance, likely involving changes in the populations of many species. By 50–60 years postdisturbance, however, assemblages in the oldest burned (F58) and harvested (H53) stands had converged towards structures that are characteristic of the oldest pyrogenic stands (F110; Fig. 3). The relatively high variation among age–disturbance combinations depicted by the ordination underscores the probable importance of local habitat variation that is not explained by the nonmetric multidimensional scaling model.
Assemblages sampled within approximately the first 35 years postharvest differed between period 1 (H9, H18, and H29) and period 2 (H12, H19, and H33; Fig. 3). Despite this, data from both periods for assemblages in postharvest stands converge towards the preharvest conditions of the pyrogenic controls (F110). Notably, assemblages from H19 and H33 stands sampled in period 2 were more similar to those of older stands from both periods than to those of equivalent ages in period 1, that is, H18 and H29, respectively. Based on this, data from period 1 reflected a slower trajectory of recovery for postharvest carabid assemblages than was seen for assemblages in period 2.
The structure of carabid assemblages in the two mature pyrogenic control stands sampled in both period 1 (F85) and period 2 (the two leftmost F110 stands shown in Fig. 3) changed somewhat over time, indicating that faunal structure is dynamic even in mature, closed-canopy stands. In fact, assemblages in F85 stands were closer to those in H42 and H33 stands than to those in F110 stands in the nonmetric multidimensional scaling ordination. The additional F110 stand added in period 2 (the one furthest to the right in Fig. 3) harboured a markedly different assemblage than did the other old pyrogenic stands, and the carabids of that stand were strikingly similar to those of the H33 postharvest stands. Furthermore, the catch in that particular stand was approximately 80% lower than in the other two F110 stands. Interestingly, the canopy of this stand (F110 (3)) was more open (73.0% ± 6.78% mean canopy coverage) than in the other two stands of the same age (F110 (1): 93.2% ± 1.41%; F110 (2): 81.2% ± 12.33%).
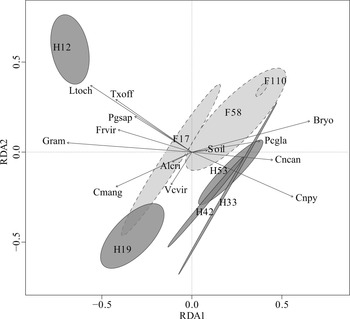
The redundancy analysis based on period 2 data that deal with assemblage structure generally corroborates the main patterns revealed by nonmetric multidimensional scaling but also depicts the correlation and potential explanatory influence of measured environmental variables. The suite of vegetation characteristics projected in Figure 4, for example, was significantly correlated with differences in beetle assemblage composition among “stand age × disturbance type” combinations (analysis of variance: F 7,13 = 5.21, P = 0.001, adj-R 2 = 0.70). Species composition of assemblages and the relative abundances of species therefore are reasonably explained by these variables. As in the nonmetric multidimensional scaling plot, composition of carabid assemblages in stands regenerating after both fire and harvest changed over time towards that which is typical of mature pyrogenic stands. However, in the redundancy analysis, carabid assemblages from the older burned stands (F58) were essentially indistinguishable from those of the F110 stands, whereas those in similarly aged clear-cut stands (H53) differed rather conspicuously from the pyrogenic controls. Thus, the period 2 data suggest that assemblages recovered more quickly after wildfire than after harvest.
Redundancy analysis (RDA1 and RDA2) of carabid beetle assemblages in a chronosequence of harvested and burned stands sampled in 2013–2014. Ellipses represent 95% confidence intervals for each “stand age × disturbance type” combination based on Hellinger transformation of standardised catch data. Dark ellipses with solid boundaries represent harvested treatments, and light ellipses with dashed boundaries represent burned treatments. Only statistically significant environmental (vegetation and soil) variables are depicted as vectors on the redundancy analysis, and vector length is proportional to the strength of the correlation. Stand labels are defined in Table 1. The first two redundancy analysis ordination axes accounted for 13.3% and 7.3% of variation, respectively. Bryo, Bryophytes; Cncan, Cornus canadensis Linnaeus; Gram, Graminoids; Frvir, Fragaria virginiana Duchesne; Pgsap, Picea glauca Moench (saplings); Ltoch, Lathyrus ochroleucus Hook; Vcvir, Vaccinium virgatum Aiton; Cmang, Chamaenerion angustifolium Linnaeus; Txoff, Taraxacum officinale Linnaeus; Soil, Mineral soil; Pcgla, Picea glauca Moench; Alcri, Alnus crispa Chaix; Cnpy, Canopy.

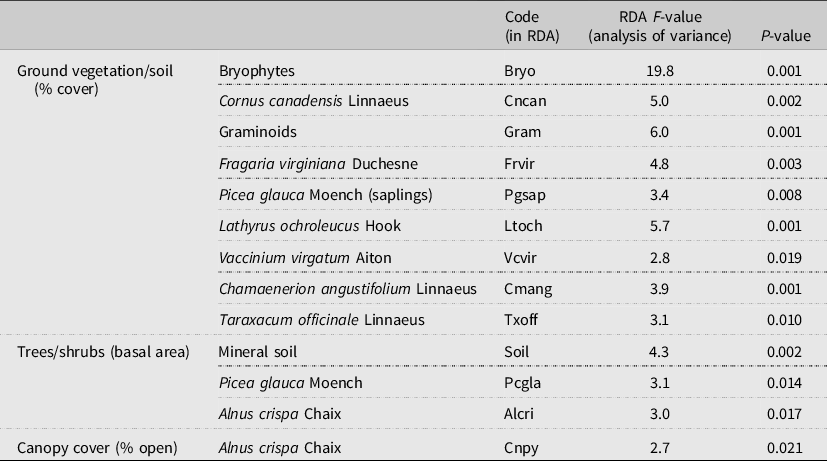
Vegetation variables explained 37.5% of the variance in the beetle catch and accounted for 32.4% of the variance in the constrained redundancy analysis model. In combination, 13 variables – 10 of which were related to percentage cover by ground vegetation or exposed mineral soil, two reflected basal area of white spruce and mountain alder (Alnus crispa Chaix), and the variable dealing with canopy cover – accounted for most of the constrained variance in species composition of carabid assemblages (Table 3). The following explanatory patterns are evident in the redundancy analysis (Fig. 4):
-
(1) Carabid assemblages of the youngest harvested stands (H12) clustered furthest away from those in F110 stands. Vegetation variables that closely correlated with H12 carabid assemblages included high percentage ground cover by graminoids, white spruce saplings, cream pea (Lathyrus ochroleucus Hook (Fabaceae)), dandelion (Taraxacum officinale Linnaeus (Asteraceae)), and wild strawberry (Fragaria virginiana Duchesne (Rosaceae)).
-
(2) Carabid assemblages of the H19 and F17 stands overlapped, although the F17 assemblages were closer to the recovery target defined by those of the F110 stands in the redundancy analysis. High percentages of ground cover by fireweed (Chamaenerion angustifolium Linnaeus (Onagraceae)) and wild blueberry (Vaccinium virgatum Aiton (Ericaceae)), and basal area of mountain alder (Alnus crispa) were associated with the structure of carabid assemblages in these young stands. This likely reflects the emergence of a distinct shrub community.
-
(3) Carabid assemblages in middle-aged harvested stands (H33, H42, and H53) clustered together and were closely associated with high percent cover by bunchberry (Cornus canadensis Linnaeus (Cornaceae)) and increased canopy cover. These assemblages clustered near the oldest burned stands (F110), supporting an inference of carabid recovery towards the assemblage structure of mature stands. Variability of assemblages, as reflected by 95% confidence intervals, was highest among H33 stands but decreased in older harvested classes.
-
(4) Carabid assemblages in the oldest pyrogenic stands (F58 and F110) were strongly correlated with high ground cover of bryophytes and increasing basal area of white spruce. Assemblages in F110 stands were the most variable in the redundancy analysis (largest 95% confidence interval), likely influenced by the more open canopy structure of a single stand as noted above in this section. Assemblage structure in the youngest pyrogenic stands was more positively correlated with mineral soil cover than were assemblages in other pyrogenic stands.
-
(5) Despite evidence of faunal recovery in both harvested and burned stands, 95% confidence intervals for carabid assemblages in older stands of similar age but different disturbance histories (F58 and H53) did not overlap, clearly showing that the observed recovery of assemblages differed between the two disturbance types. None of the environmental variables that we measured explained the difference between these stands in the redundancy analysis. However, the relative positions of these assemblages in the ordinations suggest that recovery towards the target defined by old pyrogenic stands was achieved more quickly after fire than after harvest, as is noted above in this section.
Summary of statistically significant vegetation and soil variables included in the redundancy analysis (RDA) model (Fig. 4).

Responses of individual species
Among the 21 species captured in sufficient numbers in period 2 to support statistical analysis, only two (Patrobus foveocollis Eschscholtz and Trechus chalybeus Dejean) were captured in approximate proportion to expectations based on sampling effort in data pooled to reflect captures in either open or closed stands (Table 2; note: in period 1, T. chalybeus was misidentified as Trechus oregonensis Hatch). In this way, the longer chronosequence of period 2 shows that populations of these two species do not respond conspicuously to canopy closure and that both species behave as forest generalists in our study area.
Thirteen species showed significant affinity for open stands (Table 2). Of these, Agonum cupreum Dejean and Amara laevipennis Kirby were not collected in any closed stands and Amara littoralis Dejean, Harpalus solitaris Dejean, Syntomus americanus Dejean, and Synuchus impunctatus Say were only rarely (5.2% or less) collected outside of open stands. The few individuals of the latter four species collected in closed stands are likely incidental captures of individuals dispersing in search of suitable habitat. The other seven species captured in open stands in significantly greater numbers than predicted from sampling effort were still less restricted to open stands, with percent of total captures ranging from 10.6 to 37.9% there (Table 2).
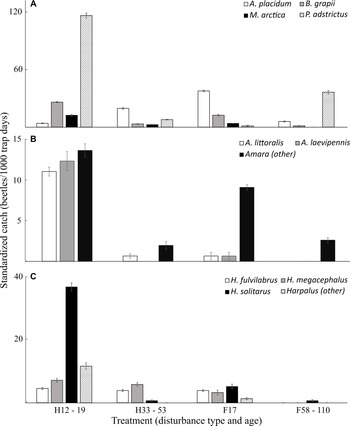
The distribution of captures for some species with affinity for open stands was affected by disturbance type at least as much as by degree of canopy closure but in a variety of ways (Fig. 5A). Although Agonum placidum Say was caught disproportionately to sampling effort in open fire-origin stands (F17), fewer were caught in open harvested stands than in closed stands. In contrast, Bembidion grapii Gyllenhal was most disproportionately represented in open stands regardless of origin, but a small number were found in closed stands of both origin types. Distribution of captures for P. adstrictus was somewhat enigmatic, with this species most disproportionately captured in open harvest-origin stands and the oldest fire-origin stands compared to much lower capture rates in the other two stand types. Although the sample size for Miscodera arctica Paykull was too low for statistical comparison against expectations of catch for the four age–origin combinations, our data suggest that this species was most commonly captured in the harvest-origin young stands, was rarer in open stands of fire origin, and was most uncommon in the oldest pyrogenic stands.
Standardised catches (± standard error) of 11 carabid taxa significantly associated with open-canopy stands and the distribution of catch across open harvested (H12–19; N = 6), closed harvested (H33–53; N = 9), open pyrogenic (F17; N = 3), and closed pyrogenic (F58–110; N = 6) stands: A, Agonum placidum, Bembidion grapii, Miscodera arctica, and Pterostichus adstrictus; B, Amara: A. littoralis, A. laevipennis, and data pooled for comparison about eight other species not sufficiently numerous for statistical assessment of species-level habitat affiinity; and C, Harpalus: H. fulvilabris, H. megacephalus, H. solitaris, and data pooled for comparison about five other species not sufficiently numerous for statistical assessment of species-level habitat affiinity; note: fewer than 5% of Harpalus solitaris were captured outside of H12–H19 stands.

Although we lumped Amara and Harpalus species as open-habitat species in period 1, conspicuous species differences in the larger data set from period 2 prompted us to not pool data across congeneric species to increase sample size for statistical tests. For example, a few captures of Amara littoralis Dejean were recorded in both fire-origin open stands and harvest-origin closed stands, despite numbers being significantly greater than expected in harvest-origin open stands (Fig. 5B). In contrast, Amara laevipennis Kirby were captured only in open stands, mainly of harvest origin (Fig. 5B). Catches of both species were high in harvest-origin open stands but lower in open stands that had burned. Data are too few for statistical analyses about other species in these genera. Nonetheless, the pattern for the pooled data for less commonly captured Amara species suggests that some were restricted to open habitats and more frequently captured in the fire-origin stands (Fig. 5B).
Harpalus species exhibited a different pattern (Fig. 5C). The commonly collected species, Harpalus solitaris Dejean, was trapped in all four age–disturbance combinations, but captures were most common in open stands of harvest origin. In contrast, the two species most commonly collected in closed stands, H. megacephalus LeConte and H. fulvilabrus Mannerheim, were not trapped in old pyrogenic stands. The pooled data for other Harpalus species at Hinton suggest that they are found only in open stands and are more common after harvest than after fire. These comparisons underscore that such patterns should be analysed at the species level and that there is more to learn about habitat use in genera that are commonly reported as associated with open habitats.
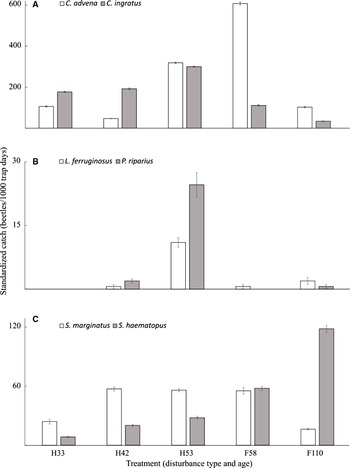
During period 2, six species were significantly associated with closed forest, four of which were the most commonly collected species over the entire study (Table 2). In order to test whether the abundance of any of these species was strongly associated with stand age or origin, we focused on the potential effects of stand origin over the more limited range of postdisturbance age in closed stands (i.e., those ≥ 33 years postdisturbance). All six species were found in the oldest pyrogenic stands, and captures for all but Leistus ferruginosus Mannerheim differed significantly from expectations based on sampling effort. Sample size was too low for a Chi-squared test of the overall pattern for L. ferruginosus.
The pattern of captures varied clearly among all six species (Fig. 6). Both species of Calathus were about equally common in H53 stands, but C. ingratus was captured more often than C. advena in H33 and H42 stands and C. advena was more common in fire-origin stands (Fig. 6A). Although the two Calathus species were the most commonly collected species during period 2, their capture rates were relatively low in the oldest pyrogenic stands. Captures of L. ferruginosus and Pterostichus riparius Dejean were distinctly highest in H53 stands, absent in H33 stands, and relatively uncommon in H42 and pyrogenic stands (Fig. 6B). Scaphinotus marginatus Fischer von Waldheim was most common in H42, H53, and F58 stands, showing no clear differences in capture rates between harvest- and fire-origin stands, although it was captured in relatively low numbers in the oldest pyrogenic stands (Fig. 6C). In contrast, Stereocerus haematopus catches increased with stand age and were greatest in the oldest fire-origin stands.
Standardised catches (± standard error) of six carabid species significantly associated with closed-canopy stands – Calathus advena, Calathus ingratus, Leistus ferruginosus, Pterostichus riparius, Scaphinotus marginatus, and Stereocerus haematopus – displayed over stand age classes grouped according to origin (i.e., either harvest (H) or fire (F)). N = 3 for each treatment.

Discussion
Dynamics of carabid assemblages
Both the 2013–2014 chronosequence study and the repeated measures of the same six harvested stands across both sampling periods support our prediction that assemblages in stands recovering after harvest or wildfire would eventually approach the composition and structure of never-cut pyrogenic stands. Carabid assemblages in stands regenerating 9–58 years after disturbance progressed towards their presumed predisturbance states, as defined by assemblages of old pyrogenic stands. Period 2 data revealed that carabid assemblages in the youngest stands (H12) differed most from controls (F110), but the catches and species richness of open-habitat species in those stands fell steeply in the F17 and H19 stands, as is consistent with other studies (Holliday Reference Holliday1991; Niemelä et al. Reference Niemelä, Langor and Spence1993, Reference Niemelä, Koivula and Kotze2007; Koivula et al. Reference Koivula, Kukkonen and Niemelä2002; Buddle et al. Reference Buddle, Langor, Pohl and Spence2006; Fuller et al. Reference Fuller, Oliver and Leather2008; Johansson et al. Reference Johansson, Hjältén, Olsson, Dynesius and Roberge2016). Because of the relatively short time frame available after forest disturbance for colonisation and population development of many open-habitat species, their regional persistence in broadly forested areas must therefore depend both on dispersal by flight (e.g., Turin and den Boer Reference Turin and den Boer1988; Fahy and Gormally Reference Fahy and Gormally1998) and on continued disturbance to establish suitable young stands. Most species of open habitats are either fully winged or dimorphic for wing length (Karen et al. Reference Karen, O’Halloran, Breen, Giller, Pithon and Kelly2008), as is the case for the species in this study (Table 2).
Before large-scale commercial logging began in the region in 1954 (Bott et al. Reference Bott, Murphy and Udell2003), wildfire was the main large-scale disturbance that created ecological conditions suitable for open-habitat species in Alberta’s Cordilleran forests (Van Wagner et al. Reference Van Wagner, Finney and Heathcott2006). As a result, harvesting has likely increased the regional population size of these species, at least on coniferous landscapes (Spence et al. Reference Spence, Langor, Niemelä, Carcamo and Currie1996). In addition, the increased disturbance by wildfires predicted under climate change scenarios (Flannigan et al. Reference Flannigan, Krawchuk, Groot, Wotton and Gowman2009; Pechony and Shindell Reference Pechony and Shindell2010; Coogan et al. Reference Coogan, Robinne, Jain and Flannigan2019) may also increase habitat availability for these species and for strictly pyrophilic species (e.g., Sericoda spp.) associated with recent burns (Koivula et al. Reference Koivula, Cobb, Déchêne, Jacobs and Spence2006; Cobb et al. Reference Cobb, Langor and Spence2007), although our data cannot address this possibility.
Although both the nonmetric multidimensional scaling and the redundancy analysis ordinations show that carabid assemblages of H19 stands became more similar to those of old pyrogenic stands than of H12 stands, in part due to decreased catches of open-habitat species, these assemblages remained different from those in H33, H42, and H53 stands. Assemblages in these latter three age classes were similar, suggesting that they stabilised around the time of canopy closure. According to the redundancy analysis, however, they remain distinct from assemblages of mature pyrogenic stands (F110), as is similar to findings about carabids in jack pine (Venier et al. Reference Venier, Work, Klimaszewski, Morris, Bowden and Kwiaton2017).
Assemblage recovery, as depicted in the nonmetric multidimensional scaling ordinations, was faster in period 2 than in period 1, and our data therefore do not support our second prediction. This may be explained partly by effects of differences in temperature and moisture on catches between periods. The warmer and drier conditions observed between May and September in the foothills south of Hinton during period 2 (Table 4) are consistent with the well-documented warming trend seen across the Rocky Mountain region (Byrne et al. Reference Byrne, Fagre, MacDonald and Muhlfeld2014; Hansen and Phillips Reference Hansen and Phillips2015). Changes in environmental conditions influence carabid activity, phenology, and dispersal and have implications for population performance (Saska and Honek Reference Saska and Honek2003; Venn Reference Venn2016; Pozsgai et al. Reference Pozsgai, Baird, Littlewood, Pakeman and Young2018; Tseng et al. Reference Tseng, Kaur, Soleimani Pari, Sarai, Chan and Yao2018). Therefore, when temperature and moisture conditions favour or deter activity or reproduction of a species, one should expect, respectively, higher or lower catch rates (Honek Reference Honek1997; Brandmayr and Pizzoloto Reference Brandmayr and Pizzolotto2016). Although our comparison of local temperatures and moisture levels between periods (Table 4) shows that minimum temperatures were slightly lower during period 2, the significantly warmer temperatures reflected in higher average daily and monthly maxima may have promoted the higher capture rates of carabids seen in period 2. Furthermore, over time, warmer temperatures could accelerate processes that drive changes in carabid population development and assemblage composition along forest successional gradients.
Average (± standard deviation) monthly weather data (temperature and accumulated precipitation) during the 1989–1990 and 2013–2014 field seasons (May–September). The bottom row shows percentage change in means between 1989–1990 and 2013–2014.

Warming between periods may also explain three striking compositional changes apparent in our data. Dicheirotrichus cognatus Gyllenhal was found mostly in younger regenerating stands in period 1, suggesting it could be favoured by the continued logging and an increased creation of open habitats between periods. In fact, catch rates fell by 99% in period 2. This species is generally concentrated in cooler northern areas (Lindroth Reference Lindroth1968, pp. 875–876), and a locally warming climate (Byrne et al. Reference Byrne, Fagre, MacDonald and Muhlfeld2014; Hansen and Phillips Reference Hansen and Phillips2015) could explain its decline in the Hinton area. Warming climate could also explain the 70% decrease in catch rate between sample periods for the cold-adapted species Carabus chamissonis Fischer von Waldheim. In contrast, catches of A. placidum, a species near the northern edge of its range and “pronouncedly xerophilous” according to Lindroth (Reference Lindroth1966, p. 644), increased dramatically (approximately 50×) between periods, perhaps in response to the prevailing warmer and drier conditions. Our study was not designed to assess impacts of climate change, and the linkage between correlation and causation must be viewed with caution. Nevertheless, such faunal changes suggest that the potential effects of climate change on these montane carabid assemblages warrant further investigation.
Responses to wildfire versus clear-cut harvest
Support for our prediction concerning trajectory and rate of recovery in burned and harvested stands was mixed. Despite similar trends in species richness and overall carabid activity, assemblage structure differed between postharvest and postwildfire stands as they regenerated. Carabid assemblages developed towards similar composition after both fire and harvest but, in line with our expectations, at different trajectories and rates of postdisturbance recovery. Carabid assemblages from F17 stands were much closer in redundancy analysis ordination space to those of the old-growth F110 stands than to those of the H19 stands that were much closer in age. Although this community-level pattern is similar to findings of Venier et al. (Reference Venier, Work, Klimaszewski, Morris, Bowden and Kwiaton2017), it contrasts with those of other studies that have noted delays in recolonisation by some boreal carabid species after burns compared to after harvest (Holliday Reference Holliday1991; Wikars and Schimmel Reference Wikars and Schimmel2001; Buddle et al. Reference Buddle, Langor, Pohl and Spence2006). It seems likely that such differences reflect differences in wildfire intensity; however, no data are presently available to test this hypothesis.
Different responses to harvest and fire may be rooted in natural history for at least some species. For example, catch rate was much higher for A. placidum, S. americanus, and S. haematopus in the F17 stands than in the H19 stands. As xerophilic species (Lindroth Reference Lindroth1966, pp. 531 and 613, Reference Lindroth1969b, p. 1056), their populations likely are favoured by the somewhat drier conditions of postburn stands. In contrast, catches of L. ferruginosus, a species associated with moderately moist, shaded ground (Lindroth Reference Lindroth1961, pp. 56–57), were relatively more abundant in H53 than in F58 stands, even though the F58 stands had high cover of bryophytes, which are generally associated with higher soil moisture (Lee and La Roi Reference Lee and La Roi1979). Nonetheless, deciduous litter cover, which in our experience is positively associated with presence of L. ferruginosus (J.R. Spence, unpublished data), is generally low in conifer stands but was more evident in H53 stands. Given the striking differences between the position of H53 and F58 assemblages in the redundancy analysis built from only period 2 data, it seems likely that trajectories of assemblage recovery depend on species-specific responses to differences in habitat characteristics in burned and harvested stands (e.g., Magura et al. Reference Magura, Ködöböcz and Tóthmérész2001b; Gandhi et al. Reference Gandhi, Spence, Langor, Morgantini and Cryer2004).
Relationships between assemblages and ground vegetation
Carabid catch and assemblage structure clearly vary with microhabitat (Niemelä et al. Reference Niemelä, Haila, Halme, Pajunen and Punttila1992, Reference Niemelä, Haila and Punttila1996; Fuller et al. Reference Fuller, Oliver and Leather2008; Pinzon et al. Reference Pinzon, Wu, He and Spence2018). We found that variation in mineral soil exposure, percentage cover by nine plant taxa, basal areas of white spruce and mountain alder, and percent canopy closure were each statistically correlated with carabid assemblage structure. The relative abundance of plant species reflects underlying abiotic conditions, such as soil pH, soil moisture, and sun exposure, that in turn influence carabid assemblages (Niemelä and Spence Reference Niemelä and Spence1994; Gough et al. Reference Gough, Shaver, Carroll, Royer and Laundre2000). For example, increased cover of graminoids, which is associated with high exposure to sunlight and relatively low cover of trees or shrubs, was correlated with carabid assemblage structure in the youngest harvested stands (H12) in the redundancy analysis. Some carabids that are strongly associated with open habitats feed on grass seeds (species of Amara and Harpalus; Lindroth Reference Lindroth1968), a food source undoubtedly more available in open stands than in closed stands. Such factors likely account for some of the unexplained variation in the nonmetric multidimensional scaling ordination.
The association of understorey vegetation with carabid assemblage structure in these forests supports our fourth prediction. However, we suggest that correlations between particular plant species and carabid assemblages largely reflect conditions common to particular stages of stand development. There are well-documented relationships between α-diversity of both groups that are convincingly connected to drivers rooted in general forest character rather than to strong correlations between abundance of particular species (Niemelä and Spence Reference Niemelä and Spence1994; Zou et al. Reference Zou, Sang, Wang, Warren-Thomas, Liu and Yu2015; Jouveau et al. Reference Jouveau, Toïgo, Giffard, Castagneyrol, Van Halder, Vétillard and Jactel2020). Furthermore, Pinzon et al. (Reference Pinzon, Wu, He and Spence2018) recently showed that carabid and understorey plant diversity vary independently at different local scales in the boreal mixedwood. Because it therefore seems unlikely that specific changes in plant species composition during succession drive variation in carabid assemblages, understanding how carabid biodiversity varies in response to particular management regimes will require that it be monitored directly; that is, plants are not an effective conservation umbrella for ground beetles.
Responses of individual species
The multivariate analyses employed in this study statistically summarise the cumulative population-level responses of a suite of individual species to changing conditions. Our ordinations show that carabid assemblages are dynamic on these forested Cordilleran landscapes and that population performance varies among carabid species in relation to both stand age and disturbance type. Understanding the species-specific responses to habitat change that underlie the patterns revealed in the ordinations is necessary to connect community structure to the population processes of the constituent species. In addition, these connections can underpin strategies to conserve biological diversity by illuminating risks for species on a landscape that has been intensively harvested and fragmented over almost 70 years.
Niemelä et al. (Reference Niemelä, Langor and Spence1993) identified habitat associations that are thought to drive the changes of 24 carabid taxa in recovering postharvest assemblages. Here, we compare the inferences of Niemelä et al. (Reference Niemelä, Langor and Spence1993) with those based on period 2 data in order to address our fifth prediction. Four species (Nebria crassicornis Van Dyke, Platynus decentis (Say), Platynus mannerheimi (Dejean), and Pterostichus brevicornis (Kirby)) designated as mature-forest specialists by Niemelä et al. (Reference Niemelä, Langor and Spence1993) were collected only north of Hinton during period 1 and were not collected south of Hinton during period 2. We think it unlikely that these species had disappeared before the period 1 study from the area south of Hinton because of its longer history of intensive logging, and we suggest that these faunal differences more likely reflect differences in the availability of ecosites in the two regions (Langor et al. Reference Langor, Pohl and Hammond2006).
Data from period 2 were sufficient to support statistical inferences about habitat use of 21 species, or about half of the number of species collected. Two of those 21 species, P. foveocollis and T. chalybeus, showed no response to canopy closure in period 2. Although designated, respectively, as open-habitat and mature-forest specialists based on period 1 data, the longer chronosequence of period 2 shows that these two species behave as habitat generalists in our study area, corroborating observations of Lindroth (Reference Lindroth1961, pp. 185 and 187).
No comparisons between sample periods are possible for six species that were captured too rarely in one of the two periods to support firm conclusions. Among these, A. cupreum, A. placidum, and S. americanus, which are associated with xeric open habitats, were caught in greater numbers during period 2. Although period 2 data for the two Agonum species support a designation of open-habitat specialisation, the species seem to have affinity for different disturbance types. Agonum cupreum was more commonly collected in early postharvest stands, and A. placidum was strongly associated with recent wildfire, with most specimens being captured in F17 stands. Lindroth (Reference Lindroth1966, pp. 596 and 613) describes both species as predominantly found in open country with somewhat sandy soils, and Holliday et al. (Reference Holliday, Floate, Cárcamo, Pollock, Stjernberg and Roughley2014) found both Agonum species are quite common in agricultural habitats. Interestingly, recent extensive sampling of carabids in many grassland and forested sites (both recently burned and unburned) in Waterton Lakes National Park, which is situated at the southern extent of the eastern foothills of the Rocky Mountains in Alberta, shows that A. cupreum and A. placidum rarely co-occur (D.W. Langor, unpublished data). There, A. placidum is found almost always in mature aspen-dominated and mixed conifer–deciduous forests, whereas A. cupreum is found always in grasslands. In the present study, all eight individuals of S. americanus captured during period 1 and 27 of 28 specimens captured in period 2 were from open stands, and this habitat affinity is corroborated by Lindroth (Reference Lindroth1969b, pp. 1056–1057) and Bell et al. (Reference Bell, Phillips, Floate, Hoemsen and Phillips2014) and by recent work in the southwestern Alberta foothills (D.W. Langor, unpublished data).
As mentioned above, the number of captures of two species associated with cooler or more northern areas fell considerably in period 2, and habitat designations therefore could not be tested statistically. Dicheirotrichus cognatus was clearly associated with open forests in period 1, corroborating previously reported habitat affinity (Lindroth Reference Lindroth1968, pp. 875–879), but the species was represented by only one specimen from period 2. Carabus chamissonis was captured only from mature stands in period 1, but the eight specimens captured in period 2 were too few to support statistical analysis. Nonetheless, the species was collected from a H33 stand, suggesting that it should not be unequivocally designated a mature-forest specialist.
In period 2, P. riparius showed strong association with closed stands, corroborating the report by Lindroth (Reference Lindroth1966, pp. 520–521) and observations in the foothills of southwestern Alberta (D.W. Langor, unpublished data). The fact that more than 77% of specimens of this species were collected from a single stand (H53 (3)) in period 2 suggests a positive population response to some poorly understood local habitat feature not associated with stand age or disturbance type.
It is intriguing that activity abundance increased between sample periods for three species (A. cupreum, A. placidum, and S. americanus) associated with warm xeric habitats but decreased for two species (C. chamissonis and D. cognatus) associated with cooler conditions. Although the temporal trends for these five species are consistent with responses to climatic warming and drying in the Rocky Mountain foothills (Hansen and Phillips Reference Hansen and Phillips2015), availability of only two data points precludes asserting a definitive cause–effect relationship between changing climate and beetle activity.
Niemelä et al. (Reference Niemelä, Langor and Spence1993) designated Amara, Bembidion, Harpalus, and Notiophilus as open-habitat specialists based on pooled data for about three to nine species in each genus. In the present study, species representing the first three of these genera were found mainly in open habitats during period 2; however, we determine likely habitat associations for only the six species that were captured in sufficient numbers for statistical tests: A. laevipennis, A. littoralis, B. grapii, H. fulvilabris, H. megacephalus, and H. solitaris. For all of these species, an open-habitat designation was statistically significant in period 2. Nonetheless, the strength of association with open habitats varied among these species, and data for Amara and Harpalus show that other species were also trapped in closed forests. Therefore, some open-habitat species exist in at least patchy populations in some closed stands. Such populations might be either retained in low numbers after the stand-initiating disturbance (Work et al. Reference Work, Jacobs, Spence and Volney2010) or initiated and maintained in closed forests through colonisation of forest gaps after blowdowns or other local events. The relative importance of these two possibilities remains to be discovered but is important for understanding the dynamics of carabid assemblages on forested landscapes.
Catches for the three species of Notiophilus trapped in period 2 were insufficient for statistical analysis; however, 68% of captured Notiophilus were from stand H53 (2), with nearly half from one trap. Specimens of N. directus and N. semistriatus were captured also in H33 stands, and some N. borealis were trapped in H42 and F58 stands. These species therefore are not properly considered as open-habitat species in the study area, as suggested by Niemelä et al. (Reference Niemelä, Langor and Spence1993). Most importantly, however, the distributions of these three Notiophilus species in the study area clearly are affected more by some unmeasured habitat features than by stand age and disturbance type, and more work is required to establish their habitat affinities in Cordilleran forests.
Synuchus impunctatus and P. adstrictus were most common in open harvested stands in period 1 (Niemelä et al. Reference Niemelä, Langor and Spence1993) and period 2. Nonetheless, individuals of P. adstrictus were also captured frequently in older fire-origin stands (F58 and F110) in period 2, suggesting that patterns of habitat use for this species are related to both age (canopy cover) and disturbance type. Although Niemelä et al. (Reference Niemelä, Langor and Spence1993) offered no inference about habitat association for Pterostichus pensylvanicus LeConte, based on the 20 specimens captured during period 1 in the present study, all specimens were from open stands, which is consistent with our findings from period 2.
Three species (C. advena, L. ferruginous, and S. marginatus) that had been classified as mature-forest specialists from samples south of Hinton in period 1 (Niemelä et al. Reference Niemelä, Langor and Spence1993) were captured frequently in the older regenerating stands with closed canopy that had become available for study during period 2. These data from the longer chronosequence of period 2 show that these species have broad affinity for closed-canopy forests, irrespective of age. Based on inferences from period 1 data (Niemelä et al. Reference Niemelä, Langor and Spence1993), we expected that mature-forest specialists would be more or less restricted to mature pyrogenic stands (i.e., F110); however, during period 2, no species exhibited this pattern. Although C. advena and S. haematopus were captured disproportionately to sampling effort in old pyrogenic stands, populations of these species were common in other stands. In fact, a few species (e.g., C. ingratus, L. ferruginosus, and S. marginatus) were captured significantly more often than predicted from sampling effort in harvest-origin stands, regardless of age. These data from period 2 suggest that 45–50 years are sufficient for re-establishment of viable populations of the mature-forest carabid species in regenerating stands after either harvest or fire and that there is no justification to classify any of these species as dependent on old forest.
In summary, our study results suggest four general conclusions about the study of carabid species responses in a conservation context. Firstly, pooling data, even across congeneric species thought to be ecologically similar, can result in misleading conclusions about habitat affinity and effective management of faunal change: essentially, efforts to conserve arthropod diversity depend on work at the species level (Hillebrand et al. Reference Hillebrand, Blasius, Borer, Chase, Downing and Eriksson2018), just as they do for other higher taxa. Secondly, accurate understanding of species–habitat relationships depends on data from sufficiently long chronosequences: populations of species assessed to be mature-forest specialists based on data from the period 1 chronosequence were found in all stages of forest developing after canopy closure across the longer chronosequence of period 2. Thirdly, human perceptions of habitat affinity may vary depending on the geographic scope of the data and, in particular, the ecosites included in the study (Langor et al. Reference Langor, Pohl and Hammond2006): the restriction of our period 2 study to a smaller area south of Hinton provided a clearer and more consistent picture of faunal responses to disturbance than did the work in period 1, which covered a larger and more ecologically diverse area. Finally, this study underscores that maintaining habitat diversity on the landscape supports biological diversity, largely because of the variation among species in population performance across a range of habitats.
Implications for conservation
These days, Canadian forest managers typically attempt to conserve species sensitive to large-scale forest harvesting by emulating aspects of natural disturbance (Spence Reference Spence2001; Burton et al. Reference Burton, Messier, Smith and Adamowicz2003), but this does not replace all aspects of natural stand origin processes such as fire (Gandhi et al. Reference Gandhi, Spence, Langor, Morgantini and Cryer2004). Does such exact correspondence with natural processes matter? Although our study demonstrates that carabid assemblages in Cordilleran lodgepole pine forests of west–central Alberta recover significantly by approximately 50 years after clear-cut harvest, assemblages in the oldest postharvest stands remain somewhat distinct, in terms of proportional representation of species, from those found in burned stands of comparable age. Nonetheless, no evidence indicates that any species loss has resulted from anthropogenic disturbance or that forestry will cause profound changes to overall species composition compared to the prevailing natural disturbance regime. Of forest species common in period 1 in this study, only C. chamissonis was absent from most postdisturbance stands in period 2. However, this finding cannot be attributed to forestry because the species was much less common overall in period 2 than in period 1. Several other cold-adapted species seem to have disappeared or become much less common on the study landscape, and several xerophilic species were caught more commonly in period 2 than in period 1. It therefore appears that population recovery of most carabid species present on the preforestry landscape is not compromised, given sufficient time, after either wildfire or harvest disturbance. This is good news with respect to responsible forestry. Nonetheless, some faunal change in the study area was consistent with probable effects of the warming and drying climate that is occurring on the eastern slopes of the Rocky Mountains. More work is required to investigate the possible causes of these reductions and, in particular, the extent to which factors in addition to forest harvesting may drive landscape-level reductions in populations of particular invertebrate species.
Supplementary material
To view supplementary material for this article, please visit https://doi.org/10.4039/tce.2022.28.
Acknowledgements
We thank Hinton Wood Products (West Fraser) for cooperation and information essential for this work, C. LaRocca and C. Enero for field assistance, and J.A.C. Bergeron for help in identifying the beetles. Financial support for the study was provided by Natural Resources Canada, Canadian Forest Service, Alberta Innovates through a grant to F.H., and by NSERC through a Discovery Grant to J.R.S.