To become proficient speakers of two languages, bilinguals need to master two lexicons as well as two grammars and phonologies. Mastering the lexicon would be relatively easy if it were only a matter of learning different word forms for the same meanings, but languages may differ in the number of lexical distinctions they draw in a domain, in the prototype or range for words that are roughly comparable, and even in the features of the domain that are encoded (see Malt & Majid, Reference Malt and Majid2013, for review). Bilinguals must therefore learn meanings as well as word forms for both languages.
The two lexicons are linked, and among other consequences of this linkage (see, e.g., Kroll, Dussias, Bogulski & Valdes Kroff, 2012), the bilingual patterns of word choice used to convey ideas may differ from those of monolinguals. For sequential bilinguals, first language (L1) word knowledge influences the way that words of the second language (L2) are used (e.g., Jarvis, Reference Jarvis2000; Jiang, Reference Jiang2000, Reference Jiang2002; Malt & Sloman, Reference Malt and Sloman2003; Zinszer, Malt, Ameel & Li, 2014). Extensive use of the L2 can also affect how L1 words are used (e.g., Ervin, Reference Ervin1961; Caskey-Sirmons & Hickerson, Reference Caskey-Sirmons and Hickerson1977; Jarvis, Reference Jarvis and Cook2003; Jarvis & Pavlenko, Reference Jarvis and Pavlenko2008; Malt, Li, Pavlenko, Zhu & Ameel, Reference Malt, Li, Pavlenko, Zhu and Ameel2015; Pavlenko, Reference Pavlenko, Schmid, Köpke, Kejser and Weilemar2004, Reference Pavlenko and Pavlenko2009; Pavlenko & Malt, Reference Pavlenko and Malt2011; Schmid & Köpke, Reference Schmid, Köpke and Pavlenko2009; see also Dong, Gui & MacWhinney, Reference Dong, Gui and MacWhinney2005). For bilinguals growing up with two languages, the two may influence each other simultaneously (Ameel, Storms, Malt & Sloman, Reference Ameel, Storms, Malt and Sloman2005; Ameel, Malt, Storms & Van Assche, Reference Ameel, Malt, Storms and van Assche2009; Storms, Ameel & Malt, Reference Storms, Ameel and Malt2015). The goal of the current work is to better understand how this cross-language influence in word choice arises.
How does cross-language lexical influence arise?
Most researchers have assumed that bilingual word choices differ from monolingual ones because elements of meaning associated with word forms of one language are influenced by those associated with word forms in the other (e.g., Ameel et al., Reference Ameel, Storms, Malt and Sloman2005; Jarvis, Reference Jarvis and Cook2003; Jarvis & Pavlenko, Reference Jarvis and Pavlenko2008; Malt et al., Reference Malt, Li, Pavlenko, Zhu and Ameel2015; Pavlenko, Reference Pavlenko, Schmid, Köpke, Kejser and Weilemar2004, Reference Pavlenko and Pavlenko2009; Pavlenko & Malt, Reference Pavlenko and Malt2011; see also Dong et al., Reference Dong, Gui and MacWhinney2005). Consider drinking vessels. English monolinguals generally restrict glass to tall objects with straight sides made of glass, whereas they use cup for diverse objects including tea cups, paper cups, plastic cups, and children's sippy cups. For Russian monolinguals, chashka covers tea and coffee cups but not the other English cups; these are labeled stakan along with English glasses. Due to cross-language influence, a Russian–English bilingual may treat chashka as if it is more equivalent to cup, using it for the wider range of objects, and narrow their use of stakan to resemble glass (Pavlenko & Malt, Reference Pavlenko and Malt2011). This shift can be explained by the diverse features of cup becoming more strongly associated with chashka, and the restricted features of glass becoming more strongly associated with stakan.
An alternative account, however, attributes the bilingual patterns to on-line processing. According to this account, a bilingual might be aware of the subtle differences between meanings and have monolingual-like meaning representations, but still not perform like monolinguals (De Groot, Reference De Groot, Filipovic and Putz2014). One contributor to on-line processing differences between speaker groups is the retrievability of word forms from memory. Bilinguals must inevitably use each language less often than a monolingual would. As a result, some words, especially lower frequency ones, may have a lower resting activation level and be more difficult to produce (MacWhinney, Reference MacWhinney, Ellis and Robinson2008; Pyers, Gollan & Emmorey, 2009). Furthermore, retrievability of words in a less-used language rapidly declines, even if it is the native language (e.g., Baus, Costa & Carreiras, Reference Baus, Costa and Carreiras2013; Linck, Kroll & Sunderman, Reference Linck, Kroll and Sunderman2009; Paradis, Reference Paradis, Köpke, Schmid, Keijker and Dostert2007; Stolberg & Münch, Reference Stolberg and Münch2010). According to this explanation, bilinguals may over-use certain words (relative to monolinguals) as a result of temporary failure to retrieve other, monolingual-favored words.
A second potential contributor to processing differences between groups is the cross-language activation of word forms that bilinguals experience. Under some production theories (e.g., Levelt, Roelofs & Meyers, 1999), in order to be selected for production, a word form must not only pass an activation threshold but also out-compete other highly activated potential candidates. The connections between word forms of the two languages could alter activation levels of words, sometimes causing the most-activated one to differ from the one that is most activated for a monolingual (De Groot, Reference De Groot, Filipovic and Putz2014). For instance, if chashka is linked to cup and stakan to glass then, for an object that would be cup in English but stakan in Russian for monolinguals, the bilingual's representation of chashka could receive extra activation through cup, and the bilingual might produce chashka instead of stakan.
The need for further data
Although a processing account is plausible on the surface, there are several reasons to question it, at least as the sole explanation. Generally speaking, it seems unlikely that bilinguals are fully aware of and have mastered the subtle differences in word meanings. Bilinguals typically express surprise when the non-correspondences are pointed out, and even bilingualism researchers (e.g., Kroll & Stewart, Reference Kroll and Stewart1994; Miller & Kroll, Reference Miller and Kroll2002) often treat concrete nouns as simple translation equivalents. Also, if retrieval difficulty or cross-activation causes occasional word choices that speakers realize are non-preferred, one might expect to see them primarily under time-pressured circumstances and not in laboratory tasks without time pressure. Even for monolinguals, many candidate words may be activated at each step of preparing an utterance (Levelt et al., Reference Levelt, Roelofs and Meyer1999), but self-monitoring is largely effective and whole-word slips of the tongue are rare.
Some experimental data also speaks against a pure processing account. Bilinguals sometimes produce lower frequency words in their L2 (Malt & Sloman, 2002) or L1 (Pavlenko & Malt, Reference Pavlenko and Malt2011; Malt et al., Reference Malt, Li, Pavlenko, Zhu and Ameel2015) but do not use them for a native-like range of objects. Some higher-frequency words are also used in non-monolingual-like ways. This observation suggests that retrievability does not fully account for where bilinguals differ from monolinguals in word choice. Also, in a study examining both L1 and L2 naming by L2-immersed bilinguals, Malt et al. (Reference Malt, Li, Pavlenko, Zhu and Ameel2015) found a domain difference despite similar word frequencies within the two domains. For one stimulus domain, Mandarin–English bilinguals matched monolingual English speakers to a greater extent with greater English use but showed no greater divergence from monolingual Mandarin speakers. For the other, bilinguals showed no greater progress in matching English monolinguals as a function of greater English use, but they showed less agreement with monolingual Mandarin speakers. Malt et al. (Reference Malt, Li, Pavlenko, Zhu and Ameel2015) suggested that the L2 naming pattern in the second domain was particularly challenging, causing bilinguals to struggle without progress in L2 while at the same time becoming less certain about the L1 pattern. This type of domain effect does not follow readily from a cross-activation explanation, where more native-like L2 word use should yield a greater impact on L1 and absence of progress in L2 would leave original L1 patterns unchanged.
Despite these arguments against a pure processing account, the account is not fleshed out in enough detail to make exact predictions about which word would be produced in any particular context. In the absence of a fully implemented model, one can still speculate that somehow, the full range of observed effects might be obtained via one of the possible mechanisms or the two of them combined. Converging evidence about the source(s) of the effects is desirable.
The current study
We examined name choices for a sample of L2-immersed Mandarin–English bilinguals similar to Malt et al.’s (2015) sample, for the same two stimulus sets. As in the Malt et al. (Reference Malt, Li, Pavlenko, Zhu and Ameel2015) study, bilinguals provided choices in both L1 Mandarin and L2 English, in sessions separated in time. Critically, however, instead of asking participants to produce a name for each object in L1 and L2, we provided name options based on those given by Malt et al.’s monolinguals. Their task, for both L1 and L2, was to select among the names provided. For each object, one option was always the name most commonly given by monolinguals. Functionally monolingual English and Mandarin speakers performed the same task for comparison.
This task directly addresses the memory retrieval contribution to on-line processing. By presenting the name options, the need to retrieve words from memory is eliminated. If bilinguals only shift their pattern of word use in L1 and/or L2 because of trouble retrieving some words, then deviations from the monolingual choices should disappear in this task.
The task also addresses the cross-language contribution to processing because the words of the target language are all presented overtly and repeatedly across trials and so should all have a high level of activation. The high levels of activation should make all presented words potential candidates for selection. It is still true that one word must win out over the others to be selected (whether through competition or a race to reach an activation threshold, e.g., Oppenheim, Dell & Schwartz, Reference Oppenheim, Dell and Schwartz2010), and we cannot rule out the possibility that some words may gain some activation from words of the other language. However, the activation level of presented words in the language of the test session should be considerably higher than those of non-presented words of the non-target language, and any contribution from that source should be minimal. Also, because the task is without time pressure and participants can change an answer at any time, any initial ‘slips of the mouse’ that participants make due to cross-language activation should be readily corrected if they recognize the slip as a non-preferred choice.
In fact, if the monolingual-like meanings are fully known in both languages and correctly associated with word forms then, given the non-equivalences across the two languages, words of one language will often have associations to multiple words of the other. Consider how Russian stakan is linked to both some English glass and cup items. Consider also that the common Mandarin container term ping is distributed across seven different English names and another, Mandarin he, is distributed across nine (see Malt et al.’s, 2015, Tables 1a–1b and 2a–2b; see also Ameel et al., Reference Ameel, Storms, Malt and Sloman2005, for Dutch and French). Direct association of a word of one language to a single incorrect choice of the other is only likely when the correct meanings for the two languages are not known. Given the multiple cross-linkages necessary for monolingual-like knowledge, and the high activation level of the explicitly presented words in this task, it is not clear that non-target language activations could produce a reliable pattern of deviations for specific objects if bilinguals had the full, monolingual-like knowledge of both sets of meanings.
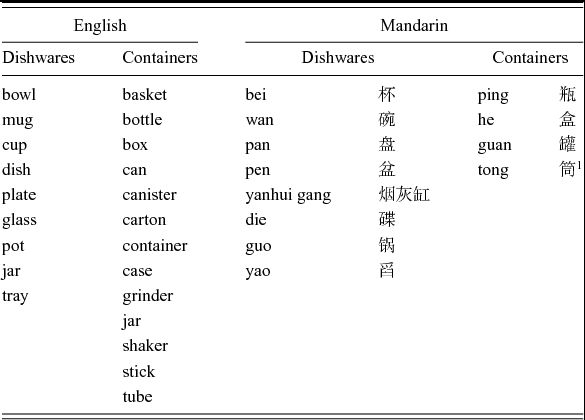
Dominant names in English and Mandarin for the two stimulus sets. (‘Dominant’ = the most frequently produced name for at least one object in the set.) For Mandarin, both Pinyin and characters are given.

In short, if bilinguals’ word choices diverge from monolinguals’ in free naming only because of memory retrieval problems and/or cross-language activation of word forms, then, in a forced choice task, those differences should disappear. If some or all of the divergences are due to differences in word meanings, then bilinguals should still not fully match monolinguals.
Method
Participants
Thirty-four Mandarin–English bilinguals, Lehigh University undergraduate and graduate students, were tested (mean age = 23, range 18–29; 24 females). All were native speakers of Mandarin from mainland China currently using English on a daily basis. They received $15 for participating. The mean age of immersion in English was 21 (s.d. 2.99; median: 22; range 15–27), as derived from responses to the language history questionnaire described below. The mean length of immersion was 1.9 years (s.d. 1.4; range 0.5–6 years). The mean self-rated proficiency (averaging across estimates for reading, writing, speaking, and listening) was 4.83 on a 7-point scale for English and 6.93 for Mandarin. Participants did have English instruction in China. However, classroom instruction provides little chance to observe real-world word-referent pairings by native speakers, and Malt & Sloman's (2003) non-native speakers (about ¼ of whom were Chinese) showed deviations from native-English speaker word use for many years after immersion.
The comparison groups were functionally monolingual speakers of English in the U.S. and of Mandarin in China. Some of the monolingual participants had some training in one or more other languages but none reported using another language on a regular basis. To further ensure that participants were functionally monolingual, we examined all respondents’ average self-rated proficiency in other languages and eliminated any whose mean for another language was higher than 4 (‘somewhat proficient’). Twenty-seven English speakers were tested and none were eliminated on this basis. Thirteen Mandarin speakers out of 35 tested were eliminated, for a final sample of 22 (with mean self-rated proficiency in a language other than Mandarin = 3.07). The English speakers were Lehigh University undergraduates (mean age = 20, s.d. = 0.87, range 19–22) participating for course credit. The Mandarin speakers were residents of mainland China recruited via email (mean age = 25, s.d. = 5.8, range 21–48). They were family members and acquaintances of colleagues having ties to China, along with others recruited by those participants, and received no compensation. Although the Mandarin monolingual group was somewhat more diverse in age and occupation than the other groups, Malt et al. (Reference Malt, Li, Pavlenko, Zhu and Ameel2015) found that an even more diverse group of Mandarin monolinguals produced highly consistent free naming responses to these stimuli.
Materials
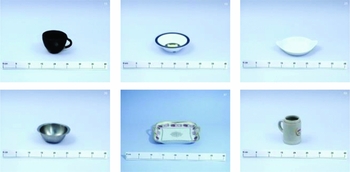
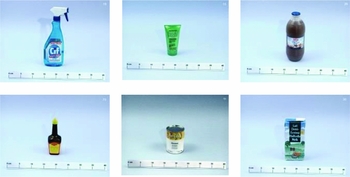
Stimuli were 67 pictures of objects for preparing and serving foods (the ‘dishwares’ set) and 73 pictures of objects for holding and dispensing household products such as health and beauty aids, cleaners, and foods (the ‘containers’ set), developed by Ameel et al. (Reference Ameel, Storms, Malt and Sloman2005) and used by Malt et al. (Reference Malt, Li, Pavlenko, Zhu and Ameel2015). Figures 1 and 2 provide sample images from the two sets; the full sets are available at http://fac.ppw.kuleuven.be/lep/concat/former_members/eef/?stimuli. See Ameel et al. (Reference Ameel, Storms, Malt and Sloman2005) for details of stimulus development.
Sample pictures from the dishwares set. (Participants saw the pictures in color.) (Reprinted from Malt et al. (Reference Malt, Li, Pavlenko, Zhu and Ameel2015). Copyright [2015] by Elsevier.

Sample pictures from the containers set. (Participants saw the pictures in color.) (Reprinted from Malt et al. (Reference Malt, Li, Pavlenko, Zhu and Ameel2015). Copyright [2015] by Elsevier.

The name options offered for the forced choice decision were based on the names produced in the Malt et al. (Reference Malt, Li, Pavlenko, Zhu and Ameel2015) free naming study. All words that were the most frequently produced (‘dominant’) response to at least one object in a stimulus set were included, as given in Table 1. In the free naming study, Mandarin responses were typed in Pinyin for ease of testing bilinguals on American computers. Because the forced choice task required only a mouse click to select a response, a native Mandarin-speaking research assistant evaluated the free naming Pinyin responses and selected corresponding characters (see Table 1) to present.
For English, each object of a stimulus set was accompanied by the question “What is this object? It's a. . .”, followed by the full set of names for that stimulus set. Name order was randomized for each object. Next to each name was a radio button that could be clicked to select it. Below each name choice question was the question “What is your confidence in your choice?” with a 7-point Likert scale where 1, 4, and 7 were labeled “very low”, “medium” and “high”, respectively. Each scale point had a radio button that could be clicked to select it. There were two fixed orders of photos for each stimulus set. For Mandarin name selection, the same materials were implemented with translations provided by native Mandarin-speaking research assistants.
The study task was hosted on-line on SurveyMonkey (http://www.surveymonkey.com) for the bilingual and English monolingual participants. It was hosted on Qualtrics (http://www.qualtrics.com) for Mandarin monolingual participants, whose data were collected slightly later, after the host institution changed its on-line survey platform. The Qualtrics presentation closely replicated the SurveyMonkey format.
Introductory text informed participants (in either English or Mandarin, depending on the test session) that the task was designed to find out how people talk about objects, and that they would see a series of common household objects and give a name for each one. Participants then entered the date, their ID code, and date of birth.
For bilinguals in their English session, the consent form and ID code form were followed by the language history questionnaire (in English) used by Malt et al. (Reference Malt, Li, Pavlenko, Zhu and Ameel2015). The first questions asked for standard demographic information such as age, gender, where the participant grew up, age of exposure to English, years of formal instruction, age of immersion, self-ratings of English and Mandarin proficiency, and TOEFL score. These were followed by questions aimed at tapping into the extent to which the participant made use of English vs. Mandarin in daily life (e.g., the relative amount of time spent using English vs. Chinese in various contexts such as home, school, and on the computer). The full questionnaire was included for parallelism with Malt et al. (Reference Malt, Li, Pavlenko, Zhu and Ameel2015). We checked where participants had grown up to ensure that they spoke standard Mandarin.
Monolinguals were given a short version of the questionnaire with demographic questions including those about where they lived and experience with and proficiency in other languages. The items that addressed experience and proficiency were used to ensure that participants in the monolingual samples were functionally monolingual. The questions were in English for American monolinguals and Mandarin for Chinese monolinguals. Region was checked to ensure that Chinese participants spoke standard Mandarin. The language history questions were followed by the forced choice name selection task as described above.
Procedure
Monolingual speakers of English and of Mandarin each participated in one session in which they completed the language history questions and the forced choice name selection task in their native language. English speakers participated using computers in a psychology lab. Mandarin speakers participated where they had access to a computer with an internet connection.
Bilinguals participated in two sessions in the lab setting. In the first, conducted in English by a native speaker, they established an anonymous participant code to link their responses across tasks and then filled out the full language history questionnaire (in English). They then completed the English forced choice task (with containers first and dishwares second, alternating stimulus order across participants). This task provides the key dependent measure of L2 naming patterns.
Last, a verbal fluency task was administered to provide a performance measure of the extent to which each bilingual tilted toward English usage in daily life (e.g., Linck et al., Reference Linck, Kroll and Sunderman2009; Schmid, Reference Schmid2011). Verbal fluency scores measure global language activation, not just knowledge of word forms. Linck et al. (Reference Linck, Kroll and Sunderman2009) used this task with native English-speaking college students who had taken intermediate-level Spanish classes. Students studying abroad in Spain produced fewer L1 English words to verbal fluency prompts than non-immersed students of similar proficiency did, demonstrating the task's relevance as a measure of current language activation. Our participants listed all the exemplars they could to the prompts food and clothing, in 60 seconds each. Malt et al. (Reference Malt, Li, Pavlenko, Zhu and Ameel2015) had found that verbal fluency scores for clothing correlated significantly with more self-report and performance measures of the extent of English usage than any other measure they took and used it to identify extent of English usage. On that basis, we used the clothing measure here, with food first as a practice trial. Responses were spoken out loud. They were recorded on paper by the experimenter and also digitally to review for any responses the experimenter missed.
The second session for bilinguals was conducted in Mandarin by a native speaker and took place at least one week after the first. (Mandarin was always tested second because, although it is unlikely for memories of responses to 140 pictures to be used as the basis for responses in a different language a week or more later, it is even less likely for memories in the L2 to help determine choices in the native language than vice versa.) The forced choice name selection and verbal fluency tasks were completed as in Session 1. Responses were in Mandarin.
Results and discussion
Preliminary processing of data
Summary measures were calculated from the language history questions. For bilinguals, written records of verbal fluency responses were reviewed against the audio recordings to ensure that each record was complete. The total number of words produced in each language was then determined for each bilingual. Following Malt et al. (Reference Malt, Li, Pavlenko, Zhu and Ameel2015), a score of English minus Mandarin was created as the indicator of the extent to which the participant tilts toward English language usage. To create groups as equivalent to those of Malt et al. as possible, we also followed Malt et al. (Reference Malt, Li, Pavlenko, Zhu and Ameel2015) in dividing participants into Lower English Usage (n = 22) and Higher English Usage (n = 12) using a score of −4 or above as the cutoff for higher usage. (In Malt et al.’s sample, a natural break in the distribution occurred here.) Lower English Usage participants had a mean score of −9 (s.d. = 3.32; range −15 to −5), and Higher English Usage participants, of −1.92 (s.d. = 1.73; range −4 to 1). The groups differed significantly, t(29)= −6.81, p < .001. The Lower English Usage group is closely comparable to Malt et al.’s (which had a mean of −9.0; range −16 to −5). The Higher English Usage group was limited by participant availability and tilts somewhat less strongly toward English than Malt et al.’s Higher English Usage group, which had a mean of 0.15 (range −4 to +8). Mean self-rated English proficiency for the Lower English Usage group was 4.78 and, for the Higher, 5.0.
The frequency of each name choice for each object was tabulated and converted to a percentage, producing a name frequency distribution for each object. These values were calculated separately for English and Mandarin monolinguals and for Higher and Lower English Usage bilinguals for each language.
Mean confidence ratings were also calculated for each group, and for bilinguals, for each language.
Monolingual naming patterns
We first compare monolingual English and Mandarin results to see if they replicate free naming results, and to provide a baseline against which we can compare bilingual forced choices.
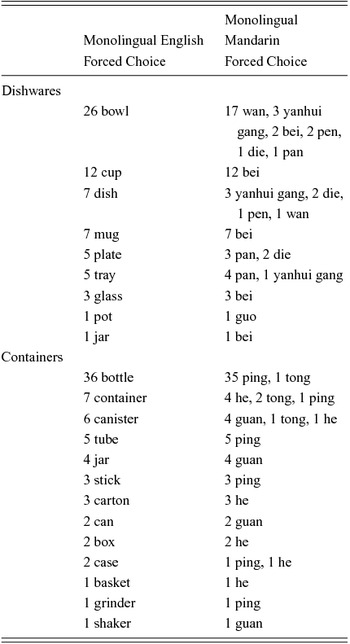
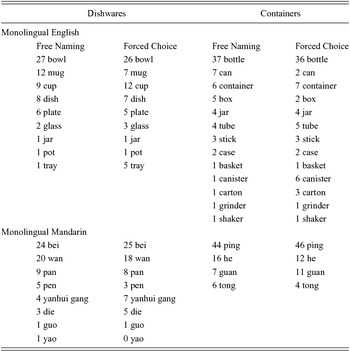
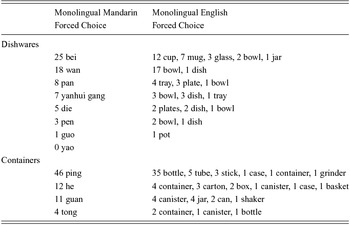
Table 2 shows the mapping of Mandarin to objects grouped by their English dominant name. (See Appendix Table A1 for the mappings of English to the objects grouped by Mandarin.) These tables establish that in forced choice, as in free naming, the lexical categories of the two languages do not map cleanly onto each other. Each language has one word for the dishwares and one for the containers that encompasses a large portion of the objects in the set, but the objects covered by each are spread across multiple names in the other language. Most of the other terms, likewise, do not have a direct correspondence between languages. These discrepancies are what create the challenge for bilinguals.
Forced choice distribution of monolingual names across the 67 pictures of the dishwares set and 73 pictures of the containers set, grouped by English name. (Numbers indicate how many objects have the listed name as dominant.)

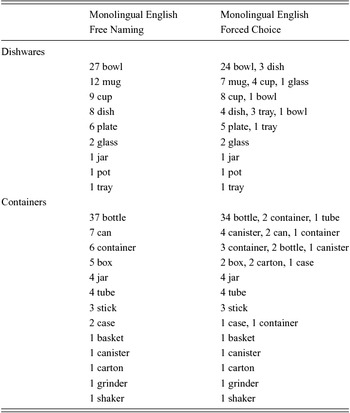
The distribution of names to objects in forced choice does not completely mirror that in free naming. Table 3 shows that the number of objects for which each name was dominant differed somewhat between tasks. Some discrepancies can be expected based on noise in the data. An object on the border between cup and mug for English, for instance, might produce 55% cup in one sample and 55% mug in a different sample, so that a different name is counted as dominant. Many of the shifts can be given this explanation. In free naming, the mean agreement on the dominant name across all objects was 68% for dishwares and 58% for containers in English and 90% and 91%, respectively, for Mandarin (Malt et al., Reference Malt, Li, Pavlenko, Zhu and Ameel2015). However, for the objects that shifted dominant name between the two tasks, the English free naming agreement was only 52% and 45%, respectively, and for Mandarin, 66% and 85%, indicating that monolinguals agreed less on names for objects that shifted.
Dominant name use totals in monolingual English and Mandarin forced choice vs. free naming for the 67 pictures of the dishwares set and the 73 pictures of the containers set. (Numbers indicate how many objects have the listed name as dominant.)

Table 3 also shows that for each language and stimulus set, a few words in particular seem to attract more or fewer uses in forced choice than in free naming. Several of the increases consist of words that were little used in free naming picking up more use in forced choice (tray and canister in English), suggesting that low frequency words were made more available by their explicit presentation. (Appendix Tables A2 and A3 show where the shifts took place.) In this respect, the possibility that retrievability affects name choice is given some support. However, it remains to be seen whether differences between monolinguals and bilinguals are reduced or eliminated as a result.
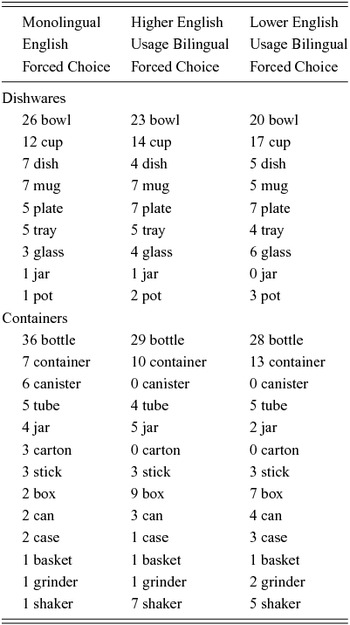
Dominant name use totals in monolingual and bilingual English forced choice for the 67 pictures of the dishwares set and 73 pictures of the containers set.

The other salient difference between monolingual responses in free naming vs. forced choice is the level of agreement on dominant names. For English speakers, the forced choice task modestly increased naming consistency (from an average of 68% to 72% agreement across items on dominant names for dishwares, t(132) = 0.93, n.s., and from 58% to 66% for containers; t(144) = 2.32, p < .02, both tests two-tailed). These increases can be attributed to limiting choices to dominant names because, in free naming, there were occasional miscellaneous labels (such as package, dispenser, Tupperware) or naming of contents instead of the object. For Mandarin speakers, however, the forced choice task substantially decreased naming consistency, bringing it from 90% in free naming for dishwares to 73%; t(132) = −5.25, p < .0001, and from 91% to 77% for containers; t(144) = −5.13, p < .0001 (both tests two-tailed). The decrease in consistency may reflect, in part, the greater prominence of alternative name choices provided by the forced choice presentation. With alternatives present, participants appear to consider and use names other than the most common choice viable – again, supporting the possibility that retrieval issues contribute to free naming choices for these stimulus sets.
But also contributing to reduced consistency of choices may be the fact that forced choice eliminates the possibility of using modifying words. In free naming, English speakers often produced the head noun embedded in other words, e.g., large white bottle, and Mandarin speakers often did likewise. Without modifiers available to modulate the interpretation of the head noun, Mandarin speakers may have been more likely to consider alternatives – just as an English speaker might prefer jug for an object over unmodified bottle despite free naming it as large white bottle. (Some English mug items in free naming shifting to higher-frequency cup in forced choice may reflect this phenomenon.) The shifts for Mandarin may be more pronounced than for English, because many of the nouns in Mandarin function as classifier words in combination with a substance word (e.g., Allan, Reference Allan1977; Craig, Reference Craig1986), providing conventional units of measure. These nouns may be less strongly linked to specific stimuli when read in isolation. For instance, bar in English bar of soap serves a similar classifier role, and while English speakers may produce bar of soap because this phrase is conventional, they may agree less if they are shown the same piece of soap and asked if it should be called a bar.
As noted in Footnote 1, the Chinese character we implemented in the forced choice options, to reflect the Pinyin response tong from containers free naming, may not have been the optimal choice. Consistent with this possibility is the observation that tong attracted 11% of forced choice selections, whereas it accounted for 21% of free naming responses. However, since the dishwares stimuli showed an even larger decrease in agreement level from free naming to forced choice than containers did, the choice of character to represent tong cannot be responsible for the overall decreased agreement. In fact, given the overall differences between free naming and forced choice, it is possible that tong’s reduced use in forced choice is not tied to character selection at all.
In short, the forced choice task replicates the finding of a complex mapping between the dishware and container terms of English and Mandarin. However, the specific pattern of choices by native, functionally monolingual speakers differs somewhat between free naming and forced choice. Thus, even monolinguals show shifts in name preferences as a function of task. The pattern produced in monolingual forced choice provides the baseline against which bilingual choices need to be evaluated. We now turn to that comparison.
Bilingual L2 English
To understand bilingual performance and its relation to monolingual name choices, we first examine the dominant name use totals and distribution of dominant names across objects and how they compare to past results from free naming. We then score performance at an individual level to allow a direct comparison of monolingual and bilingual groups. We report these analyses here for name selection in the L2, English, and subsequently in the L1, Mandarin.
L2 English: Word use frequencies
If the bilinguals have a full grasp of the English words and produce non-target free naming patterns only because of processing factors, their selection frequency in forced choice should match that of monolinguals. Table 4 shows how many objects in each stimulus set received each name choice for the bilingual groups in comparison to the English monolingual group.
For dishwares, the correspondence in selection frequency does seem improved compared to free naming (cf. Table 4a in Malt et al., Reference Malt, Li, Pavlenko, Zhu and Ameel2015). In free naming, cup was overused while mug was underused by bilinguals, and plate was overused while dish was underused – a pattern attenuated in forced choice. However, the correspondence, if anything, appears decreased for containers. Here, bilinguals distributed their choices across more of the dominant names in forced choice but did not necessarily do so in a more monolingual-like way.
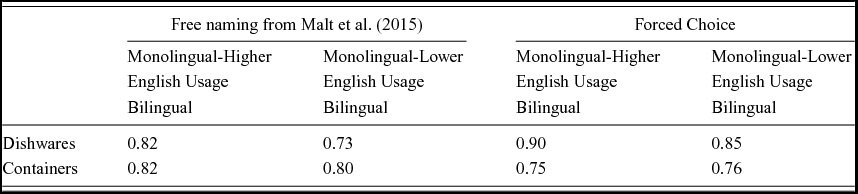
To statistically assess the correspondences in a way that takes into account the frequency with which each word is applied to each object, we correlated the entire object x name frequency matrices of the three groups and compared them to values for the free naming data of Malt et al. (Reference Malt, Li, Pavlenko, Zhu and Ameel2015). In free naming, the groups varied somewhat in the full set of names produced, yielding raw matrices differing in size. To create same-sized matrices for correlation, we kept the values for the dominant names (which are the name options for forced choice) and collapsed the frequencies of all others into a single category of ‘other’. This procedure slightly inflates correspondence among groups for free naming because some non-identical names count as ‘other’. Despite this, as Table 5 shows, the dishwares correspondence is higher in forced choice than free naming (z = −5.76 and −5.98 for monolinguals with Higher and Lower English Usage bilinguals, respectively, ps < .001).
Correlation of matrix of English name frequencies across objects for the monolingual group with each bilingual group.

However, the correlations decrease for containers (z = 4.15, p < .001 for monolinguals with Higher English Usage bilinguals and z = 2.23, p < .02 for monolinguals with Lower English Usage bilinguals), confirming that bilinguals did not necessarily use offered words in a monolingual-like way in this domain. Furthermore, the correlations for dishwares remain below ceiling in forced choice, especially for the Lower English Usage bilinguals. There remains a gap between monolinguals and bilinguals in frequency of word choices overall and in selection for specific objects.
L2 English: Patterns of naming
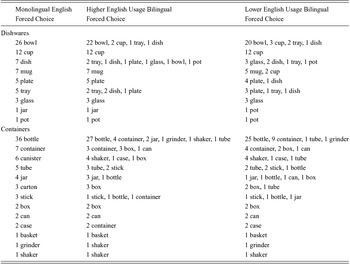
Table 4 shows that group differences for dishwares in Forced Choice are most notably due to both bilingual groups under-using bowl relative to monolinguals and over-using cup and plate. Table 4 also shows that for containers, bilinguals under-use bottle, canister, and carton, and over-use box, container, and shaker. These discrepancies are more pronounced for the Lower English Usage bilinguals, supporting the validity of grouping bilinguals based on verbal fluency scores. Table 6 reveals more about where discrepancies arise in the particular objects to which names are assigned. For instance, although bilinguals used dish at a rate more similar to monolinguals in forced choice, Table 6 shows that only one dish object for monolinguals is dish for bilinguals. The same is seen for other dishware terms, and for terms of the containers set as shown in Table 6.
Bilingual English forced choice distribution of names across the 67 pictures of the dishwares set and 73 pictures of the containers set, grouped by monolingual English name. (Numbers indicate how many objects have the listed name as dominant.)

The tables (and matrix correlations) reflect group preferences in name selection, but they do not provide a measure of performance at an individual level nor allow us to directly compare monolingual to bilingual performance within the forced choice task. To create an individual-level measure for forced choice, we followed Malt and Sloman (Reference Malt and Sloman2003) and Malt et al. (Reference Malt, Li, Pavlenko, Zhu and Ameel2015) in crediting each bilingual for the name he or she selected for each object relative to the proportion of monolingual English speakers who chose that name. For instance, if a bilingual selected plate as the name for an object and 75% of English monolinguals had selected plate for it, the bilingual received a score of .75. If the bilingual chose bowl and 25% of monolinguals had selected bowl, the bilingual received a score of .25, and so on. A 0 was assigned for a selection not made by any monolingual for that object. An individual's scores across all the objects of a stimulus set were averaged to create an overall score for that person for the set, with higher scores reflecting more monolingual-like performance. For comparison, each monolingual English speaker was scored against the monolingual group in the same way.
Table 7 shows that bilingual scores were lower than monolinguals’ for both stimulus sets, and Lower English Usage scores were lower than Higher English Usage scores for both. An ANOVA with the three speaker groups as a between-subjects factor and stimulus set as a within-groups factor found a main effect of stimulus set, F(1,54) = 217.09, ηp 2= .801, a main effect of speaker group, F(2, 54) = 57.93 ηp 2= .682, and an interaction of speaker group with stimulus set, F(2, 54) = 14.25, ηp 2= .345, all ps < .001 or lower. The interaction reflects the fact that the difference between monolinguals and bilinguals is larger for containers than for dishwares. Post hoc comparisons (LSD) confirmed that each bilingual group differs significantly from the monolinguals, p < .001 for both, and the two bilingual groups differ significantly from each other, p < .005. Each stimulus set separately also shows a main effect of speaker group (for dishwares, F(2, 54) = 30.41 and for containers, F(2,54) = 51.13, ps < .001) with significant differences between the two bilingual groups and between monolinguals and each bilingual group (all ps < .002 or better except the comparison of Lower and Higher English Usage bilinguals for containers, where p = .05).
Mean agreement scores of individual monolinguals and bilinguals to the monolingual English group for forced choice. Higher values indicate higher agreement.

Critically, these outcomes confirm that on an individual level, bilinguals are making L2 name selections in forced choice that diverge from those of monolinguals. They do so for both stimulus sets. In addition, the absolute difference between monolinguals and the bilingual groups is actually larger for containers in forced choice than it was in free naming.
The effect of bilinguals’ extent of English usage is also larger here than in free naming. In free naming, Higher English Usage bilinguals matched monolinguals better for dishwares than Lower English Usage bilinguals did, but the difference did not exist for containers. In forced choice, the difference is present for both stimulus sets (and despite the fact that the two bilingual groups are closer together on the relative verbal fluency measure). Even without the need to retrieve word forms from memory, and with all word options at a high level of activation, the bilingual groups differ in their ability to make target-like word choices as a function of their degree of English usage.
L2 English: Confidence
Confidence ratings were consistent with naming scores. Mean confidence was highest for monolinguals (5.99 for dishwares, 5.52 for containers), next highest for Higher English Usage bilinguals (5.3 and 4.2, respectively), and lowest for Lower English Usage bilinguals (4.8 and 3.4, respectively), with dishwares higher than containers. There was a main effect of stimulus set, F(1,54) = 117.45, ηp 2= .685, a main effect of speaker group, F(2, 54) = 21.62, ηp 2= .445, and an interaction of speaker with stimulus set, F(2, 55) = 12.43, ηp 2= .315, all ps < .001 or less. LSD comparisons for each stimulus set showed that all groups differed significantly from each other at p < .02 or less except for the two bilingual groups for dishwares, p > .10.
L2 English: Summary of results
English name choices for common household objects show some shifts for Mandarin–English bilinguals when name options are presented in a forced choice format, compared to in free naming, as they did for English monolingual speakers. However, discrepancies from the monolinguals remain. Together, these outcomes suggest that (a) there is some influence of processing factors on name choice, but (b) an underlying difference between native and L2 speakers exists in the understanding of the word uses as well.
Bilingual L1 Mandarin
We now report parallel analyses for L1 Mandarin performance.
L1 Mandarin: Word use frequencies
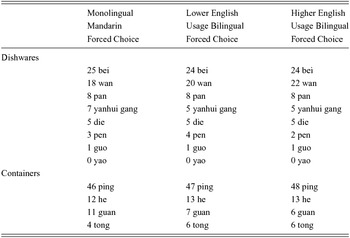
If the bilinguals maintain a monolingual-like grasp of the Mandarin words and diverge in free naming only because of processing factors, their selection frequency in forced choice should match monolinguals’. Table 8 shows how many objects in each stimulus set received each name choice from bilinguals and monolinguals. The correspondence appears to be close, and slightly closer than in Malt et al. (Reference Malt, Li, Pavlenko, Zhu and Ameel2015)’s Tables 6a and 6c for free naming.
Dominant name use totals in monolingual and bilingual Mandarin forced choice for the 67 pictures of the dishwares set and 73 pictures of the containers set.

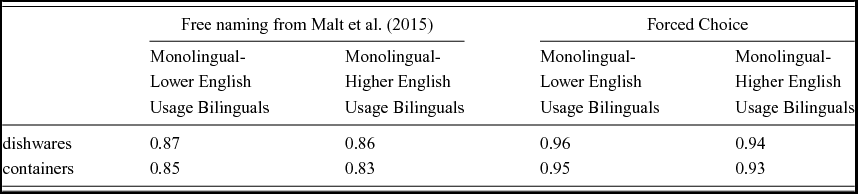
As for L2 English, we quantified the correspondence taking into account the frequency with which names were applied to individual objects by correlating each bilingual object x name matrix with the monolingual matrix. For comparison we used matrices for free naming representing the same dominant names plus an ‘other’ category. Correlations were significantly higher between monolinguals and bilinguals in forced choice compared to free naming, shown in Table 9 (for dishwares, z = −10.61 and −7.7 for Lower and Higher English Usage bilinguals, respectively, and for containers, z = −7.74 and −6.33, all ps < .001). Thus, the forced choice procedure does reduce differences between monolinguals and bilinguals for both stimulus sets. (However, some of the reduction may be due to monolinguals behaving more like bilinguals in forced choice – that is, dispersing their choices compared to free naming – an issue to which we will return later.) Notably, the correlations of bilinguals with monolinguals, although high, remain slightly below ceiling. The individual level analysis below can evaluate whether this reflects only noise in the data or a meaningful difference between groups.
Correlation of matrix of Mandarin name frequencies across objects for each bilingual group with the monolingual group.

L1 Mandarin: Patterns of naming
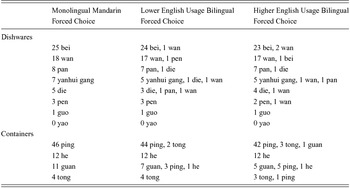
Table 8 suggested few differences in overall frequency of word use for dishwares, although there is slightly more use of tong and less of guan by bilinguals than monolinguals for containers. However, Table 10 reveals, as for L2 English, that even when names are used with similar frequencies, they are not always dominant for the same objects.
Bilingual Mandarin forced choice distribution of dominant names across the 67 pictures of the dishwares set and 73 pictures of the containers set, grouped by monolingual Mandarin name.

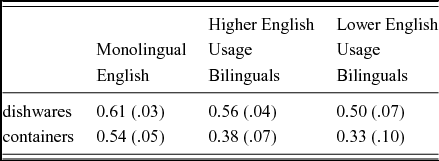
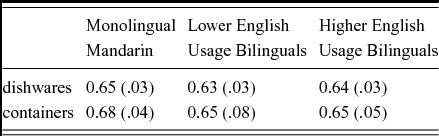
Parallel to the L2 analyses, we assessed the possibility of group differences by scoring each individual of each bilingual group against the monolingual group standard, crediting the bilingual's selected name for each object relative to its monolingual group frequency. Again, for comparison, we scored each monolingual's choices in the same way. The mean score for each group is given in Table 11.
Mean agreement scores of individual monolinguals and bilinguals to the monolingual Mandarin group. Higher values indicate higher agreement.

The table shows that bilinguals scored below monolinguals for both stimulus sets, although the two bilingual groups are similar to one another. An ANOVA with the three speaker groups as a between-subjects factor and stimulus set as a within-groups factor showed a significant main effect of stimulus set, F(1,50) = 6.22, η2 p = .111, p < .05, a marginally significant effect of speaker group, F(2, 50) = 2.76, η2 p = .099, p = .07, and no interaction of speaker with stimulus set, F(2, 50) = 0.90, p > .10. Post hoc comparisons (LSD) showed that the Lower English Usage bilingual group differed significantly from the monolinguals, p < .05, with the Higher English Usage group showing a trend in that direction, p = .09, and the two bilingual groups did not differ significantly from each other, p > .5.
Because the two bilingual groups did not differ significantly and the sample size for both (especially the Higher English Usage group) is small, we combined the two for greater power. An ANOVA comparing the monolingual speaker group to the combined bilingual speakers showed a significant main effect of stimulus set, F(1,51) = 9.46, η2 p = .157, p < .005, a significant main effect of speaker group, F(1, 51) = 5.6, η2 p = .099, p < .05, and no interaction of speaker group with stimulus set, F(1, 51) = 1.3, p > .10. For dishwares alone, the difference between monolinguals and bilinguals was marginally significant, t(51) = 1.53, p < .07. For containers alone, the difference was significant, t(51) = 2.03, p < .025. Consistent with the free naming results, the effect of using L2 English on L1 Mandarin is greater for containers.
Critically, this outcome confirms that on an individual level, bilinguals are making name selections in forced choice that still diverge significantly from those of monolinguals. They seem to do so for both stimulus sets, although the effect is more clearly demonstrated for the containers set.
Because our choice of character to represent the Pinyin tong may not have been optimal, and given that six objects had tong as their dominant name here compared to four for monolinguals, one might wonder if the difference in container choices for monolinguals vs. bilinguals rests on less sensitivity to the difference between the characters by bilinguals. As reported earlier, in forced choice, tong accounted for 11% of all monolingual choices. For bilinguals, the proportion of responses consisting of tong was identical to that: Both Lower and Higher English Usage bilinguals selected tong on 11% of all container trials. Selection frequencies were also very similar across groups for the other three container words (for monolinguals and Lower and Higher English Usage bilinguals, respectively: 57%, 54%, and 55% for ping, 16%, 18%, and 17% for guan, and 16%, 17%, and 17% for he. The group differences in scores must therefore rest on the small selection frequency differences for the non-tong words, and, mainly, on the particular objects for which each word was selected.
In free naming, the Higher English Usage group showed a larger discrepancy from monolinguals than the Lower English Usage group did for containers (although not for dishwares). Here, the two bilingual groups did not differ from each other for either stimulus set. However, as noted earlier, although the Lower English Usage group here closely matches the free naming Lower English Usage group on verbal fluency scores, the Higher English Usage group here is not as distinct from the Lower English Usage group, making differences less likely to be detected. The difference between levels of English usage is seen in English progress by the two groups, but not in Mandarin change.
L1 Mandarin: Confidence and L1-L2 performance relationship
Confidence ratings were high and showed little difference across groups: for monolinguals, 6.21 for dishwares and 5.82 for containers; for Lower English Usage bilinguals, 6.24 and 5.90, respectively, and for Higher English Usage bilinguals, 6.21 and 6.16. An ANOVA with the three speaker groups as a between-subjects factor and stimulus set as a within-groups factor found a main effect of stimulus set, F(1,50) = 17.20 ηp 2= .256, p < .001, but no main effect of speaker group, F(2, 50) = .22, ηp 2= .009, p > .5. A marginal interaction of speaker group with stimulus set, F(2, 50) = 2.53, ηp 2= .092, p < .09, reflects the fact that bilinguals produced higher mean values than monolinguals for containers but not dishes. LSD comparisons showed no significant differences between pairs of groups. Apparently, the bilinguals are not sensitive to their modest discrepancies from monolinguals, at least as reflected in confidence in their choices.
Despite the apparent metacognitive insensitivity of bilinguals to their individual discrepancy from monolingual L1 speakers, there was a positive relation of their scored performance in Mandarin with their scored performance in English: for Higher English Usage bilinguals, r = .35 and .28 for dishwares and containers, respectively, and for Lower English Usage bilinguals, .28 and .18, respectively. Although the values are not significant, the trend is consistent with findings by Malt et al. (Reference Malt, Li, Pavlenko, Zhu and Ameel2015). Malt et al. evaluated the possibility that greater progress in L2 would create greater change to the L1 but found, instead, no relation between the two measures for dishwares and a small, positive (marginally significant) relation for containers. The trend in the current results supports the speculation that verbal ability and/or other learning and motivation variables may result in individuals who do the best in L2 learning also being those who retain the most native-like L1 performance (Bylund, Abrahamsson & Hyltenstam, Reference Bylund, Abrahamsson and Hyltenstam2012; Frost, Siegelman, Narkiss & Afek, Reference Frost, Siegelman, Narkiss and Afek2013).
L1 Mandarin: Summary of results
Bilinguals’ Mandarin name choices shift to some extent in a forced choice format, compared to free naming, as they did for monolinguals. However, discrepancies of bilinguals from monolinguals are still found, although less so than for L2. (We consider reasons for the lesser difference in L1 than L2 below). Together, these outcomes suggest that (a) there is an influence of processing factors on name choice, but (b) an underlying difference between monolingual and bilingual speakers exists in the understanding of the word uses for L1.
General Discussion
Key findings and implications from forced choice name selection
For both L1 and L2, a forced choice name selection task reduced differences between monolinguals and bilinguals relative to free naming. This outcome implicates memory retrieval difficulties and/or cross-language activation of word forms as a contributor to bilingual free naming patterns. Nevertheless, bilinguals remained distinct from monolinguals. Critically, this outcome argues that, beyond processing factors, bilinguals’ underlying meaning representations differ from those of monolinguals. As such, it supports the interpretation in a number of previous studies (e.g., Ameel et al., Reference Ameel, Storms, Malt and Sloman2005; Jarvis, Reference Jarvis and Cook2003; Jarvis & Pavlenko, Reference Jarvis and Pavlenko2008; Malt et al., Reference Malt, Li, Pavlenko, Zhu and Ameel2015; Pavlenko, Reference Pavlenko, Schmid, Köpke, Kejser and Weilemar2004, Reference Pavlenko and Pavlenko2009; Pavlenko & Malt, Reference Pavlenko and Malt2011), although a full interpretation must now acknowledge the contribution of on-line factors.
Effects of L2 use on L1 and L2 have been well-documented for some time, for morpho-syntax and phonology as well as the lexicon (see, e.g., Cook, Reference Cook2003; Köpke, Schmid, Keijzer & Dostert, Reference Köpke, Schmid, Keijzer and Dostert2007). The current findings contribute to the growing understanding of the factors that underlie these changes. Although the on-line processing and representational change possibilities are theoretically distinct, they are not mutually exclusive, and both can impact word choices. (See De Groot, Reference De Groot, Filipovic and Putz2014, for an argument favoring cross-activation effects across additional linguistic domains and Stolberg & Münch, Reference Stolberg and Münch2010, on retrieval difficulties across linguistic domains; cf. Lebkuecher, Reference Lebkuecher2015, for evidence that L2 influence on L1 grammar may entail representational changes and Schmid & Dusseldorp, Reference Schmid and Dusseldorp2010, for limitations of word retrieval explanations for word choice shifts).
Bilingual forced choice responses in L1 were significantly but only slightly different from those of monolinguals here. Larger differences may be evident under other circumstances (see below). But even if the difference attributable to changed meaning representations is modest under all circumstances, that fact should not undermine its interest. The existence of any L1 changes under late L2 immersion speaks to the continued plasticity of L1 across the lifespan. A subtle but real difference in L1 under late L2 influence has also been found in other language domains (e.g., phonology: Flege, Reference Flege, Burmeister, Piske and Rohde2002, Reference Flege, Cole and Hualde2007; parsing preferences: Dussias & Sagarra, Reference Dussias and Sagarra2007). Together, such findings point to a pervasive L2 influence on L1 and permeability of each language's knowledge base by the other, as well as long-term plasticity of the representations. As such, they reveal fundamental characteristics of linguistic systems and raise further important questions about this plasticity. For instance, if an L2-immersed individual returns to the L1 environment, how quickly and how fully would L1 patterns shift back to monolingual-like? And does the answer depend only on the extent of continued use and/or exposure to the L2 relative to L1, or does the global cultural context in some way facilitate retrieval of L1 words or naming patterns independent of exposure-based updating of representations?
L1 vs. L2 extent of change
Our two bilingual groups showed a large effect of the extent of their English usage on English performance scores, but a much smaller effect on Mandarin scores. As noted earlier, the two groups were less well differentiated than the groups in Malt et al. (Reference Malt, Li, Pavlenko, Zhu and Ameel2015). Presumably a well-entrenched L1 lags behind a developing L2 in reflecting the impact of L2 use. A higher level of English usage may be necessary before the two bilingual groups are behaviorally different from each other in L1, and before their degree of divergence from monolingual speakers of their own native language could approach that of divergence from monolinguals of their second language.
However, it is interesting that in free naming, the situation was different: bilingual scores were farther from agreement with monolinguals in the L1 than in the L2. The difference could suggest that L2 immersion created L1 retrieval difficulties in free naming. This is unlikely to be the whole story, however, since the largest discrepancies from monolingual free naming occurred for containers, where there were only four monolingual dominant names and these were also dominant for bilinguals.
Instead, an important contributor to the small bilingual effect in Mandarin forced choice may be the greatly reduced consistency among monolinguals compared to monolingual free naming scores, yielding lower monolingual mean scores. The relatively small difference between monolinguals and bilinguals in forced choice may be, at least in part, because the forced choice task induced Mandarin monolinguals to behave more like bilinguals. This could happen if the absence of phrasal context makes choices less straightforward (as discussed earlier – similar to asking English speakers if a bar of soap is a simply a bar), or due to a conscious or unconscious response to task demands by spreading out choices across the options offered, or through some combination of both.
Regardless of the reason that Mandarin monolinguals’ agreement scores dropped closer to bilinguals’, this reduction leaves open the interesting possibility that underlying L1 word knowledge differs more between the groups sampled here than it appears. Given the different interpretation ambiguities of free naming, it is not clear what kind of task could provide a purer way of discriminating underlying knowledge from processing influences.
Domain differences: Another indicator of representational change
In free naming, bilinguals had shown a domain difference: Higher English usage brought bilinguals closer to monolinguals in L2 only for dishwares and farther from monolinguals in L1 only for containers. The forced choice outcomes also demonstrate the same domain differences, although manifested in slightly different ways. In English, Higher English Usage bilinguals were closer than Lower to monolinguals in word selection frequency for dishwares but not containers. Forced choice brought both bilingual group frequencies closer to monolinguals for dishwares but decreased correspondence for containers. And in scores of individual bilingual agreement to monolinguals, the gap between monolinguals and bilinguals was larger for containers. These outcomes indicate that acquiring the L2 pattern was harder for containers. In Mandarin, the three groups were more similar to one another, so the first two domain effects seen in L2 did not emerge. Still, in individual naming scores, the gap between monolinguals and bilinguals was larger for containers.
Malt et al. (Reference Malt, Li, Pavlenko, Zhu and Ameel2015) argued that the domain difference came about because the naming patterns between languages were more dissimilar for containers, and native English speakers also agreed less on the container names, providing less consistent input. The forced choice results conclusively rule out word retrieval difficulties as the source of these differences. Bilinguals may have overused English bottle in free naming when they couldn't think of an alternative name, but in forced choice it is apparent that they still are not sure what the appropriate range for bottle is. This is particularly striking because bilinguals are likely to have been exposed to bottle both in formal instruction and daily life. The difference between monolinguals and bilinguals is smaller in L1 Mandarin, but here, too, the distribution of the most common word, ping (log 10 frequency of 3.4; Cai & Brysbaert, Reference Cai and Brysbaert2010) for bilinguals differs from that of monolinguals.
Relatedly, the groups differ in agreement level for ping and guan. For monolinguals, the mean agreement for objects having ping as the dominant name was 82% whereas it was just 60% for objects having guan as the dominant name. The two values were 77% and 72% for lower English Usage bilinguals and 77% and 71% for higher English Usage bilinguals, respectively. These values reinforce the idea that bilinguals have shifted from monolinguals in their intuitions about where ping and guan do or do not belong.
Implications of L1-L2 tradeoffs
If there is a tradeoff where less use of L1 opens it to more change (e.g., Paradis, Reference Paradis, Köpke, Schmid, Keijker and Dostert2007), greater progress toward matching the L2 monolingual standard should result in greater divergence from L1 monolinguals. However, Malt et al. (Reference Malt, Li, Pavlenko, Zhu and Ameel2015) found no relation for dishwares and a weak positive relation for containers. In the current study, we found a larger (although non-significant, given the smaller sample size) positive relationship for both stimulus sets. This trend favors the speculation that individual differences related to verbal ability, motivation, or other variables are important to mastering two separate monolingual-like L1-L2 naming patterns.
Relevant for our central issue, the modest positive relationship across individuals argues against cross-language activation of word forms as the explanation of cross-language influence. That explanation assumes that it is patterns conforming to monolingual preferences in one language that cause non-monolingual performance in the other. Given that, one would expect individuals who are most monolingual-like in one language to be least monolingual-like in the other. The relationship does not hold in our data. If it were present, one would see the correlations at least trending toward negative.
Conclusion
Performance in language tasks requires both accessing mental representations and processing them. Each task creates its own mixture of demands, and it is unlikely that there is any one task that is the perfect one to address all questions about a given issue. The contrast between free naming and forced choice has provided useful information about bilingual lexical interaction. The reduced discrepancies between monolinguals and bilinguals suggest that part of the observed cross-language influence in bilingual object naming is due to processing. At the same time, the persistence of differences in forced choice argues that the underlying word knowledge of bilinguals also differs. In the current data, the discrepancies attributable to underlying word knowledge are most pronounced for L2, but more extensive L2 immersion may increase discrepancies from monolingual L1.
Appendices
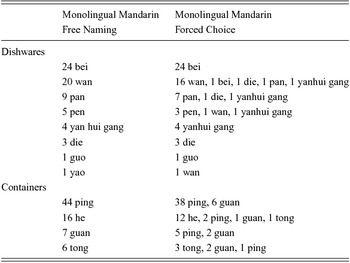
Forced choice distribution of monolingual names across the 67 pictures of the dishwares set and 73 pictures of the containers set, grouped by Mandarin. (Numbers indicate how many objects have the listed name as dominant.)

Monolingual English forced choice distribution of dominant names across the 67 pictures of the dishwares set and 73 pictures of the containers set, grouped by free naming choice.

Monolingual Mandarin forced choice distribution of dominant names across the 67 pictures of the dishwares set and 73 pictures of the containers set, grouped by free naming choice.