


Introduction
It is predicted (e.g. Reference Warrick, Le Provost, Meier, Oerlemans, Wood-Worth, Houghton, Callander, Harris, Kattenberg and MaxkellWarrick and others, 1995) that under a warmer climate caused by increasing CO2 in the atmosphere, the cold air over Antarctica will contain more moisture, and precipitation will therefore increase. This will have an impact on the mass balance of the ice sheet. In the next century, the increase in accumulation is predicted to offset, to some extent, the increase in ice loss at the ice margin from a warmer ocean and increasing air temperatures (Reference Budd, Simmonds, Weller, Wilson and SeverinBudd and Simmonds, 1990). However, until the present, ice-sheet modellers have estimated the rate and pattern of future increases in precipitation in their calculations, because these are poorly represented in many climate models.
This paper provides a link between the improved representation of the accumulation in climate models, the changes in accumulation, and sub-surface ice-shelf melt under a transient increase in atmospheric CO2 concentration, and the ice-sheet response over a 500 year period. This is achieved by using output from a transient climate-change simulation of a coupled ocean atmosphere model (Reference Gordon and O’FarrellGordon and O’Farrell, 1997; Reference Dix and HuntDix and Hunt, 1995) to force a high-resolution model of the Antarctic ice sheet. The ice-sheet model simulates the growth and retreat of the ice sheet as a response to changes in net accumulation, melting al the margins, and changes in sea level (see Reference Budd, Jenssen and SmithBudd and Jenssen (1989) for details). The issues addressed concern only the short time-scale response of the ice sheel to the warming signal over the next 500 years. Potential changes to ice-sheet dynamics from change’s to internal shear, strain rates and basal sliding are beyond the scope of this paper and have been addressed elsewhere (see Reference Budd, McInnes, Jenssen, Smith, Van der Veen and OerlemansBudd and others (1987) for a review). The ice-sheet model starts with a close representation to the present ice sheet, near steady-state balance.
Improvements to Simulated-Accumulation Rate with Semi-Lagrangian Advection and Higher-Resolution Topography
The CSIRO atmospheric general circulation model (GCM) used in these experiments has 9 vertical levels, and a spectral resolution of R21 (approximately 3.2° in latitude by 5.6° in longitude). A full description of the Mark 1 (Mk1) version of the model is provided by Reference McGregor, Gordon, Watterson and DixMcGregor and others (1993). The Mark 2 (Mk2) version differs from Mk1 in several respects, principally the introduction of a more sophisticated laud-surface scheme (Reference Kowalezyk, Garratt and KrummelKowalezyk and others, 1991) and an improved treatment of sea ice (Reference O’FarrellO’Farrell, in press).
The earlier CSIRO9 Mk1 model climatology of annual accumulation of snow calculated using the precipitation minus the evaporation (P–E) is shown in Figure 1a. There are major problems in the model representation of accumulation rate over the Antarctic continent. The minimum snowfall is too high (by a factor of 6) in comparison with observations (Reference Giovinetto and BullGiovinetto and Bull, 1987), and there is an unrealistic gradient in accumulation across the continent. The model does correctly reproduce some observed features, namely the increasing accumulation over the Antarctic Peninsula and a minimum in accumulation over the Ross Ice Shelf. The likely source of the errors in the precipi-tation is in the method used to advect moisture in the model. In the Mk1 model, an Eulerian approach is employed.
Accumulation (mm a−1)for (a) Mk1 simulation; (b) simulation, R21 resolution; (c) Mk2 simulation, R42 resolution. Calculated from 20 year control simulations.

The Eulerian calculation of moisture advection using spectral methods can result in negative moisture values, due to truncation errors, particularly in the region of sharp gradients (the Gibbs phenomenon, e.g. Reference Hack and TrrenberthHack, 1992). Since moisture is a positive definite quantity, a correction is made to remove these negative values whilst conserving overall moisture content. Though invoked globally, this “negative fix up” is made most frequently over Antarctica, where, in addition to the sharp gradients of moisture that occur over the continental margins, the air is very dry.
To address these problems, semi-Lagrangian treatments of moisture advection have been found to be beeneficial in spectral-atmospheric GCMs (e.g. Reference Williamson and RaschWilliamson and Rasch, 1989). The scheme used in the CSIRO GCM incorporates an economical scheme for the calculation of the departure points of trajectories (Reference McGregorMcGregor, 1993), and uses cubic Lagrangian interpolation to calculate the moisture values at the departure points. A quasi-monotone scheme (Reference Bermejo and StaniforthBermejo and Staniforth, 1992) is used to prevent the generation of spurious overshoots, and to ensure non-negativity of the interpolated moisture values. A posterior adjustment is made to ensure global moisture conservation, but this adjustment is much smaller than the negative fix up required by the Eulerian scheme. Such schemes for moisture transport improve the representation of the precipitation pattern in the model. The improvement is most noticeable at the poles, where the decrease in errors in the advection reduces the need for a negative-correction term.
The semi-Langrangian moisture-transport calculation has had a significant effect on the precipitation pattern over Antarctica, with the improved accumulation results from the CSIRO9 Mk2 model presented in Figure 1b. This figure shows that the model now correctly predicts very low accumulation amounts of < 50 mm a−1 over much of the high eastern part of the continent. The accumulation increases towards the coast in a more realistic fashion than in the Mk1 model. The maximum snowfall on The continent is 585 mm a−1.
However, a major precipitation error occurs every month over the continental rise of West Antarctica, between 0° and 30° W, in the region of Pensacola Mountains. The error appears to be due to the steep topography of the ice sheet in this region. Figure 1c shows the annual accumulation for an interim version of the model operating at twice the horizontal resolution (R42). The error is no longer present as the topography is now belter resolved. Furthermore, the minimum in snowfall over East Antarctica, and the maximum over the Antarctic Peninsula (881 mm a−1) are more realistic. The model also resolves the accumulation minima over the Ross and Filchner-Ronne Ice Shelves.
The improvement in simulated precipitation over Antarctica with a semi-Lagrangian moisture scheme was also reported in the NCAR CCM2 model by Reference Bromwich, Chen and TzengBromwich and others (1995). The new models better capture the atmospheric processes that affect the precipitation and evaporation distributions in the drier conditions of high latitudes.
Response to Increasing Co2 Concentration
The change in P−E over Antarctica in several climate-change experiments using the CSIRO9 GCM has been examined to see how use of precipitation patterns that are more realisti (at least for the current climate) alters the predictions corresponding to increased CO2 concentrations. These results are obtained from equilibrium climate-change experiments, where the atmospheric model is coupled to a fixed-depth, mixed-layer ocean. The CO2 concentration in these experiments is instantaneously doubled, then the model is allowed to reach a new equilibrium climate. The average annual accumulation rate (in mm a−1) for selected latitudes for 1 × CO2 conditions and the percentage increases for 2 × CO2 are tabulated in Table 1 for several experiments.
Comparison of global (GL) and Southern-Hemisphere (SH) warming at 2 × CO2 (in °C), annual accumulation (in mm a−1) and percentage increase in accumulation for Mk1 (Eulerian), Mk2 (Semi-Lagrangian), R42 and transient CO2 doubling experiments. The Mk1 model has annual average accumulation of 396 mm a−1 in the Antarctic region with an average increase of 17% under doubled CO2 conditions, while in the Mk2 model, the accumulation is 267 mm a−1 and the increase under doubled CO2 conditions is 30%

CSIRO9 Mk1, which has poorer climatology for the accumulation pattern, showed an increase of accumulation between 23 and 35% over the continental margins with smaller increases (about 15%) over the interior ice sheet. The results from the Mk2 experiments with the semi-Lagrangian scheme show much greater increases (80%) near the Pole, where the control simulation of the model now has a realistic minimum in precipitation. There is also a greater percentage Increase in accumulation across the continental margins (20–30%) and an opposite gradient in P−E percentage changes to that seen in the Mk1 doubled-CO2) simulation. Similar results are seen with the higher resolution (R42) model, with greater percentage increases in accumulation in the drier parts of the continent. This consistency between models of different horizontal resolutions, using the semi-Lagrangian scheme, indicates that the large precipitation error seen in The R21 results (Fig. 1b) has not biased the results for changes in accumulation.
The final set of columns in Table 1 shows the accumulation changes in the Mk2 model with a transient increase in CO2, at a rate of 1%, compounding using a fully coupled atmosphere—ocean—sea—ice model (Reference Gordon and O’FarrellGordon and O’Farrell, 1997). The pattern of accumulation change in the transient simulation is similar to the equilibrium result (Mk2), in that the maximum percentage increase occurred nearest the Pole. However, the amplitude of both the accumulation response and the temperature rise (2.1°C) are considerably weaker as the CO2 is gradually increased.
Scenario from the IS92A Transient Experiment
Further transient experiments were undertaken with the CSIRO coupled model using the IS92A scenario (Reference Leggett, Pepper, Swart, Houghton, Callander and VarneyLeggett and others, 1992) for the rate of effective CO2 increase. The IS92A scenario is thought to represent a more realistic growth rate of CO2 for the next century, with doubling of the CO2 concentration in 129 years, as opposed to 70 years for the 1% compounding case. The global mean temperature increase at the time of doubling is 2.1°C for the 1% compounding case and 2.2°C for the IS92A case. The regional pattern of warming is similar in both transient simulations. The slight increase in warming is due to the slightly greater uptake of heat by the ocean over the longer time-scale of the simulation. This simulation was continued to 3 × CO2 a further 52 years, when the global warming reached 3.8°C. An overview of the response of main of the atmospheric and oceanic variables for the standard case is provided by Reference Dix and HuntDix and Hunt (1995).
The reduction in sea-ice volume around Antarctica, and the polar amplification of the warming signal, is less in coupled-model simulations than in earlier equilibrium-model results (Reference Watterson, O’Farrell and DixWatterson and others, in press). This is due to reduced warming over the Southern Ocean that occurs through greater uptake of heat and the mixing of the signal into the ocean interior following deep convection (Reference Manabe and StoufferManabe and others, 1991; Reference Gordon and O’FarrellGordon and O’Farrell, 1997). However, even though there are still some uncertainties in the coupled models, particularly due to the dependence on flux corrections, the prediction of the impact of global warming on the Antarctic ice sheet developed from a transient model will probably be more realistic than, for example, that estimated by Reference Budd, Jenssen, Mavrakis and CouttsBudd and others (1994).
The rate of retreat of sea ice in the model alters the surface area from which additional moisture can be made available close to the continent, and hence the rate of sea-ice retreat is critical to changes in accumulation rate under doubled-CO2 conditions. However, a small drift in the control run occurs in the standard version of the coupled model, causing the air temperature slowly to decrease by 0.5°C over two centuries, and leads to an increase in the mean sea-ice volume of 25%. Another problem with the ocean component of the standard coupled model is that the coupled model may have too high a rate of convection; this is indicated by experiments of tracer subduction into the water masses of the Southern Ocean (Reference EnglandEngland, 1995). A second coupled model IS92A transient simulation (GM) was undertaken by Reference Hirst and GordonHirst and others (1996), using a parameterization for eddy-mixing in the ocean (Reference Gent and McWilliamsGent and McWilliams, 1990), which increases the density of the bottom water and hence reduces the rate of Southern Ocean convection. This simulation has the advantage that by providing a better estimate of ocean-heat uptake, the rate of ocean warming adjacent to the ice shelves is more realistic. This new simulation also had minimal drift in the air temperature and Southern Ocean sea-ice extent.
The ice-sheet model (Reference Budd, Jenssen and SmithBudd and Jensen, 1989) is forced over the first 180 years with 10 year averages of the coupled-model anomalies, defined as the difference between the transient-model simulation and the control simulation of P−E, air temperature, sea-surface temperature, and ocean temperature at 250 m depth taken from the GM transient-coupled IS92A run. After 180 years, these anomalies are held constant for the following 320 years of the ice-sheet simulation. The model output has been smoothed in the area of the West Antarctic precipitation error to ensure that peak-accumulation anomaly values are no higher than those in the Antarctic Peninsula region.
The anomalies in annual accumulation at the time of CO2 tripling are given in Figure 2a. The anomaly is greatest over the West Antarctic and Antarctic Peninsula region, and weaker in the drier areas of the continent. Figure 2b shows the atmospheric temperature-anomaly pattern over the continent at the time of CO2 tripling. the temperature anomaly over the continent ranges from 3–5°C, with a larger anomaly around the area of sea-ice retreat off the East Antarctic coast. Both temperature and accumulation anomalies are smaller than those used by Reference Budd, Jenssen, Mavrakis and CouttsBudd and others (1994).
External forcing imposed on an ice-sheet model for 3 × CO2 conditions. (a) Accumulation anomaly (mm d−1); (b) Air temperature anomaly; (c) Ocean temperature anomaly above 100 m; (d) Ocean temperature anomaly below 100 m.

Figures 2c and 2d show the ocean-temperature anomalies averaged over the upper 100 m, and centred at 250 m, respectively. The ocean-temperature anomaly for the 250–750 m layer, which is in contact with the main ice shelves (Reference Hellmer and JacobsHellmer and Jacobs, 1992, Reference Hellmer and Jacobs1995; Reference Jenkins and DoakeJenkins and Doake, 1991), is similar in amplitude and pattern to Figure 2d. The temperature anomalies of Figure 2d are used to calculate melt rates at the ice-shelf edge, and also for underneath the ice shelves. The surface layers in both the Ross and Weddell Seas have a net cooling of >0.5°C at 3 × CO2 in the transient simulation, while the same regions warm at depth by 1–2°C. The cooling of the ocean surface and warming at sub-surface levels are the result of the decrease in The convection rate in the transient model, which is due in turn to the strengthening of ocean stratification by the increased fresh-water flux from P−E changes and melting sea ice. It is possible, however, that an anomaly as large as 2.5°C (for transient 2 × CO2 conditions) will not impact directly on the ice shelf for the whole of the last 320 years, because earlier in the transient run a smaller temperature anomaly will increase the melt rate and introduce a fresher layer beneath the ice shelf. This may stratify the water column and slow the rate of heat transfer to the ice shelf. To investigate fully the effect of ice-shelf fresh-water fluxes on the melt rate in the future, one would have to include the fluxes in a new transient-coupled simulation.
Ice-Sheet Model
The ice-sheet model used in this experiment operates at a horizonlal resolution of 20 km. A detailed description of the physical processes included in the model is given by Reference Budd, Jenssen and SmithBudd and Jenssen (1989) with additional information by Reference Budd, Jenssen, Mavrakis and CouttsBudd and others (1994). Of particular interest to ice-sheet-ocean interaction is the ice-shelf parameterization (Reference MavrakisMavrakis, 1993), which does not include a marine ice layer from basal freezing in the present climate. The rate of ice melt is a nonlinear function of temperature based on laboratory experiments (Reference Russell-HeadRussell-Head, 1980), and observations of iceberg melting rates (Reference Budd, McInnes, Jenssen, Smith, Van der Veen and OerlemansBudd and others, 1987). All ice-sheet melting is applied as ice-shelf thinning rather than calving at the ice front, since both represent a direct loss and increased calving occurs with the thinning of the ice shelf as ice thinner than 250 m is removed.
At 20 km resolution, the model is able to resolve the flow of the larger ice streams that feed into the ice shelf. Detailed maps of the velocities in these streams, showing values up to 300–500 m a−1 as compared with less than 5 m a−1 for the interior of the West Antarctic sheet, are given by Reference Budd, Jenssen and SmithBudd and others (1984). For the present work, the ice-sheet model has been modified to allow the ice-shelf basal-melt rates to be prescribed at each gridpoint, based on water temperatures mapped from the adjacent coastal ocean into the ice-shelf cavities.
Reference Budd, McInnes, Jenssen, Smith, Van der Veen and OerlemansBudd and others (1987) examined the effect of increasing strain rates on a hierarchy of models along flow lines in the West Antarctic ice sheet-Ross Ice Shelf region, and also used a coarse-resolution model of the whole continent to examine changes to the ice dynamics and sea-level rise as the climate warmed. The effects of ice-shelf melting and increasing accumulation under a warmer climate (Reference Budd, Simmonds, Weller, Wilson and SeverinBudd and Simmonds, 1991) were added to the forcing used for projections for ice-sheet change by Reference Budd, Jenssen, Mavrakis and CouttsBudd and others (1994).
The approach followed for the present ice-sheet model simulations is similar to that outlined by Reference Budd, Jenssen, Mavrakis and CouttsBudd and others (1994). The dataset of Reference DrewryDrewry (1983) is used to set the initial-surface topography and bedrock of the ice sheet. The internal parameters of the ice-sheet model are adjusted to maintain conditions close to this state, with external forcing from present-day accumulation rates and an estimate of current ice-shelf melt rates. The model is then allowed to run forward; after an early compatibility adjustment (Fig. 3), a near-equilibrium is maintained for several thousand years. This near-equilibrium provides a useful control for studies of the effects of climate-change forcing, but does not imply that the real ice sheet is in equilibrium with present climate conditions.
Grounded ice-sheet volume time series for control (dashed line), increased precipitation only (M0, dotted line), transient increase (MT, dash-dotted line), 1°C anomaly (M1, solid line) and 2°C anomaly (M2, long dashed line).

The simulations, with the anomalies in external forcing (accumulation rate and rate of ice-shelf melt), are then compared to a control simulation with no changes to remove the effect of any minor drift or genuine imbalance that occurs on 500 year time-scales. The effect of global warming on the ice-sheet surface budget through melt has been neglected in the ice model. This is justified as the temperature warming imposed is of the order of 5°C; hence the surface temperatures are still below melting point (Reference HuybrechtsHuybrechts, 1994). Any areas of snow melt near the coast are not resolved by the 20 km grid.
As well as the experiment driven by the coupled-model data, three additional experiments have been undertaken to test the sensitivity of the model to the increase in ice-shelf basal melt. However, the arguments in the previous section—that the freshening of the ocean beneath the shelf may reduce the size of the temperature anomaly, and this could affect the rate of melt of the glacial ice—have been borne in mind. The sensitivity-study simulations include the transient increase in accumulation derived from the coupled model, and consider immediate ocean-warming values of 0°C (M0), 1°C (M1), and 2°C (M2), representing ice-shelf inch rates of 0 m a−1, 6.6 m a−1, and 18.6 m a−1 by the non-linear Reference Russell-HeadRussell-Head (1980) function.
The differences in ice volume from the control simulation of the grounded, floating, and total ice. as well as the contribution to sea-level change, are shown in Table 2. Figure 3 shows the time series of grounded ice volume for the five ice-sheet simulations. Only changes in the grounded ice, and its fraction above that required for floating, represent direct contributions to sea level.
Comparison of ice-volume (106 km3) changes from present conditions of total, grounded and floating ice, and the contribution to sea level (cm), between transient warming scenarios (MNL, ML), and idealized cases (M0, precipitation only; M1, 1°C warming under ice shelves; M2, 2°C warming)
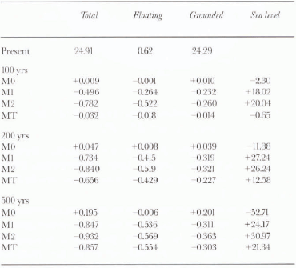
The higher melt-rate sensitivity runs (M1, M2) have lost 42 and 83% respectively of the floating-ice volume in the ice shelves after only 100 years of warming, though the ice shelves are replenished by further inflow from the ice streams with significant changes in ice elevation occurring near the grounding line of the Ross and Filchner-Ronne Ice Shelves. The change in floating-ice volume for the transient case is 3% after 100 years of simulation. The changes in grounded ice for the M1 and M2 simulations lead to a contribution to sea-level rise of 18–20 cm over the first 100 years. The transient model shows little change in sea-level height and grounded ice volume (Fig. 3) after 100 years, as the warming signal at depth is insignificant for the first 70 years and only slowly increases in the following century. This is because the coupled model suffers from a “cold start” where it takes several decades for the transient model to begin to warm due to thermal inertia in the ocean. The onset of the warming signal at depth is delayed even further due to the rate of heat subduction into the ocean.
A new transient simulation, which accounts for the rale of increase in CO2 since the last century, is underway and will give a more realistic estimate of the onset of warming at depth. The effect on the results presented here will probably be a shift in the time axis in Figure 3, leading to a slightly larger grounded-ice-loss�sea-level rise than in the MT experiment, but possibly offset by a corresponding shift in the accumulation changes.
The results of the cases considered here (Table 2, Fig. 3) are closer to the earlier results of Reference Budd, Jenssen, Mavrakis and CouttsBudd and others (1994) without the increased accumulation rate. The difference between the simulations is the assumed rate of increase of the accumulation rate, which is slower in the transient simulations. The implication of this over longer time-scales is discussed further in the next section.
Simulations M1 and M2 show that the possible reduction in melt rate as the ocean freshens may not significantly alter sea-level rise, as even a 1°C warming causes significant grounded-ice loss that is still higher than the transient simulation after 500 years. The time series for M1, M2 and MT also shows that there is a limit to how much floating and grounded ice is easily accessible to melting in the next 500 years, with all three results giving a total loss in the range 0.84–0.93 × 10⁶ km3. The M2 simulation acts as an upper limit to the transient simulation, but the ocean will continue to adjust beyond the 180 years of data used here, and will eventually reach the higher values used in the M2 simulation. The non-linearity response to the floating ice, seen in Table 2, is primarily due to advances at the ice front, as well as changes in the grounding line. This non-linearity in the ice-sheet model causes fluctuations around the noise level, and explains the opposing sign for changes of sea level and grounded-ice volume in the MT simulation in the first 100 years, when the perturbation to the external forcing is small.
There are questions concerning how close both the model and present-day observed ice sheet are to equilibrium. In the model, there is some adjustment between the amounts of grounded and floating ice, with changes of 0.007 × 10⁶ km3 in the first 100 years, and 0.071 × 10⁶ km3 over 500 years, even though the total ice amount in the control simulation has changed by only 0.02%. Over the time-scale of ice-sheet growth and decay, this 0.02% would be considered to be close to equilibrium. These internal changes represent 16% of the signal for the MT simulation after 100 years, 6.5% after 500 years, and the best estimates of error that can be derived from the current study.
Simulations with different initial conditions show only small differences in the amplitude of the contribution to sea-level rise after 500 years. These small differences indicate that the response at the grounding line and in the ice streams can evolve differently, with the change in flow in one ice stream impacting on the flow in neighbouring streams. This is seen in simulations M1 and M2, where a large ocean-temperature anomaly is imposed at the start, and the ice shelves melt rapidly with different ice streams supplementing the remaining shelves (representing about 15% of original floating-ice volume after 200 years). It is these changes in the ice streams above the grounding line that are critical to the change in grounded-ice volume, and hence sea-level rise. The response of individual ice streams to the warming signal is a key issue for further study by both the observational and modelling glaciological communities. From a numerical analysis perspective, the response of individual ice streams in the model to perturbations about the equilibrium also needs further study.
Despite the uncertainties outlined above, the conclusion of the set of experiments in this study is that after 500 years, the sea-level-rise contribution from the Antarctic ice sheet will be in the range of 21–31 cm. However, these rises from Antarctic ice sheet net loss should be considered in relation to the contribution from the thermal expansion of sea water. The estimation of sea-level rise from thermal expansion in the CSIRO9 IS92A simulation is 25 cm for the period up to doubling OfCO2 (Reference McDougal and JackettMcDougall and Jackett, 1995). For the longer time-scale response, the calculations of Reference Manabe, Stouffer, Spelman and BryanManabe and Stouffer (1994) give a sea-level rise of 1 m if the CO2 concentration is doubled, and 1.8 m if it is quadrupled over the next 500 years. It is clear from these comparisons that over the next 500 years, the greater contribution to sea-level rise will come from the thermal expansion of the ocean, with additional contributions from temperate glacial melt and the Greenland and Antarctic ice sheets (Reference Warrick, Le Provost, Meier, Oerlemans, Wood-Worth, Houghton, Callander, Harris, Kattenberg and MaxkellWarrick and others, 1995).
Discussion and Conclusions
The results presented in this paper have considered only the transient response of the ice sheet ov er the first 500 years to global warming. Both the coupled ocean-atmosphere system and the ice sheet will continue to respond to the increase in CO2, even if levels become stabilized in the atmosphere for several thousand years. To assess further transient changes, one needs to examine the equilibrium response of an atmospheric mixed-layer-ocean-climate simulation, the equilibrium response of the ice sheets to significant air temperature warmings, and consider further the oceano-graphic response in the vicinity of the ice shelves.
The results from equilibrium simulations with the CSIRO9 model, which used a mixed-layer ocean (Watter-son and others, in press), show summer temperature anomalies for 2 × CO2 of 5–6°C over Antarctica. For the model equilibrating to 3 × CO2 there is a global mean warming of 6.6°C, with summer warmings over East Antarctica of greater than 8°C and over the West Antarctic ice sheet and the Antarctic Peninsula of more than 10°C. Due to the elevation of much of the continent, these temperature anomalies only create areas of potential surface melting over the Antarctic Peninsula and the Filchner-Ronne Ice Shelf for 2 × CO2. By the time the model climate is in equilibrium with concentrations at three times the current levels, the region of surface melting has/will extend to the Ross Ice Shelf, and much of the coastal parts of the West Antarctic ice sheet, Palmer, Ellsworth, and Marie Byrd Lands.
It will take several hundred years for the coupled ocean atmosphere climate system even to approach global warmings of this magnitude. The simulations of Reference Manabe, Stouffer, Spelman and BryanManabe and Stouffer (1994) (the longest transient-climate simulations published so far) indicate time-scales around 500 years for the surface ocean and atmosphere for each 350 ppm increase in CO2 though the deep ocean will take much longer to equilibrate to the warming signal. This means that, in 500–1500 years from now, surface-melt processes will play a role in the response of the ice sheet. Over 5000– 10 000 year time-scales, air temperature rises of 9–10°C have been predicted to lead the large-scale disintegration of the West Antarctic ice sheet (Reference HuybrechtsHuybrechts, 1994) but to have minimal impact on the East Antarctic ice sheet.
A further point is that, unlike the study by Reference Budd, Jenssen, Mavrakis and CouttsBudd and others (1994), where the accumulation rate is doubled throughout the simulations, the increase in accumulation in the transient simulations is only 20% over the central continent south of 78°S, and 10% on the continental margins and Peninsula after 130 years, and double these percentage increases after a further 50 years. Table 1 shows that even after the model has reached an equilibrium 2 × CO2 climate, the percentage increase in accumulation is only 75% in The central region, and 20–30% on the margins of the continent. By the time the model climate has equilibrated with an atmospheric concentration of 3 × CO2, the accumulation increase has finally reached about double the current values (110%) south of 78°S, whereas over the latitude band of the Peninsula the increase is minimal. This slow rate of increase in accumulation, together with the fact that the majority of the increase is in the drier area of the continent, implies that surface melting will become increasingly important by the time the accumulation increase reaches its maximum. The conclusion reached in the past (Reference Budd, Jenssen, Mavrakis and CouttsBudd and others, 1994; Reference Warrick, Le Provost, Meier, Oerlemans, Wood-Worth, Houghton, Callander, Harris, Kattenberg and MaxkellWarrick and others, 1995) that the Antarctic mass balanec will represent a net negative contribution to sea-level rise over the next century, as increases in accumulation will more than offset the ice volume lost through the melting and calving of ice shelves, no longer holds.
The relationship between ocean-temperature rise and rates of ice melt used in the model is based on crude estimates. It does not take into account the circulation under the ice shelves, the differing geometries that will allow water masses to affect ice area closer to the grounding line under the Filchner�Ronne Ice Shelf, or the differing areas of ice melt and growth under present-day conditions (Reference Jenkins and DoakeJenkins and Doake, 1991). The circulation of meltwater under these shelves is complex, and any increase in melting from global warming will initially introduce a freshened layer. This could reduce further melting unless the current is strong enough to flush the freshened layer, and tidal mixing and other entrainment processes are able to mix the additional meltwater with other water masses. The density of water masses formed close to the ice shelf are linked to the rate of sea-ice production, which will reduce as the climate warms.
Until now, no transient climate-change experiment has included the fresh-water flux from ice melt in its calculations. It is clear that ice melt from the Antarctic and the Greenland ice sheets has the potential further to decrease the thermohaline circulation of the Southern Ocean and Greenland Sea beyond the decrease caused by the increased fresh-water flux that occurs at high latitudes from changes in P − E (Reference Gordon and O’FarrellGordon and O’Farrell, 1997). Reference Manabe, Stouffer, Spelman and BryanManabe and Stouffer (1994) calculated a surface melt of ice-sheet contribution for their 4 × CO2 simulation, but did not include it in the fresh-water flux to the ocean due to the uncertainties of how much of this additional melt will drain off into the Ocean. The signal for the Greenland ice sheet was about half the additional P−E and runoff, while the Antarctic contribution was about a third of the P−E flux.
A quantitative estimation of the fluxes of fresh water from ice-shelf melt for given temperature increases can now be made and potentially used in future transient climate-change experiments, particularly those out to 500 years and beyond. The likely impact of this fresh-water flux is to slow the rate of uptake of heat into the deep ocean, though potentially the surface ocean would warm more quickly as additional feedbacks come into play. Additional calculations could then be made for the likely sea-level rise from thermal expansion and ice-sheet melt beyond the 500 year limit considered here. Changes to the thermohaline circulation of the Southern Ocean, caused by additional freshening from ice-shelf melt, will not only alter the predictions of climate change over Antarctica, but across the Southern Hemisphere (Reference Whetton, England, O’Farrell, Watterson and PittockWhetton and others, 1996).
Acknowledgements
We would like to acknowledge colleagues in the climate-modelling programme (CSIRO) who participated in the development of the coupled-climate model and also to thank A. Hirst who undertook the IS92A simulation. Constructive comments on the manuscript were made by I. Smith and D. Etheridge. This work is a contribution to the CSIRO Climate Change Research Programme, which is supported by the Australian Department of the Environment, Sports and Territories.



