I. INTRODUCTION
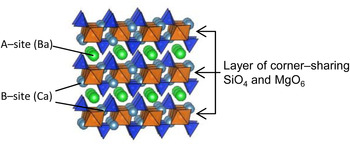
Over the past few decades, bracelet-type XY[TO4] compounds (X, Y: 10- and 12-coordinated cations; T: tetrahedrally coordinated cation) have attracted scientific attention in the field of structure–property relationships. In particular, glaserite-type oxides, such as K3Na(SeO4)2, K3Na(CrO4)2, and K3Na(MoO4)2, have been intensively studied because their ferroelastic character closely relates to the structural symmetry (Mróz et al., Reference Mróz, Kiefte, Clouter and Tuszyński1992; Krajewski et al., Reference Krajewski, Piskunowicz and Mróz1993; Kaczmarski et al., Reference Kaczmarski, Mróz, Kiefte, Clouter and Rich1994; Kaczmarski and Mróz, Reference Kaczmarski and Mróz1998). Since K2SO4 was found to be a potential candidate for radiation dosimetry (Gromov and Morton, Reference Gromov and Morton1966; Hayakawa and Ohta, Reference Hayakawa and Ohta1999; Ohta et al., Reference Ohta, Hayakawa and Furukawa2000), this type of compounds has been focused on as optical materials. In recent years, M 3MgSi2O8 (M = Ba, Sr, Ca) have been studied as host materials for Eu2+-activated phosphors (Barry, Reference Barry1968; Lin et al., Reference Lin, Tang, Zhang and Nan2003; Kim et al., Reference Kim, Lim, Jeong, Jeon, Choi and Park2005; Jung and Seo, Reference Jung and Seo2006; Okamoto et al., Reference Okamoto, Nanba, Honma and Yamamoto2008; Yonesaki et al., Reference Yonesaki, Takei, Kumada and Kinomura2008, Reference Yonesaki, Takei, Kumada and Kinomura2009; Im et al., Reference Im, Kim, Yoo and Jeon2009; Fu et al., Reference Fu, Hu, Wang, Wu and Wang2010). Their luminescence originates in 5d–4f electron transitions in Eu2+ ions. Since energy levels of Eu2+ are strongly affected by the crystal-field strength and site symmetry, precise structure analyses are required for M 3MgSi2O8 to understand the spectroscopic character of Eu2+ dopants. In our previous report, the crystal structure was approximately determined for BaCa2MgSi2O8 and their derivatives by X-ray powder diffraction technique, and the luminescence properties of Eu2+ were discussed in terms of the determined structure (Yonesaki et al., Reference Yonesaki, Takei, Kumada and Kinomura2008, Reference Yonesaki, Takei, Kumada and Kinomura2009). M 3MgSi2O8 has a layered structure (Figure 1). Corner-sharing SiO4 tetrahedra and MgO6 octahedra are polymerized to form the layer. Between the layers, there are three sites for alkali–earth cations; one is at the center of the interlayer space (A-site) and the remaining two are embedded in the layer pockets (B′- and B″-sites). M 3MgSi2O8 changes its space group, depending on the average size of A-site cations. At the same time, it has been reported that B-site cations also cause layer deformation associated with SiO4 twisting around threefold rotation axis (Park et al., Reference Park, Kim, Yonesaki and Kumada2011; Yonesaki, Reference Yonesaki2013). However, such layer deformation could not be identified only with X-ray diffraction (XRD) because of the small X-ray atomic scattering factor of oxygen. Actually Park et al. (Reference Park, Kim, Yonesaki and Kumada2011) used neutron powder diffraction to identify the SiO4 twisting in BaCa2MgSi2O8. In the present study, Raman spectroscopy and XRD were applied to Ba x Sr3- x MgSi2O8 solid solution series to elucidate the structure change caused by Ba/Sr-replacement. Vibrational frequencies are very sensitive to interatomic forces and site symmetry. Raman spectroscopy could thus trace small changes in crystal structure, which had been missed in X-ray powder diffraction. Firstly, Raman spectroscopy was applied to Ba x Sr3– x MgSi2O8 solid solution series in order to determine the Ba/Sr ratio at which structure symmetry changed. After that, structure analysis was performed using their XRD patterns. The resultant crystal structures were checked by factor group analysis using the Raman spectra again.
(Color online) Crystal structure of BaCa2MgSi2O8 illustrated with SiO4 tetrahedra and MgO6 octahedra.

II. EXPERIMENTAL
A. Synthesis
Ba x Sr3– x MgSi2O8 polycrystalline samples were prepared by solid-state reaction of reagent grade alkaline–earth carbonates, magnesium carbonate hydroxide, and silica. A small amount of ammonium chloride was used as a flux. Stoichiometric amounts of the reagents and the flux were ground and mixed by ball milling with zirconia beads in 2-propanol for 4 h. The mixed powder was heated at 1100 °C for 4 h in air with an intermittent regrinding.
B. Raman spectroscopy
Raman spectra were measured for the prepared samples at room temperature in backscattering geometry by a 3000 grooves mm−1 grating monochromator and charge-coupled device detector system (RENISHAW, inVia Reflex system). Samples were excited with the 488-nm line of a 50 mW Spectra–Physics Cyan™ Scientific CW laser. The laser beam was focused on a sample by a 50× objective lens. A spectral resolution was 0.5 cm−1. The laser power was attenuated to 5 mW before the irradiation. The obtained data were used for checking the symmetries of SiO4-derived vibrational modes.
C. XRD analysis
The prepared samples were ground with mortar and pestle and investigated by XRD at room temperature with a Rigaku RINT-2200HFV diffractometer in a 2θ range from 10° to 120° using CuKα radiation (λ = 1.5406 Å, 40 kV, 30 mA). The obtained data were used for checking impurities and for structure refinement processes. Structure refinement was carried out with the XRD data collected with step-scanning mode at intervals of 0.05° or 0.02° 2θ. After the probable space group selection with the indexing program TREOR90 (Werner et al., Reference Werner, Eriksson and Westdahl1985), structure parameters were refined by the Rietveld method using the refinement program RIETAN–FP (Izumi and Momma, Reference Izumi and Momma2007). The influence of the CuKα 2 line was taken into calculation in the refinement processes. Pseudo-Voigt function was used to fit the peak profile. Figures of the crystal structure were drawn with VESTA developed by Momma and Izumi (Reference Momma and Izumi2011).
III. RESULTS
A. Raman spectroscopy
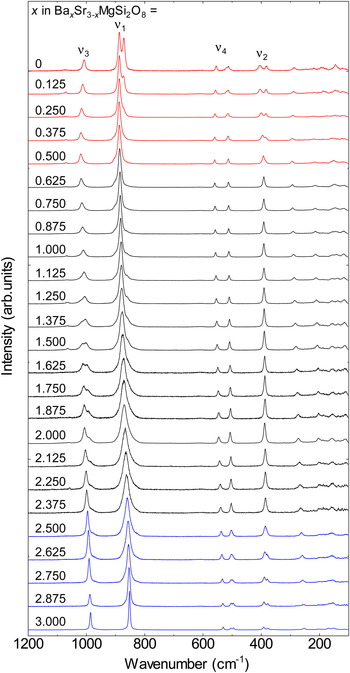
Figure 2 shows the Raman spectra of the prepared solid-solution series. Intense peaks were confirmed at about 880, 400, 1000, and 550 cm−1. Raman peaks at such high wavenumbers are attributed to the internal vibrations of certain atomic groups. In the present case, they corresponded to the four normal modes of SiO4 tetrahedra: symmetric-stretching vibrations ν 1, symmetric-bending vibrations ν 2, asymmetric-stretching vibrations ν 3, and asymmetric-bending vibrations ν 4, respectively (Remy et al., Reference Remy, Reynard and Madon1997). The Raman peaks below this region were because of the translational modes. In the Ba x Sr3– x MgSi2O8 series, a systematic peak shift was seen for the SiO4 internal vibrations in response to Ba/Sr replacement, which indicated that the crystal structure deformed continuously. It should be noted that some of the vibrational modes split or broadened for x ≥ 2.5 (ν 2 and ν 4) and < 0.5 (ν 1, ν 2, and ν 4). In both regions, translational modes also split. Such splits relate to the resolving of vibrational degeneracy associated with symmetry reduction. Therefore, Ba x Sr3– x MgSi2O8 series were categorized into three groups from the structural viewpoint: (i) x ≤ 0.5, (ii) 2.5 > x > 0.5, and (iii) x ≥ 2.5.
(Color online) Raman spectra for Ba x Sr3– x MgSi2O8 solid solution series. ν 1, ν 2, ν 3, and ν 4 correspond to symmetric-stretching vibrations, symmetric-bending vibrations, asymmetric-stretching vibrations, and asymmetric-bending vibrations, respectively. Individual spectra are categorized with different color based on the splitting behaviors of each vibrational mode.

B. XRD analysis
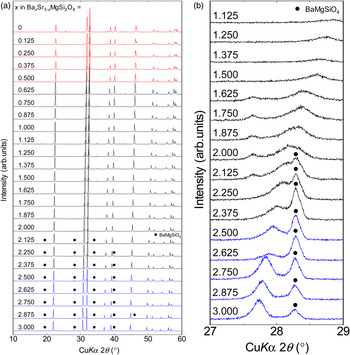
Figure 3(a) shows the XRD patterns of the Ba
x
Sr3–
x
MgSi2O8 samples. All the samples showed similar patterns, indicating their structural similarity. As for the samples of the Sr-rich group (i), all the diffraction peaks were successfully indexed with monoclinic cells of a = 9.4 Å, b = 5.5 Å, c = 13.9 Å, and β = 90°, while systematic absence of h + k = 2n + 1 was found. It is noteworthy that the hkl reflections having odd l were extremely weak. Furthermore, they attenuated with increasing Ba-ratio. This attenuation was followed by the halved c for x > 0.5. As for the samples of group (ii), most diffraction peaks were indexed with hexagonal cells of a = 5.5 and c = 7.0 Å, the volume of which was about four times smaller than the monoclinic cells of group (i). The other peaks observed for x > 2 were assigned to BaMgSiO4. For the Ba-rich group (iii), the obtained patterns were similar to those of group (ii). However, careful observation identified another diffraction peak at 27.8° 2θ [Figure 3(b)], the intensity of which was below 0.2% of the highest. By involving the identified peak in the indexing process, hexagonal cells of a = 9.7 Å and c = 7.2 Å were derived. This cell is about
 $\sqrt 3 $
×
 $\sqrt 3 $
× 1 times larger than those of group (ii).
(Color online) (a) XRD patterns for Ba x Sr3– x MgSi2O8 solid solution series. Individual patterns are categorized with different color based on the splitting behaviors of each vibrational mode (Figure 2). (b) Enlarged patterns of Figure 3(a).

Structural refinement was performed based on the obtained unit-cell parameters and systematic absence. The approximate structures of M
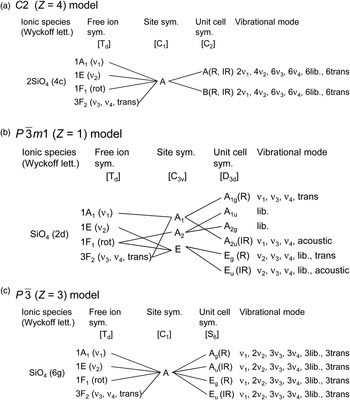
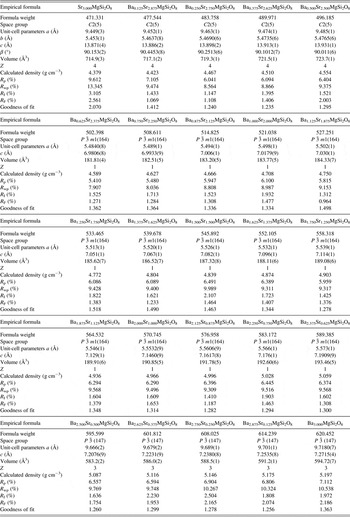
3MgSi2O8 (M = Ba, Sr, Ca) (Yonesaki et al., Reference Yonesaki, Takei, Kumada and Kinomura2008) were used as initial models. For the BaMgSiO4 phase, only the scale factors, unit-cell parameters, and profile functions were refined. The refined cell and structure parameters are listed in Tables I and II. The obtained structure was checked by factor group analysis of the Raman spectra (Figure 4). As for group (ii), Raman peak numbers agreed with the calculated ones (1ν
1, 1ν
2, 2ν
3, and 2ν
4). Although those of the other compounds were less than the expected [2ν
1, 4ν
2, 6ν
3, and 6ν
4 for group (i) and 4ν
1, 8ν
2, 12ν
3, and 12ν
4 for group (iii)], it was due to the fact that the non-degenerated Raman peaks did not split enough for separation. Nevertheless, we can obtain important information on the structure of group (iii) from this analysis. For a group (iii) compound Ba3MgSi2O8, two structure models have been proposed: P
 ${\bar 3}$
m1 (Z = 1) (Aitasalo et al., Reference Aitasalo, Hietikko, Hölsä, Lastusaari, Niittykoski and Piispanen2007; Yonesaki et al., Reference Yonesaki, Takei, Kumada and Kinomura2009) and P
 ${\bar 3}$
(Z = 3) models (Park et al., Reference Park, Hong and Keszler2009). There is a slight difference in SiO4 orientation between them. The former model is identical to those of group (ii). All the SiO4 tetrahedra point vertically to the layers. On the other hand, they tilt in the latter. From the Raman spectra measured in this study (Figure 2), the former model was excluded because at least two ν
2 modes were present for the compounds of group (iii). If the P
 ${\bar 3}$
m1 (Z = 1) model were correct, only one ν
2 mode would be observed [Figure 4(b)]. Iwata et al. (Reference Iwata, Horie and Fukuda2009) showed the SiO4 tilting with a split-atom model under the condition of P
 ${\bar 3}$
m1 (Z = 1). However, the tilting was not statistical but regular, as is clear from the translational symmetry based on the characteristic diffraction peak at 27.8°. Therefore, the P
 ${\bar 3}$
(Z = 3) model is reasonable for group (iii) compounds. As for Sr3MgSi2O8 (x = 0), the refined structure may be approximate considering the high reliability index of R
wp. However, in this study, structural change caused by Ba/Sr replacement is discussed using this model. From the refined structure, it has been revealed that with increasing Ba ratio, Ba
x
Sr3–
x
MgSi2O8 changes its space group in the following order: C2 (Z = 4), P
 ${\bar 3}$
m1 (Z = 1), and P
 ${\bar 3}$
(Z = 3). The former change corresponds to the generation of threefold rotation axes and mirror planes in addition to the halved period in the layer-stacking direction. The latter change is accompanied by a disappearance of mirror planes and of 2/3 of threefold axes. Figure 5 shows Ba-content (x in Ba
x
Sr3–
x
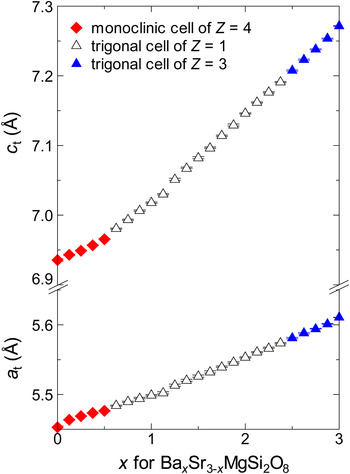
MgSi2O8) dependence of the cell size. To compare unit cells with different Z-values, cell parameters were converted to those of the corresponding trigonal cells of Z = 1 with the relations that a
t = b
m = a
T/
 $\sqrt 3 $
and c
t = c
msinβ/2 = c
T [subscript “m” means a monoclinic cell (Z = 4) of the group (i), “t” a trigonal cell (Z = 1) of group (ii), and “T” a trigonal cell (Z = 3) of group (iii)]. It can be seen that unit-cell size monotonically increases with increasing Ba-content (x). However, the increase rate for parameter c changes at x = 0.5. At this point, the crystal system changes between monoclinic and trigonal. Details of the structural change caused by Ba/Sr ratio are discussed in the ‘Discussion’ section.
Correlation tables for SiO4 tetrahedra in Ba
x
Sr3–
x
MgSi2O8; (a) C2, (b) P
 ${\bar 3}$
m1, and (c) P
 ${\bar 3}$
. R and IR indicate Raman active and IR active, respectively.

(Color online) Ba/Sr-ratio dependence of Ba x Sr3– x MgSi2O8 cell size. Unit-cell parameters were converted to a t and c t (Z=1) with the equations described in Section 3.2. Data-point shape indicates the type of the original cell. Closed diamonds, open and closed triangles correspond to monoclinic cells of Z = 4, trigonal cells of Z = 1 and of Z = 3, respectively.

Crystallographic data for Ba x Sr3– x MgSi2O8 solid solutions.

Atomic coordinates and isotropic displacement parameters for Ba x Sr3– x MgSi2O8.

IV. Discussion
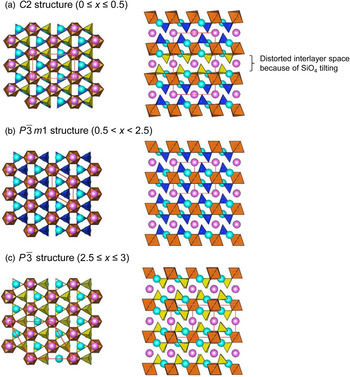
Figure 6 shows the change in Ba x Sr3– x MgSi2O8 structure caused by Ba/Sr replacement. As described in the Introduction section, Ba x Sr3– x MgSi2O8 is composed of layers of corner-sharing SiO4 and MgO6. Ba2+ and Sr2+ ions are sandwiched in between the layers. Structural refinement (Tables I and II) reveals that Ba2+ preferentially occupies the interlayer A-site. The observed structure change can be traced in association with this site selectivity. Firstly, we focus on BaSr2MgSi2O8 [x = 1.000, Figure 6(b)]. At this composition, Ba:Sr atomic ratio is 1:2, which corresponds with the ratio of A- to B-sites. In this compound, almost all Ba2+ ions occupy A-site and Sr2+ ions B-site. The Si–O2 dangling bonds protruding from the flat layers are coaxial with threefold rotation axes. They directly face to the neighboring B-site cations and make Si–O–B pillars perpendicular to the layers.
(Color online) Crystal structure of Ba x Sr3– x MgSi2O8 illustrated with SiO4 tetrahedra and MgO6 octahedra. A- and B-site cations are given by pink and light blue spheres, respectively. Red solid line frames indicate unit cells. Tilted SiO4 tetrahedra are highlighted in yellow color.

As Ba/Sr ratio decreases from the above situation, A-site Ba2+ is gradually replaced by Sr2+. Simultaneously, the average size of A-site cations is reduced. The smaller A-site cation is accommodated by narrowing interlayer spaces. However, the narrowing rate is low, as shown in Figure 5, because the interlayer spaces are supported by Si–O–B(Sr2+) pillars. In the compounds of x ≤ 1, structural fluctuation is presumably present at A-site, as seen in the sudden increase in the isotropic atomic displacement parameter B for A-site cation (~0.7 for x > 1 and ~1.0 for x
 $ \;\leq\; $
1; Table II). For x < 0.5 [group (i)], SiO4 tetrahedra tilt to adjust space laterally for the smaller A-site cation, which makes the layers corrugated and misalign. As a result, lattice leans slightly and the crystal structure loses all the threefold rotation axes (P
 $\bar 3$
m1 → C2/m,
 ${\bf a}_{\rm m}=2{\bf a}_{\rm t}+{\bf b}_{\rm t}\comma \; {\bf b}_{\rm m}={\bf b}_{\rm t}\comma \; {\bf c}_{\rm m}=2{\bf c}_{\rm t} $
) and mirror planes (C2/m → C2), leading to a monoclinic unit cell of C2. It should be noted that the SiO4 tilting starts every other interlayer space (Figure 6, SiO4 in yellow color). Similar structural aspect has been reported for an isostructural silicate (Ba0.65Ca0.35)2SiO4. Fukuda et al. (Reference Fukuda, Ito and Iwata2007) set the space group P
 ${\bar 3}$
m1, and identified that SiO4 tilted every other interlayer. In (Ba0.65Ca0.35)2SiO4, the position of the A-site cation in the distorted interlayer space was not definitely determined. This fact corresponds to the large atomic displacement parameter for A-site in the present case. As for the limiting case of x = 0, R
wp is still large even for a C2 model. Considering the Raman spectra, Sr3MgSi2O8 may have a lower-symmetry structure.
On the other hand, for x > 1, excess Ba2+ ions are forced to be placed at the layer-embedded B-site, which leads to an increase in the average size of B-site cations. Then, interlayer spaces linearly increase, because Si–O–B pillars elongate in response to the size increase. The P
 ${\bar 3}$
m1 (Z = 1) structure can accommodate the B-site cation enlargement until x = 2.375. However, this structure has inherent instability as is clear from the presence of an impurity phase (Figure 3). It is considered that the instability originates in two geometric factors: (i) size exclusion by pockets on the layer, and (ii) steric hindrance from dangling Si–O bonds. Since the former factor has been pointed out in my previous report (Yonesaki et al., Reference Yonesaki, Takei, Kumada and Kinomura2009), we treat the latter in this study. Focusing on the Si–O dangling bonds, their bond lengths (between 1.57 and 1.59 Å) are shorter than that expected from Shannon's ionic radii (1.66 Å) (Shannon, Reference Shannon1976). For Ba2.500Sr0.500MgSi2O8 (x = 2.500), the Si–O distance becomes much shorter (1.53 Å). This compression may be because of the capping by the adjacent B-site cation, considering the linear relationship between c
t and x (Figure 5). Above this limit, Si–O dangling bonds tilt to relax the steric hindrance [group (iii), Figure 6(c)]. Consequently, Ba
x
Sr3–
x
MgSi2O8 loses 2/3 of threefold axes and all the mirror planes, leading to the formation of P
 ${\bar 3}$
structure with Z = 3.
V. Conclusion
Ba
x
Sr3–
x
MgSi2O8 structure change caused by Ba/Sr replacement has been traced using Raman spectroscopy and X-ray powder diffraction. The solid solution series has layered glaserite-type structure in which larger Ba2+ ions preferentially occupy interlayer A-site. As for BaSr2MgSi2O8, since the ratio of the number of A-site to that of B-site is 1:2, Ba2+ and Sr2+ occupy A- and B-sites, respectively. In the case of x < 1, the average size of A-site cations is smaller than Ba2+, because Sr2+ ions replace Ba2+ at A-site. In an extreme case of x
 $ \,\leq\, $
0.5, SiO4 tetrahedra tilt to fit the smaller A-site cations, and the layers made of corner-sharing SiO4 tetrahedra and MgO6 octahedra become corrugated. As for the case of x
 $ \,\geq\, $
1, that is, Ba:Sr ratio exceeds that of A-site:B-site, the average size of B-site cations becomes larger than Sr2+ because excess Ba2+ ions are forced to be placed at B-site. However, the size mismatch between the enlarged B-site cations and B-site spaces results in the formation of BaMgSiO4 and in SiO4 tilting.
ACKNOWLEDGEMENT
The author, Y. Yonezaki is indebted to the financial support for the present research by Nippon Sheet Glass Foundation for Materials Science and Engineering.
SUPPLEMENTARY MATERIALS AND METHODS
The supplementary material refered to in this paper can be found online at journals.cambridge.org/pdj.