

1. Introduction
This paper explains why the revolving door generates inequality of influence between firms and creates economic distortions. We show that big financial companies, especially those denoted “too-big-too-fail”, can afford to hire many previous regulators, denoted as “revolvers,” and benefit from this strategy, while small firms in the same sector cannot afford it. The disparity and unequal competition in the numbers of revolvers are what this paper analyzes.
In the last decade, the “revolving door” phenomenon – defined as such when the heads of state agencies, after completing their bureaucratic terms, enter the very sector they have regulated – has intensified, and has been widely documented as having negative effects on the economy.Footnote 1 Zingales (Reference Zingales2017) stresses that inequality in power among firms is a main problem in the economy, and he asserts that one of the main channels for the connected firms to acquire power is by using the revolving door. In the same spirit, an OECD report (2009) claims that the revolving door is one of the major causes of the 2008 crisis, due to conflicts of interest and connections between the highest levels of governments and private financial groups.
This paper focuses on the differences between firms in their capacity to hire revolvers and in the resulting distortions in the economy. It finds an echo in the empirical literature on the gap between state-connected and unconnected firms, and its consequences on productivity, public procurement, and tax exemptions.Footnote 2
In fact, a large span of this literature is based on the well-known regulatory capture channel, which occurs when a regulator is “captured” by one specific firm, and while she is strict with the others, she is lenient with this firm.Footnote 3 This capture mechanism has been summed up by Laffont and Tirole (Reference Laffont and Tirole1996): “Monetary bribes are feasible, although not common due to their illegality. More pervasive are the hoped-for future employment for commissioners and agency staff with the regulated firms.” In other words, the revolving door could be a convenient vehicle for corrupt deals, leading to lenient regulations, and in turn to public resource misallocation. Yet it is difficult to believe that the revolving door, which is so much in use around the Western world, is related to unlawful behavior.
This paper takes a different approach: first, it analyzes the practice of the revolving door in a legal environment, and focuses on the differences of behavior between firms. The revolving door in our approach is related to rent seeking, and represents an unethical yet legal behavior. Then we focus on differences of behavior between big and small firms in the financial sector, by introducing a specific financial market imperfection induced by “too-big-to-fail” financial firms.
Since our paper focuses on the financial sector, let us give some examples of unethical yet legal behavior in this sector. As stressed by the media, the financial industry was prone to multiple revolving door scandals.Footnote 4 Some big financial firms have been found to use the revolving door to influence the legislative process: the formulation and enforcement of financial regulations and policies.
First, there are examples of firms with an influence over the legislative process and the formulation of regulations. Ban and You (Reference Ban and You2017) find that during the Dodd–Frank Act's rulemaking process, comments from financial firms that had hired former employees of the Securities and Exchange Commission (SEC) were more likely to be cited in the Act's final rule than firms that had not.
Second, on the influence of the revolving door on enforcement, a report from the SEC's Inspector General David Kotz pointed out the undue influence that former SEC officials working for financial firms exerted on SEC's actions in order to slow down or short-circuit investigations following the 2008 financial crisis.Footnote 5 These examples stress that due to the revolving door, the financial sector is particularly prone to unethical behavior.
In this paper, we first present a theoretical model explaining why some financial firms derive influence through the revolving door, by the creation and accumulation of “bureaucratic capital.”Footnote 6 It is a legal but unethical behavior.
The regulators and the regulated firms behave legally but unethically in the following way: regulators create during their public office a specific capital, a mix of human and social capital known as “bureaucratic capital.” Bureaucratic capital is the specific knowledge on over-complex or ill-designed regulations created by the regulator, and the “special relationships”Footnote 7 with the government and peer bureaucrats she has built during public office. As the architect of these regulations, the regulator has indeed inside knowledge of the system, including any loopholes that might exist, and is connected to key individuals and offices of the public administration. This knowledge and these connections are valuable to firms in the industry and to the regulator, but they are highly unethical.Footnote 8 Bureaucratic capital therefore enables, in a legal way, the bureaucrat to cash in later thereon, after exiting the public sector and passing the revolving door, and the firm to alleviate the regulatory constraint.
Then, in our theoretical settings, firms are not equal in their capacity to accumulate bureaucratic capital, since big financial firms face a lower cost of capital than small firms. This is due to the externality of the “run on the bank.” Indeed, in the financial sector, there is the risk that the collapse of a big firm will lead to a “run on the bank,” and it is common knowledge that the government will bail out “too-big-to-fail” firms. This feature has been internalized by financial markets, which, as a result, reduce the risk premium of big firms.
We show that this capital market imperfection has the consequence that large financial companies can afford to hire many revolvers and benefit from their bureaucratic capital, while small firms in the same sector cannot afford this strategy. Consequently, there is disparity in the levels of bureaucratic capital accumulated by large and small firms respectively, leading to inequality of influence and inequality in profits.
In the empirical part of the paper, using data on the US financial sector, we test the prediction according to which bureaucratic capital tends to be allocated toward a small number of large firms, through the revolving door. First, we develop indices measuring the inequality of influence resulting from the disparate allocation of bureaucratic capital among top 20 “diversified banks.”Footnote 9 The first measurement is a normalized Herfindahl index that measures the concentration of bureaucratic capital among firms in the same sector. The second one is a ratio index measuring the share of bureaucratic capital accumulated by the top quintile banks. We find that firms in the top quintile concentrate 80% of all the movements of revolvers between public agencies and private offices. Counting in terms of years of revolvers' public sector experience, one bank, Goldman Sachs, has accumulated 698 years of revolvers' public sector experience.Footnote 10
In a second step, we proceed to a multivariate econometric analysis of bureaucratic capital allocation and show that revolvers who held prominent positions in public office, especially in key regulatory agencies, and revolvers with longer experience in the public sector are more likely to be hired by the top five banks. In conclusion, our result strongly supports the presence of an inequality of influence between big and small financial firms.
The paper is divided into four sections. In section 2, we present the model. In section 3, we perform an empirical analysis of bureaucratic capital allocation among firms in the US financial sector. Section 4 concludes.
2. The model
Introduction
The “revolving door” phenomenon is related to the passage of the regulators from regulatory agencies to the regulated private sector, and vice versa. The theoretical model hereafter presented provides a rationale for this phenomenon by developing the concept of “bureaucratic capital.” Indeed, the revolving door allows regulators (i.e. “revolvers”) to supply bureaucratic capital, created during their public tenure, to regulated firms. This model sets a theoretical foundation for the measurements of bureaucratic capital accumulation and the inequality of influence among financial firms, which we present in the empirical part.
Although the model we propose could be easily generalized to other sectors in which the revolving door is also a common practice – such as the pharmaceutical, telecommunication, and defense sectors – the model we develop is tailored to analyze the financial sector by focusing on a more specific financial market imperfection induced by too-big-to-fail financial firms, as we present below.
It should be noted that in our paper, the creation of bureaucratic capital by regulators is the explanation for the existence of the revolving door, and it is a justification for this behavior, without introducing some illegal actions, as in other frameworks. Bureaucratic capital comprises “legal” actions by the regulator that give her a “value added” to be hired hereafter. In other words, in this paper, bureaucratic capital is a mix of social and human capital created by regulators during public office, in the form of networking, red-tape creation, inside knowledge of regulation design and implementation, and so on. In return, this knowledge of regulations and these connections within regulatory agencies are valuable to the firm in the very industry in which the revolvers had regulatory powers. In fact, the revolver knows how to pass through complex regulations, and to receive a VIP service by being in touch with her previous colleagues, who are still in the regulatory agency. This bureaucratic capital is particularly valued at Wall Street, as evidenced by the high salaries or bonuses for those passing the revolving door,Footnote 11 but also in the financial industry of other industrialized economies.Footnote 12
Therefore, the originality of this model is that it highlights a motivation for a firm to hire a former regulator at a higher salary than he had been paid in the public sector. It happens because firms are better off by acquiring the bureaucratic capital the revolver has created; which in turn, allows the latter to cash in on this bureaucratic capital after leaving the public service. In consequence, the model of bureaucratic capital, in a general equilibrium context à la Romer, can explain why homogeneous firms will agree to pay rents to hire former regulators, without any illegality or wrong-doing.Footnote 13
In this paper, we do not develop a whole model of general equilibrium but focus on the differences in bureaucratic capital accumulation between big and small firms in the financial sector. More specifically, this model explains why bureaucratic capital may be concentrated among few firms, and stresses the conditions under which the revolving door generates distortions.
The reason for these differences is that financial firms, which are too big to fail, take advantage of a lower cost of capital due to the externality of the run on the bank. Indeed, there is the risk of run-on-the-bank contagion if one big firm collapses. This risk makes “too-big-to-fail” firms very likely to be bailed out by the government in case of financial distress. This feature has been internalized by financial markets, and as a result, big financial firms face a lower cost of capital than small firms.Footnote 14
It is this difference in the cost of capital between the “too-big-to-fail” financial firms and the rest of the sector that, in our model, leads to an equilibrium with a different amount of revolvers and profits between big and small firms.Footnote 15
Moreover, in our model, we assume that the financial sector produces financial intermediation services (i.e. intermediate services and goods) in a monopolistic competition environment (as in Romer, Reference Romer1990), therefore requiring regulation.Footnote 16 In what follows, we present the model: the supply of bureaucratic capital comes from the regulators, while the demand comes from the firms. We begin by presenting the supply of bureaucratic capital by the regulator.
The supply of bureaucratic capital by the regulator
This model focuses on the financial sector, in which top agency regulators, after their term in public office, are invited to work in a company they have regulated.
During her time in office, the regulator fulfills her public responsibilities, but at the same time, she develops bureaucratic capital. As explained above, the bureaucratic capital is all the red tape and the connections within regulatory agencies that she is developing. One unit of bureaucratic capital can be understood as one piece of red tape, or one personal connection. The regulator decides the optimal amount of bureaucratic capital she wants to develop, that will cost her effort, but will permit her to get a higher income in the future.
The structure of the model is simple. During her term as a regulator for T years, each year, she acquires bureaucratic capital, which costs her effort of sizeE i, each year. These costs are mainly in the form of investing in networks, creating red tape, and building influence, since these actions require effort.Footnote 17
The amount of bureaucratic capital created each year by E i units of effort per year, is monotonically increasing and concave in the total amount of effort expended during that year, and is a differentiable variable, which takes the functional form of: [(1 + γ)E i]1/1+γ γ > 0.Footnote 18
This rate of accumulation is constant over the regulator's term T, so that, at the end of the term, the total amount of bureaucratic capital created by regulator i is:Footnote 19
 $$H_i(E_i) = T[(1 + \gamma )E_i]^{1/1 + \gamma }\quad \gamma \gt 0, $$
where γ represents the institutional constraints over bureaucratic capital creation during public office.
After leaving her job as regulator, the bureaucrat works for a period of length τ in the industry that she has regulated. She receives, on top of her “regular” salary, a rent related to the bureaucratic capital H i that she has accumulated.
The regulator maximizes her lifetime income which consists of (1) earnings which are not related to the creation of bureaucratic capital, denoted by Ω, and (2) income related to the creation of bureaucratic capital, which equals the net income she gets on entering the industry, after passing through the revolving door. She will be able to sell her bureaucratic capital, H i at price q for a number of years τ so that her total income is:
 $$V_i = \Omega -{\kern 1pt} {\kern 1pt} T{\kern 1pt} E_i + \tau {\kern 1pt} qH_i(E_i)\quad $$
Equation (2) can be rewritten as a function only of the level of bureaucratic capital, by substituting E i from equation (1). We get:
 $$V_i = \Omega -\,{\kern 1pt} \displaystyle{{H_i^{1 + \gamma}} \over {(1 + \gamma )T^\gamma}} + \tau {\kern 1pt} qH_i\quad$$
From the point of view of the bureaucrat, there is an optimal level of bureaucratic capital  $\hat{H}$ that maximizes her income – equation (3) and is:
 $$\hat{H}_i = T(\tau \,q)^{1/\gamma} $$
Equation (4) describes the “supply” function of bureaucratic capital by the regulator as an increasing function of the price q. The numbers of years worked in the public agency, as well as in the private sector both have a positive effect on the amount of bureaucratic capital. We now turn to discuss the behavior of the firms and their demand for bureaucratic capital.
The demand for bureaucratic capital
The financial sector is composed of financial firms producing intermediate goods and services, in a monopolistic, competitive environment.Footnote 20 While Romer (Reference Romer1990) develops a model of general equilibrium for the whole economy, in this paper we focus on the financial sector. A special feature of the financial sector is that financial firms are not all equal: some are big, and therefore have a lower cost of capital than small firms, as we have explained above.
In this model, there are N financial firms, consisting of n b big firms, and n s small firms, respectively producing the intermediate goods x b and x s. These intermediate goods enter the production of a final good Y in the following form (based on Romer, Reference Romer1990):
 $$Y\, = \,\Delta + \;L_y^{1-\alpha} (\sum\limits_0^{n_b} {x_b^\alpha} + \sum\limits_0^{n_s} {x_s^\alpha} )\quad \quad \alpha \gt 0, $$
where Y is the total output in the economy, Δ the output of the economy not related to the financial sector; and L y the workers in the economy who are not working in Δ; x b and x s are the intermediate financial goods used in the production of Y. While the intermediate services sector consists of monopolistic firms, the final good is produced in a perfect competitive environment. The firms involved in producing Y are maximizing profits:
 $$Max\,\;L_y^{1-\alpha} (\sum\limits_0^{n_b} {x_b^\alpha} + \sum\limits_0^{n_s} {x_s^\alpha} )-w_yL_y-\sum\limits_0^{n_b} {\,p_bx_b^{}} -\sum\limits_0^{n_s} {\,p_sx_s^{}} $$
where w y are the wages paid for labor, p b and p s are the prices of the intermediate services x b and x s. From the profit maximization in the production sector, we get:
 $$p_b = \alpha {\kern 1pt} {\kern 1pt} L_y^{1-\alpha } x_b^{\alpha -1} \; {\rm for}\,{\rm all}\,b\in \,{\kern 1pt} [{\kern 1pt} 0,n_b]$$
 $$p_s = \alpha {\kern 1pt} L_y^{1-\alpha } x_s^{\alpha -1} \; {\rm for}\,{\rm all}\,s\in \,[0,n_s]$$
We focus on the production of the intermediate goods and services, x b and x s. Following Romer (Reference Romer1990) and Brezis (Reference Brezis2017), we assume that these firms are producing their goods using capital k. But physical capital is not the only factor affecting production; the amount of bureaucratic capital also affects the output of the firms, and in a positive way.
However, let us emphasize that if all similar firms have the same amount of bureaucratic capital, then bureaucratic capital is useless for the firm.Footnote 21 This assumption stems from the rent-seeking arguments according to which the revolving door does not lead to an increase in production due to improved productivity but due to rent seeking.Footnote 22 If bureaucratic capital was a productivity factor, it would increase firm j’s production, whatever stock of bureaucratic capital was accumulated by its competitors.
As a reminder, there are two different sizes of firms, and as explained in Appendix A (available online),Footnote 23 the output of the firms can be described in the following way:
 $$x_b = [k_b + (\displaystyle{{{\bar{H}}_b} \over {{\bar{H}}_s}})^{\mathop \mu \nolimits^{}} ](\displaystyle{{H_b} \over {{\bar{H}}_b}})^{\mathop \phi \nolimits^{}} \quad \phi \gt 0,\quad \mu \gt 0 $$
 $$x_s = [k_s + (\displaystyle{{{\bar{H}}_s} \over {{\bar{H}}_b}})^{\mathop \mu \nolimits^{}} ](\displaystyle{{H_s} \over {{\bar{H}}_s}})^{\mathop \phi \nolimits^{}} \quad \phi \gt 0, \quad \mu \gt 0 $$
where H b and H s are the level of bureaucratic capital demanded by big and small firms respectively; and  $\bar{H}_b$ and
 $\bar{H}_s$ are the average level of bureaucratic capital owned by the other big and small firms respectively. In other words, we divide the total rent-seeking effect into two elements: the first one is the amount of bureaucratic capital of the firm relative to the amount in its own group, and the second one is the relative amount of its group as compared to the other group. In what follows, we detail profit maximization by big and small firms respectively.
The small firms
All firms maximize profits. Let us analyze first the small firms producing x s. The profit maximization for an intermediate financial firm s is:
 $$Max\,\,\pi _s = p_s(x_s)x_s-rk_s-qH_s, $$
where r is the cost of capital in the market; and q the cost of bureaucratic capital. qH s is the remuneration related to bureaucratic capital obtained by the bureaucrat for being hired by the firm. Each firm maximizes profits by finding the optimal amount of factors of production. We substitute k s, and equation (11) can be rewritten in the following way:
 $$Max\,\pi _s = p_s(x_s)x_s-r_{}[x_s(\displaystyle{{H_s} \over {{\bar{H}}_s}})^{-\phi} -(\displaystyle{{{\bar{H}}_s} \over {{\bar{H}}_b}})^{\mathop \mu \nolimits^{}} ]-qH_s $$
The two first-order conditions for maximizing profits are:
 $$p^{\prime}_s(x_s)x_s + p_s(x_s)-r(\displaystyle{{H_s} \over {{\bar{H}}_s}})^{-\phi} = 0 $$
 $$q\bar{H}_s = \phi {\kern 1pt} \,r_{}{\kern 1pt} x_s(\displaystyle{{H_s} \over {{\bar{H}}_s}})^{-\phi -1} $$
From equation (8), we note that the demand elasticity of p s(x s) is equal to α-1. Substituting into equations (13) and (14), in a symmetric equilibrium where all H s are the same, we get:
 $$p_s = \displaystyle{{r} \over \alpha} \quad $$
and the demand function for H is:
 $$H_s = \bar{H}_s = \displaystyle{{\phi {\kern 1pt} rx_s} \over q} = D_s $$
Now we turn to analyze the big firms.
The big firms
The big firms' access to financial markets is affected by their size. As emphasized in the literature presented above, big firms face a lower cost of capital due to the “too-big-to-fail” externality. In consequence the cost of capital, r b, is lower for these “too-big-to-fail” firms than the regular cost of capital r, and we denote that: r b = r/β β > 1.
In consequence, the profit maximization for big financial firms b producing x b is:
 $$ Max\,\pi _b = p_b(x_b)x_b-r_bk_b-qH_b $$
where r b is the cost of capital k b; and q the cost of bureaucratic capital. As in the previous case, the two first-order conditions for maximizing profits are:
 $$p^{\prime}_b(x_b)x_b + p_b(x_b)-r_b(\displaystyle{{H_b} \over {{\bar{H}}_b}})^{-\phi} = 0 $$
 $$q\bar{H}_b = \phi {\kern 1pt} \,r_b{\kern 1pt} x_b(\displaystyle{{H_b} \over {{\bar{H}}_b}})^{-\phi -1} $$
and we get:
 $$p_b = \displaystyle{1 \over \alpha} r_b\quad $$
 $$H_b = \bar{H}_b = \displaystyle{{\phi {\kern 1pt} r_bx_b} \over q} = D_b $$
In Appendix A,Footnote 24 we show that the demand for small and big firms – equations (16) and (21) – can be rewritten in the following form:
 $$H_s = \bar{H}_s = \displaystyle{{\phi {\kern 1pt} r\beta ^{1/\alpha -1}\,K} \over {nq}} = D_s $$
 $$H_b = \bar{H}_b = \displaystyle{{\phi {\kern 1pt} rK} \over {nq\beta}} = D_b $$
where n = n b + n s β 1/α−1. In consequence, the ratio of bureaucratic capital in small and big firms is:
 $$\displaystyle{{H_s} \over {H_b}} = \delta \; \lt 1\quad where\;\delta = \beta ^{\alpha /\alpha -1} \le 1 $$
Equations (22) and (23) represent the demand for bureaucratic capital, as a decreasing function of q, for both types of firms. The ratio of bureaucratic capital in small and big firms is given by equation (24). For big firms, the equilibrium bureaucratic capital is H 1*, while for small firms, the equilibrium is given by H 2* which is lower than H 1*. Moreover, substituting prices and quantities into the profits, we get:
 $$\pi _b = \displaystyle{{rK} \over {n\beta}} [\displaystyle{1 \over \alpha} -1-\phi ] + \displaystyle{r \over {\beta \delta ^\mu}} $$
 $$\pi _s = \displaystyle{{rK\beta ^{1/\alpha -1}} \over n}[\displaystyle{1 \over \alpha} -1-\phi ] + r\delta ^\mu $$
We therefore get the following proposition:
Proposition
1. The amount of bureaucratic capital of small financial firms is lower than the amount for big, and especially “too-big-to-fail”, firms, and the ratio is presented in equation (24).
2. Through bureaucratic capital accumulation, big firms maintain their profits at a higher level than small firms.
To conclude this section, this model of bureaucratic capital emphasized two main facets related to the revolving door. The first one is that differences between firms due to their size and hence their costs of capital lead to major differences in their behavior. Big firms can hire many revolvers and be state-connected, while small firms cannot hire many revolvers and in consequence they are less connected, if at all. These differences in the revolving door lead to differences in profits between them. In other words, “too-big-to-fail” firms maintain their profits and market power via the revolving door, and not through efficient decisions. Therefore, the revolving door process leads to distortions in the economy.
The second facet is that this model also sets a theoretical foundation for the measurement of bureaucratic capital supply at regulator level, and bureaucratic capital accumulation at firm level, which, in fine, frames the empirical analysis of bureaucratic capital allocation and of the resulting inequality of influence among financial firms, as we present in the next section.
3. Empirical analysis
This section presents an empirical analysis of bureaucratic capital allocation among big and small financial firms, which tests Proposition 1 from the previous section. In a first step, we present a novel database on the revolving door and bureaucratic capital in the US financial sector, and propose measurements of the inequality of influence resulting from bureaucratic capital allocation. In a second step, we conduct simple tests on the relationship between bank size and bureaucratic capital accumulation. In the last step, we proceed to a multivariate econometric analysis of the probability of the largest bureaucratic capital suppliers – that is, the most experienced or prominent regulators –being hired by the biggest banks.
Descriptive evidence on bureaucratic capital destination and origin
As Zingales (Reference Zingales2015) points out, the political power of modern corporations results from the interaction of concentrated economic power with politics. One way to grasp the extent of the regulatory power of financial firms engaged in the revolving door would hence consists of focusing on the concentration of bureaucratic capital among the biggest financial firms. To this purpose, we gathered data on the career path of regulators, i.e. revolvers that undertook public-to-private or private-to-public sector movements between the top 20 US “diversified banks” and US regulatory agencies. We put the emphasis on the diversified banking sector rather than the whole financial industry, because different types of financial firms – e.g. diversified banks, investment banks, or insurance companies – may be subject to different regulations and incentives, and hence might not fully compete with each other.Footnote 25 Appendix B onlineFootnote 26 provides information on the data collection and treatment processes. Building on this information, we constructed four proxies of the stock of bureaucratic capital accumulated by banks:
(1) Proxy 1, “revolvers”: the number of revolvers that have been hired by banks.
(2) Proxy 2, “movements”: the cumulated number of public-to-private sector and private-to-public sector revolving door movements undertaken by revolvers hired by banks.
(3) Proxy 3, “prominence”: the number of revolvers who obtained a prominent position in a public agency (see Appendix B online for the list of prominent positions considered).
(4) Proxy 4, “experience”: the total number of years of experience in the public sector accumulated by revolvers hired by banks.
Looking at the revolving door in the 20 biggest US diversified banks, we identified 304 revolvers, among which 155 are considered as prominent. These revolvers have undertaken 384 revolving door movements between public and private positions and vice versa, mostly undertaken between 1960 and 2015, corresponding to a total of 2,256 years of experience in public office. Appendix CFootnote 27 provides information on the distribution of revolvers among firms by regulatory agencies.
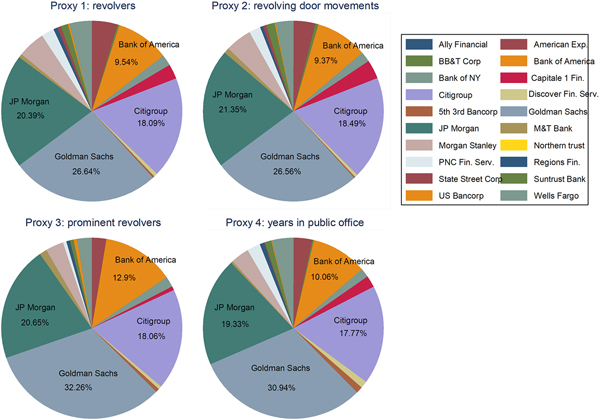
Figure 1 represents the distributions of the four bureaucratic capital proxies in the various banks. In general, the data show that more than three-quarters of the bureaucratic capital stock is concentrated in the five biggest banks (Goldman Sachs, JP Morgan, Citigroup, Bank of America, and Wells Fargo), including 79% of the total number of revolvers (proxy 1), 79% of revolving door movements (proxy 2), 86% of the total number of prominent revolvers (proxy 3), and 82% of the revolver's years of public sector experience (proxy 4). Among these five banks, Goldman Sachs takes the lion's share of the bureaucratic capital allocation.
Sector distribution of bureaucratic capital among the top 20 diversified banks

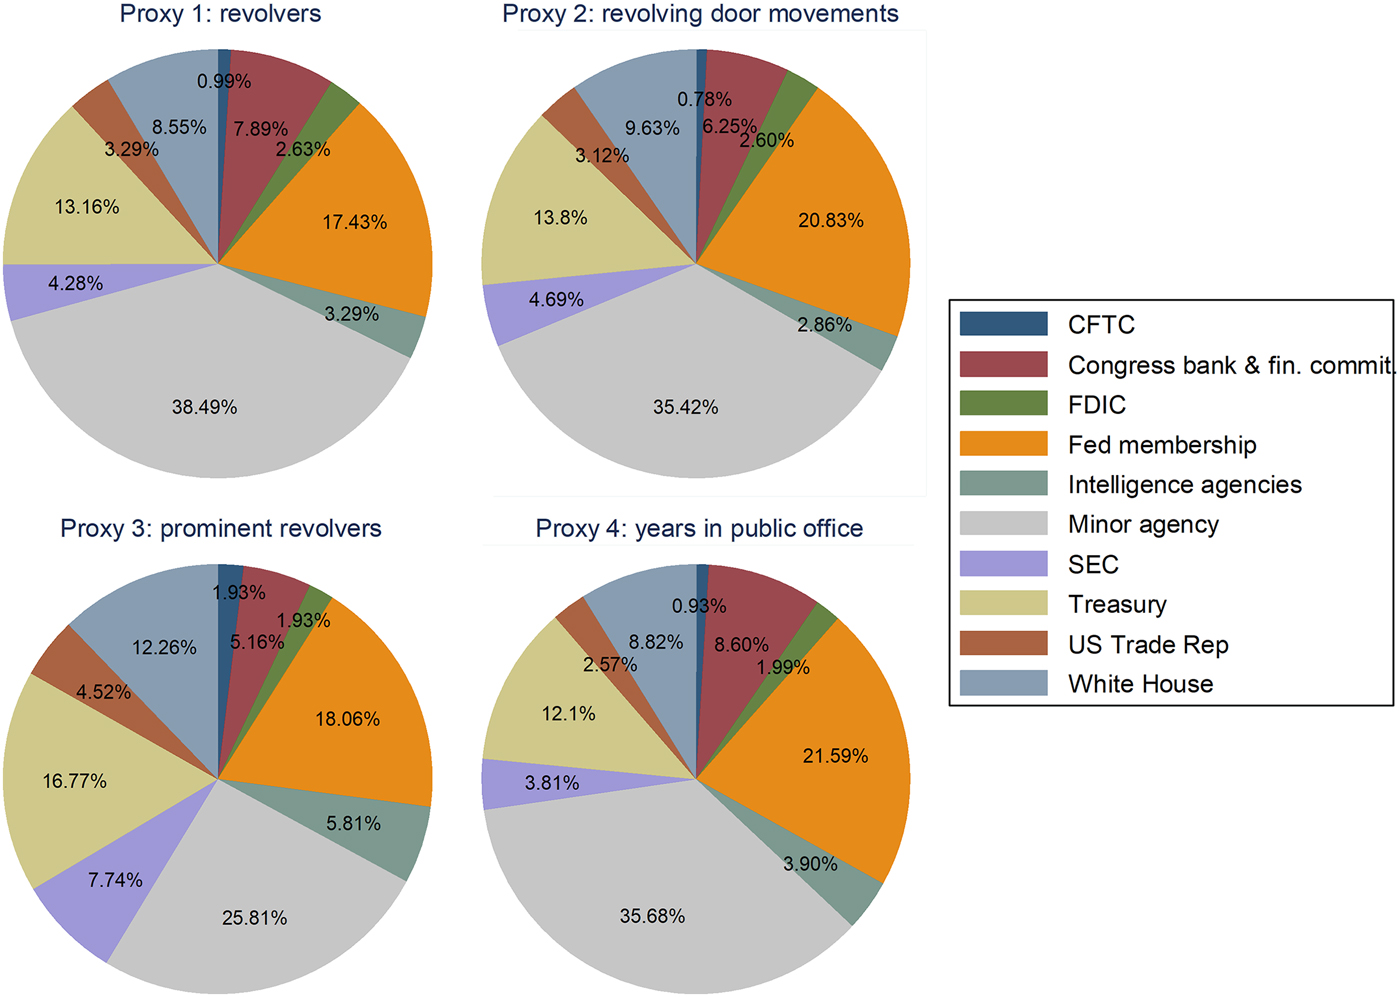
Among the 304 revolvers identified, 187 revolvers worked in the nine key regulatory agencies directly related to the regulation of the financial sector or with strong influence over it.Footnote 28 The remaining 117 revolvers worked in agencies not directly related to financial matters such as congressmen's offices (most of them), the Internal Revenue Service, the Department of Defense, the Department of State, embassies, governorates, and so on.
Figure 2 represents the distribution of bureaucratic capital according to its agency of origin, and shows that the Fed, the Treasury, and the White House represent around 40–50% of bureaucratic capital origin: that is, 39% of the total number of revolvers, 44% of revolving door movements, 47% of prominent revolvers, and 42% of public sector experience (in years).
Distribution of bureaucratic capital among public agencies

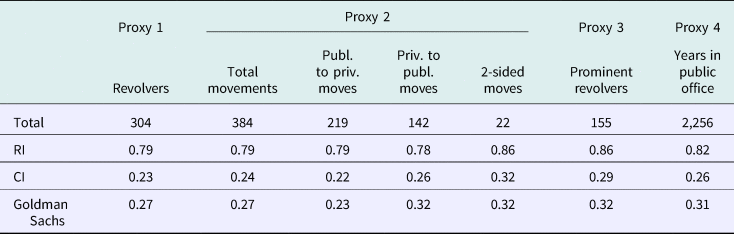
To get a more striking view of bureaucratic capital concentration among diversified banks, in Table 1 we report two key synthetic indexes. First, we report the Ratio Index (RI), which is the share of bureaucratic capital cumulated by the top five banksFootnote 29 in the total stock of bureaucratic capital cumulated by the top 20 diversified banks, using the four proxies of bureaucratic capital. Second, we report a second index, denoted as Concentration Index (CI), derived from a normalized Hirschman–Herfindahl index formula and computed using the four proxies of bureaucratic capital.Footnote 30 The RI and CI both measure the inequality of influence, since the higher the index, the stronger the concentration of bureaucratic capital, the greater the inequality of influence in the financial sector. These indices do not measure all the possible negative effects of the revolving door; they specifically focus on the differences between firms hiring many former regulators, and those without revolvers. In other words, these metrics focus on the disparity between connected and less connected firms stemming from the revolving door phenomenon.
The inequality of influence in the US banking sector.

The RI shows that Goldman Sachs, JPMorgan, Citigroup, Bank of America, and (to a lesser extent) Wells Fargo comprise together 79% of revolvers and total revolving door movements, 86% of prominent revolvers and two-sided movements (back-and-forth movements between the same agencies or the same banks), and 82% of the total stock of years of public office experience (see Table 1).
On the concentration of bureaucratic capital, we find that the index is equal to 0.23 when using the number of revolvers (proxy 1), 0.24 for the number of revolving door movements (proxy 2), and 0.26 for the number of years worked in the agency (proxy 4).Footnote 31
Among these 20 firms, Goldman Sachs appears as the prime beneficiary of bureaucratic capital accumulation, concentrating 27% of the total stock of revolvers (proxy 1) and revolving door movements (proxy 2), 32% of prominent revolvers (proxy 3), and 31% of the cumulated years of public office experience (proxy 4).
Next, in Table 2, we measure the concentration of revolvers among firms according to their public agency of origin. Focusing on key regulatory agencies, as defined above, we found a strong concentration among the “big five” of bureaucratic capital created at the White House. Indeed, the CI rises dramatically to 0.39 and the RI indicates that 92% of the White House's revolvers have worked for the big five. The concentration of bureaucratic capital created at the Treasury is also strong, with a CI equal to 0.36 and a RI of 88% for the big five (43% for Goldman Sachs alone).
The inequality of influence in the US banking sector, by key regulatory agency.

By contrast, the Federal Reserve System, which provided the greatest number of revolvers, is associated with the lowest concentration of scores (CI of 0.24, and the RI is “only” 74%). Indeed, it is worth noting that regarding the revolving door from the Fed, there is more “equality” in the system, and a greater number of small firms can also hire revolvers from this agency.
On the other hand, we observe very high concentration patterns at the SEC, intelligence agencies, and the CFTC – agencies with great regulatory powers (CI of 0.43, 0.34, and 0.67 respectively). Therefore, while bureaucratic capital from these agencies is scarce, it seems highly valuable since almost all revolvers from these agencies end up in the big five.
To conclude this part, this statistical description has permitted us to measure the inequality of influence among firms, resulting from the concentration of revolving door movements. Most of the bureaucratic capital accrues to the five biggest diversified banks and a small residual amount of bureaucratic capital is spread among the remaining 15 banks. Among these five firms, Goldman Sachs is the main beneficiary of bureaucratic capital concentration, by accumulating around 30% of the bureaucratic capital stock, which corresponds, in terms of regulatory experience, to 698 years among a total of 2,256 cumulated years of public office experience.
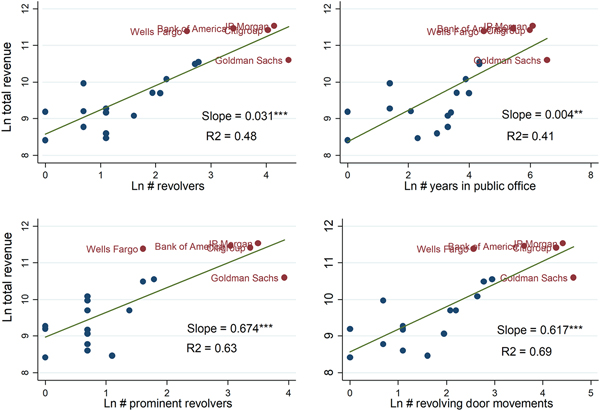
Figure 3 presents graphically the partial correlation between the four proxies of bureaucratic capital and bank size, measured by their total revenue in 2015. We find a positive and significant correlation between bureaucratic capital accumulation by firms and their size. Comparing the explanatory power of a univariate OLS regression of the bank size over the four proxies of bureaucratic capital, we find that this positive relationship gets stronger, as evidenced by the 0.63 and 0.69 R-squared, when bureaucratic capital is measured in terms of prominence in public office (proxy 3) or public office experience (proxy 4), respectively. Therefore, beyond the total number of revolver or revolving door movements, it is the prominence and experience of regulators that seems to matter particularly for big financial firms.
Bureaucratic capital and bank's total revenue

To conclude, this descriptive statistical analysis, conducted at the firm level, strongly supports the proposition of our model according to which big firms, with lower costs of capital, accumulate a greater stock of bureaucratic capital. We now present a multivariate analysis of bureaucratic capital allocation among the big five, which focuses on revolvers' public-to-private sector movements.
Multivariate analysis of bureaucratic capital allocation
One important prediction of our model is that too-big-too-fail firms are the principal destination of bureaucratic capital allocation, as in equation (24). In consequence, regulators completing their term in public agencies with lengthy experience in the public sector, or leaving a prominent position in public office, are more likely to be hired by big firms. Therefore, a higher amount of bureaucratic capital created in public office should increase the likelihood for the revolver of being hired by the biggest banks.
Econometric specification
To test our model, we first conduct a multivariate analysis of the effect of bureaucratic capital supplied by revolvers on the conditional probability of working in the top five banks after serving in a public office. First, we apply a logistic model to cross-section data on 219 public-to-private revolving door movements from public agencies toward the top-20 US diversified banks, with the dependent binary variable:
 $$h_i = \left\{ {\matrix{ 1 &{{\rm \;\ if\;\ the\;} i^{{\rm th}}{\rm \;\ revolver\;\ has\;\ been\;\ hired\;\ by\;\ a\;\ top\;} 5{\rm \;\ bank}} \cr 0 &{{\rm \;\ otherwise}} \cr}} \right.$$
The random variable h i takes the value one or zero, associated with the probability p i and (1 – pi) respectively. We assume that the logit of the probability p i is:
 $$Logit(\,p_i) = X_i^{\prime} \beta ,$$
where β is a vector of regression coefficients and Xi is a vector of covariates, which includes proxies of bureaucratic capital and other determinants of firm size.
Variable of interest: bureaucratic capital
More specifically, bureaucratic capital supplied by the revolver is proxied by either:
Model A1: using proxy 3, the revolver's position in public office (1 = prominent position; 0 = non-prominent position).
Model B1: using proxy 4, the revolver's experience in public office (in years).Footnote 32
Model C1: using proxies 3 and 4 together, to separate the effects of prominence from experience.
In a robustness check, we combine these proxies with information on the revolver's career in the key regulatory agencies, presented above, to test whether the effect of prominence or experience depends on whether the revolver has worked in a key regulatory agency or not. Proxies 3 and 4 are therefore decomposed in the following way:
Proxy 3a: prominent revolvers from key regulatory agencies
Proxy 3b: prominent revolvers from “other” regulatory agencies
Proxy 4a: experience in key regulatory agency
Proxy 4b: experience in “other” regulatory agencies.
In other words, prominent revolvers (proxy 3) are split between prominent revolvers who have worked in a key regulatory agency (proxy 3a), and prominent revolvers who have worked in any “other” public agency (proxy 3b). In the same way, the experience in public office (proxy 4) results from the experience of revolvers having worked in a key regulatory agency (proxy 4a), and from the experience of revolvers having worked in an “other” public agency (proxy 4b). Models A2, B2, C2 are then estimated proceeding to this decomposition, as follows:
Model A2: using proxy 3a and 3b.
Model B2: using proxy 4a and 4b.
Model C2: using proxies 3a, 3b, 4a and 4b together, in order to separate the effects of prominence from experience, and the effect of the agency of origin.
Controls
We take into account the possibility of bureaucratic capital depreciation, by controlling for the time gap (in years) between public sector exit and private sector entry. This variable is of interest since some regulations on the revolving door imposing a cooling-off period between public and private offices are based on the underlying assumption of bureaucratic capital depreciation.
We also control (1) for the logarithm of the number of employees – to ensure that public regulators do not go into the top five banks because these banks hire more people; and (2) for firm's long-run financial performance by including the 10 years' earning-per-share (EPS) annual change – to ensure that bureaucratic capital allocation is not affected by firms' long-run profitability but only by size.
Results
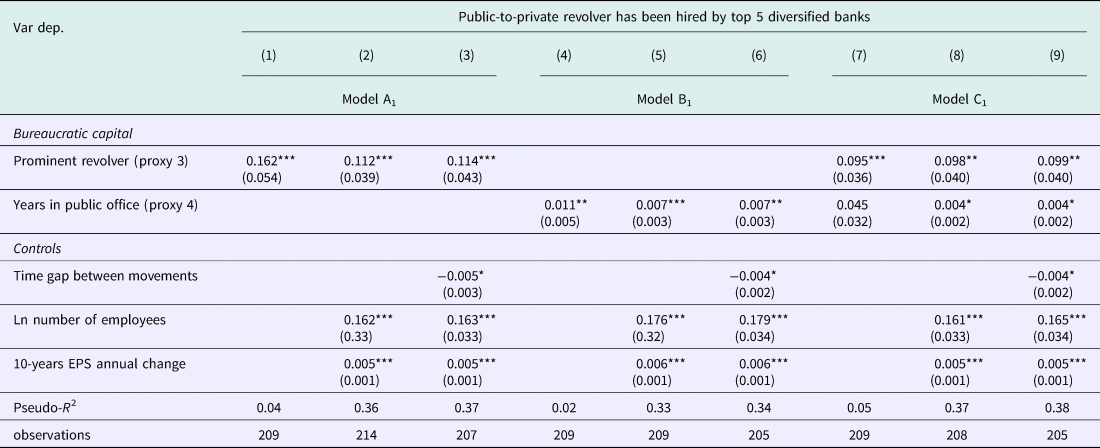
The main results are reported in Table 3. First, all models put in evidence a positive and significant effect of bureaucratic capital supply on the probability of being hired by the big five. Moreover, including the firms' determinants of total revenue (number of employees and financial performance) as controls affects the strength, but not the sign or the significance of bureaucratic capital proxies in the regressions (columns (2), (5), and (8)). In the same way, relationships are also robust to the inclusion of bureaucratic capital depreciation control (columns (3), (6), and (9)).
Empirical evidence from public-to-private revolving door movements, logit estimates (1/2).

Notes: Marginal effects reported, constant not reported. Standard errors are presented in parentheses: * significant at 10%, ** significant at 5%, *** significant at 1%. Standard errors are robust to heteroscedasticity
Second, estimates in column (3) stress that being a prominent revolvers increase by 11.4% the probability of being hired by one of the top five banks, while estimates in column (6) show that one additional year of public office experience increases this probability by 0.7%. Taking the two proxies together, estimates in column (9) support prominence having an effect independently of the effect of experience. Both effects are at least 10% significant, but the effect of prominence is found to be more significant than the effect of experience in public office.
Third, it is also worth noting that the time gap between public and private offices erodes bureaucratic capital accumulation. This gap is found to significantly reduce the probability of being hired by a top-five bank in models A1 (column (3)), B1 (column (6)), and C1 (column (9)), thereby giving an empirical justification to regulations on bureaucratic capital allocation such as cooling-off periods after leaving public office. Concretely, estimates support that adding one year to a cooling-off period after leaving public office would reduce the probability of being hired by the big five by 0.4%.
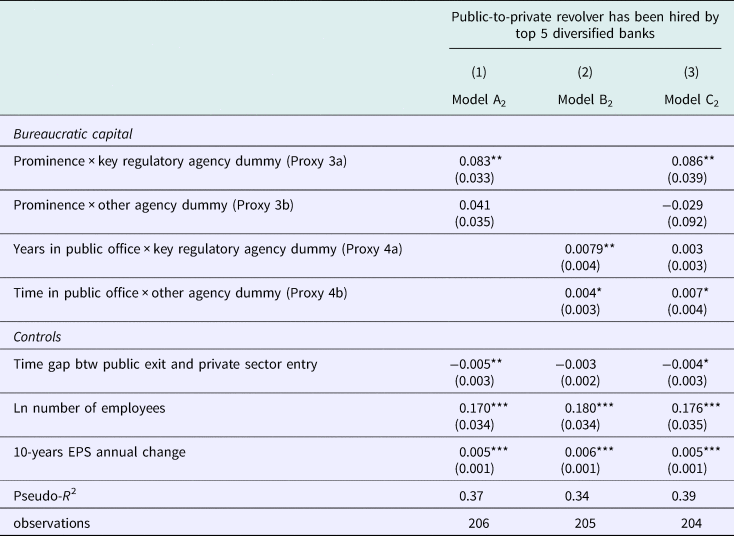
In a last step, we provide additional evidence on the effect of bureaucratic capital (i.e. prominence and/or experience in public office) by exploiting information on the revolvers who worked in a key regulatory agency. The probability of being hired therefore regresses over proxies 3 and 4, introduced separately (models A2 and B2) or together (model C2).
Results are presented in Table 4 and provide additional insights into how the revolving door from key regulatory agencies generates inequality of influence among banks, compared to the revolving door from “other” agencies. First, estimates of model A2 (column (1)) show that getting a prominent position in the public sector increases significantly the probability of being hired by one of the big five only if the revolver has worked in a key regulatory agency. Second, model B2 (column (2)) shows that, while experience is useful whatever the importance of the agency, it has a stronger and more significant effect when the revolver has worked in a key regulatory agency. Last, model C2 (column (3)) highlights that, including prominence and experience proxies together in the regression, the effect of the prominence of revolvers from key regulatory agencies prevails over the effect of experience from key regulatory agencies, and the effect of experience holds (in a 10% confidence level) in “other” public agencies only.
Empirical evidence from revolving door movements, logit estimates (2/2).

Notes: Marginal effects reported, constant not reported. Standard errors are presented in parentheses: * significant at 10%, ** significant at 5%, *** significant at 1%. Standard errors are robust to heteroscedasticity.
These results suggest that, in agencies with strong regulatory power over the financial sector, the prominence of revolvers matters more than their experience for being “bankable.” However, experience still has a positive but smaller effect on the probability of being hired by the top five when the revolver has worked in an “other” public agency.
To summarize, this section has provided evidence on the following facts: (1) around 80% of the bureaucratic capital stock is concentrated among the top five banks; (2) the top five banks are more likely to hire revolvers supplying greater amounts of bureaucratic capital – whether measured in terms of years of public sector experience or in terms of prominence in public office; and (3) the top five banks are mostly looking for prominent revolvers from key regulatory agencies, and in a lower extent, for experienced revolvers from “other” public agencies.
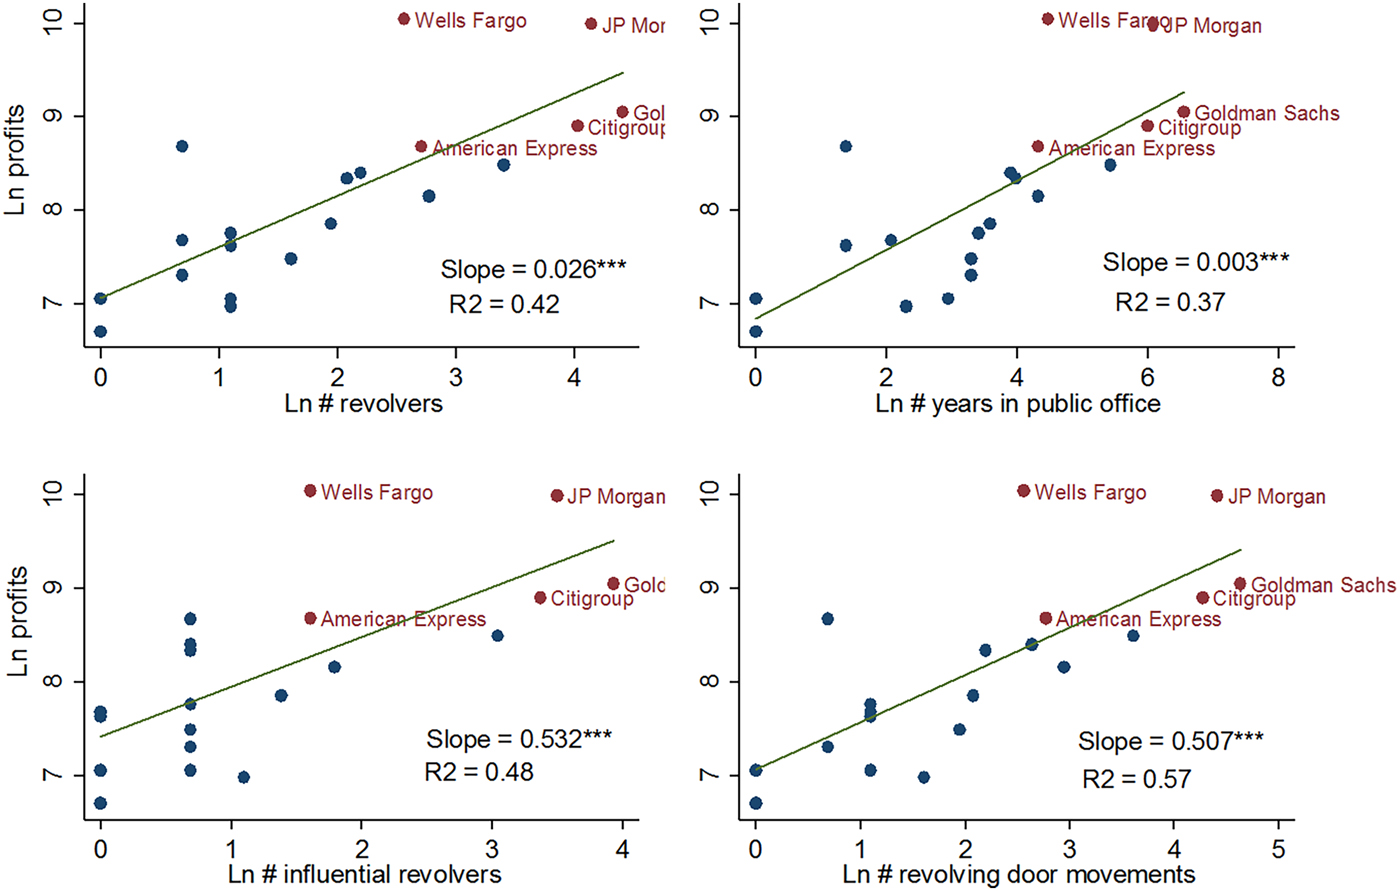
In conclusion, the data corroborates Proposition 1 of the theoretical model, as well as Zingales' (Reference Zingales2015) message that power and influence are not equal among financial firms. We also find that, as stated in Proposition 2 and shown in Figure 4, the profits of big and small firms are not equal. In brief, to paraphrase George Orwell, this empirical analysis has stressed that US financial firms “are equal but some firms are more equal than others.”
Bureaucratic capital and bank's profits

4. Conclusion
This paper shows how the revolving door phenomenon generates inequality of influence among firms. It stresses that firms are not equal in their capacity to accumulate bureaucratic capital. Big companies can afford to hire many revolvers and benefit from their bureaucratic capital, while small firms in the same sector cannot afford this strategy. This disparity and unequal distribution in the level of bureaucratic capital is what this paper analyzes.
We first develop a theoretical model setting a theoretical foundation for the measurement of bureaucratic capital accumulation, and explaining the inequality of influence among financial firms. Owing to unequal access to financial markets linked to a “too-big-to-fail” externality, revolvers supply bureaucratic capital mostly to a small number of large firms. This bureaucratic capital enables the largest firms to derive influence over public decision-making and to maintain their dominant position.
In the second part of the paper, the model's prediction that bureaucratic capital is allocated toward the biggest financial firms is tested, using a new database that tracking the revolving door process and involving 304 revolvers hired by the 20 biggest US diversified banks. We show that regulators who have created much bureaucratic capital are more likely to be hired by the top five banks after leaving public office.
We also developed indices of the inequality of influence: the Ratio Index (RI) and the Concentration Index (CI), a Herfindahl index of the sectorial concentration of the revolving door process. These indices enable the concentration of influence induced by the revolving door to be measured. Our results show that the top five banks represent 80% of revolvers and revolving door movements, 86% of revolvers who held prominent positions in the public administration, and 82% of the total years spent by revolvers in public office. Goldman Sachs appears to be the prime beneficiary of this process, capturing nearly 30% of total revolvers, revolving door movements, and time in public office, thereby accumulating 698 years of influence in public office.
The model and the empirical analysis presented in this paper may also be useful to design effective policies aimed at preventing bureaucratic capital concentration. They may also be used to raise awareness of the need for institutional safeguards against the overwhelming influence of “too-big-to-fail” banks over financial regulations.
Acknowledgments
This research was supported by the Aharon Meir Center for Banking and Economic Policy, the French Agence Nationale de la Recherche (ANR) and the Ferdi (Fondation pour les Etudes et Recherches sur le Développement International) through the program “Investissements d'avenir” (ANR-10-LABX-14-01). We are grateful to Janos Bartok, Gonzalo Caballero, François Facchini, Vincenzo Galasso, Bernard Gauthier, Martin Gassebner, Nicolas Gavoille, Jacob de Haan, Jesper Johnson, Florian Léon, Frederic Lesné, Christian Lessmann, Catherine L. Mann, Marc Sangnier, Norman Schofield, Benjamin Williams, as well as participants at the U4-Proxy Challenge Competition, the European Public Choice Society meeting, the CESifo workshop on Political Economy, and the ICOPEAI conference, for their valuable comments. We are grateful to the three referees and the editor for their useful comments. We thank Gina Li and Hoa Duong for excellent research assistance.
Author ORCIDs
Elise S. Brezis http://orcid.org/0000-0002-7954-8110; Joël Cariolle http://orcid.org/0000-0001-7292-9829