This note investigates the sources of variation in the growth of per capita personal incomes across U.S. states during the Great Depression.1
See Heim, “Uneven Impacts,” for a survey of the literature on differences in economic performance across industries, regions and nations during the Great Depression.
Annual estimates of state per capita incomes for 1929–1939 were produced in the 1950s by Charles F. Schwartz and Robert E. Graham using various industrial censuses and other sources of data for specific industries and income components. In the absence of consistent annual state-level data on income components, Schwartz and Graham resorted to interpolation between census benchmark years. Thus, annual variation in personal income estimates across states reflects variation in both benchmark year income levels and in the related series, such as employment, used to derive annual estimates of the various components of state income. We have no reason to believe that the annual income estimates fail to convey accurately the true variation across states in personal income growth during the 1930s, but these estimates are undoubtedly not as reliable as estimates for more recent years. See Schwartz and Graham, “Personal Income,” for details, or Garrett and Wheelock, “Why Did Income Vary,” for a summary of how the state income data were constructed. We use a slightly revised version of the original estimates available from the U.S. Department of Commerce, Bureau of Economic Analysis: “State Personal Income 1929–99 CD-ROM.”
Studies of state income growth rates since World War II have looked to differences in industrial composition, various public policies, cultural and ethnic differences, the influence of pressure groups, and banking conditions to explain differences in state income growth rates.3
Crain and Lee, “Economic Growth Regressions,” survey this literature and present new empirical evidence.
PATTERNS IN STATE PER CAPITA INCOME GROWTH, 1929–1939
Table 1 lists states in order of their percentage decline in nominal per capita income during 1929–1932.4
We focus on changes in nominal income rather than real (constant-dollar) income throughout this study because of a lack of aggregate price data for individual states. The National Bureau of Economic Research dates the business cycle peak in the third quarter of 1929 and dates the trough in the first quarter of 1933. Hence, using annual data, we consider 1929–1932 to be the contraction phase of the cycle and 1933–1939 to be the recovery phase.

increases during 1933–1939. States with low per capita income in 1929 tended to suffer larger percentage declines in income during 1929–1932 than high income states, but larger percentage income gains during 1933–1939.
The data in Table 1 reveal, not surprisingly, that states within the same region tended to have similar per capita income growth rates. Neighboring states generally have similar climates, geography, settlement patterns, etc., that lead to concentration in the same income-producing sectors. Hence, sector-specific shocks, such as a decline in agricultural prices, tend to have similar impacts on states located near one another, and can give rise to regional patterns in income growth.
Robert Barro and Xavier Sala-i-Martin use the following variable to capture the influence of shocks to specific income-producing sectors in their study of state income growth patterns:
5Barro and Sala-i-Martin, Economic Growth, distinguish between “σ” convergence, which refers to a decline in the dispersion of per capita incomes across states or regions, and “β” convergence, which refers to the tendency of the per capita incomes of poor economies to grow faster than those of higher-income economies.

where (ωij,t-T) is the ratio of earnings (income) in sector j to total earnings in state i at time t-T, and yjt is the national average of personal income per worker in sector j at time t. A state will have a larger value of S the more its income is derived from sectors that are experiencing rapid income growth nationally.
Other types of shocks can produce regional patterns in state income growth that are unrelated to concentration in specific income-producing sectors. For example, a war or a natural disaster can affect income growth regardless of source, and thereby introduce similarities in state income growth within regions that are unrelated to industrial concentration. To account for this possibility, we include regional dummy variables in our econometric model of state per capita income growth, in addition to the Barro and Sala-i-Martin measure of concentration in specific income-producing sectors (S).
Whereas S and the regional dummy variables control for aspects of state income growth associated with aggregate sectoral shocks and geography, respectively, we also explore interdependency in the income growth rates of neighboring states. A change in per capita income growth in one state might affect the per capita income growth rates of neighboring states because of commuting patterns, trade flows, etc. More specifically, the delineation of spatial units (states) does not necessarily correspond with distinct differences in regional economies or demographics, so the possibility exists that some degree of spatial dependence will exist between states. We test for both spillovers (spatial dependence) in per capita income growth and for unobserved spatial correlation in the error structure of the model.6
Consistent and efficient estimation of cross-sectional data requires testing and correcting for spatial dependence and spatial correlation. See Anselin, Spatial Econometrics.
Whereas the literature on regional economic growth has focused on sector-specific shocks and spatial patterns, bank failures play a leading role in many macroeconomic explanations of the Great Depression. For example, Milton Friedman and Anna Schwartz write that the contraction was a “tragic testimonial to the importance of monetary forces,” and emphasize the impact of banking panics on the stock of money, whereas Ben Bernanke contends that bank failures depressed economic activity by disrupting credit flows.7
Friedman and Schwartz, Monetary History, p. 300. Bernanke, “Nonmonetary Effects.”
Although bank failures occurred almost everywhere, bank failure rates varied widely across states during the Great Depression. Rhode Island had no bank failures, and most other Northeastern states had low failure rates. Several Midwestern and Southern states, however, experienced annual bank failure rates in excess of 10 percent during the contraction, and such states had among the largest declines in per capita income.8
The correlation between the percentage change in state per capita income and the average annual bank failure rate during 1929–1932 is –0.39.
Temin, Did Monetary Forces?
We also investigate whether state government expenditures affected the growth of per capita income during the Great Depression. Conceivably, a high level of state government expenditures might offset the effect of falling private expenditures on per capita income during an economic downturn. However, a recent study of the period 1977–1992 finds a negative relationship between the ratio of state government expenditures to personal income and state per capita income growth.10
Crain and Lee, “Economic Growth Regressions.”
For our study of the recovery phase of the Depression, we also consider the impact of Federal Government expenditures. Although fiscal policy, as reflected by the high-employment budget deficit, was not significantly expansionary during the recovery period, a recent study by Price Fishback, William Horrace, and Shawn Kantor finds that New Deal expenditures had a strong, positive influence on county-level retail sales.11
Fishback et al., “Did New Deal.” Fleck, “Marginal Effect,” uses a similar approach to study the effects of New Deal work-relief hiring programs on county-level unemployment rates.
ESTIMATION METHODOLOGY
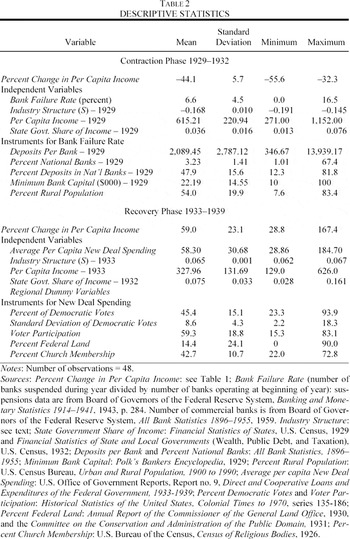
We estimate separate regressions for the contraction and recovery phases of the Great Depression. For the contraction phase, we regress the percentage change in state per capita income on the level of state per capita income in 1929, the industry structure variable (S), four regional dummy variables based on U.S. Census regions, the bank failure rate, and the ratio of state government expenditures to state income in 1929.12
We calculate the industrial structure variable (S) using earnings from the following ten industries: Farm, Agriculture Services, Mining, Construction, Manufacturing, Transportation & Public Utilities, Wholesale & Retail Trade, Finance & Insurance & Real Estate, Services, and Government. Data source: see Table 1.
We define the bank failure rate as the annual average rate of bank suspensions during 1929–1932. We use instrumental variables to control for the influence of state income growth on bank failure rates. Our instruments reflect aspects of banking market structure and regulation that have been used to explain interstate differences in bank failure rates during the 1920s and 1930s.13
See, for example: Wheelock, “Government Policy” and “Regulation.”
See Garrett and Wheelock, “Why Did Income Vary” for more detail about the selection of instruments and first-stage regression estimates, as well as past research on the Great Depression.
For the recovery years 1933–1939, we regress the percentage change in state per capita income on New Deal spending, industry structure (S—constructed using income data from 1933 and 1939), state per capita income in 1933, the ratio of state expenditures to state personal income in 1932, and four regional dummy variables.15
State expenditure data are not available for 1933.
Our New Deal spending variable is the average annual level of per capita New Deal spending (loans plus grants) over the period 1933–1939. We use instrumental variables to control for the possibility that New Deal spending was to some extent influenced by state income growth. Our instruments for New Deal expenditures are similar to those used by Robert Fleck and by Fishback, et al.: Average of the Democratic vote share in each presidential election from 1896 to 1932 (Percent of Democratic Votes); Standard deviation of the Democratic vote share from 1896 to 1932 (Standard Deviation of Democratic Votes); Average voter participation in each presidential election from 1896 to 1932 (Voter Participation); Federal land as a percent of a state's total land area in 1930 (Percent Federal Land); Percent of a state's population that belonged to a church in 1926 (Percent Church Membership).16
Fleck, “Marginal Effect.”
We estimate the following model separately for the contraction phase and recovery phase of the Great Depression:

where y is the percentage change in per capita personal income and X is the matrix of independent variables listed in Table 2 (state subscripts are suppressed). The scalar ρ provides an estimate of spatial dependence under the hypothesis that a change in per capita income in state i is correlated with changes in per capita income in neighboring states. The (N×N) spatial weights matrix, W, captures the effect of a change in per capita income in state i that results from a change in per capita income in bordering state l. Specifically, we define the elements of our weights matrix W = w*il} as w*il = wil/[sum ]lwil where wil = 1 if observations i and l (i ≠ l) share a common border and wil = 0 otherwise. Because the spatially lagged dependent variable is endogenous by construction, we follow the literature and use spatially lagged independent variables (WX) as instruments for the spatially lagged dependent variable.
17See, for example, Kelejian and Prucha, “Generalized Moments Estimator.”

We also model and test for spatial error correlation in equation 2.
18Spatial error correlation can result from spatial heterogeneity, spatially lagged independent variables, and an omitted spatially lagged dependent variable. See Anselin, Spatial Econometrics.

where ε is the (N×1) vector of error terms, ϒ is a (N×1) component of the error terms made up of i.i.d. random variables, W is the (N×N) weights matrix with elements W = w*il defined earlier, and λ is a scalar interpreted as the unobserved spatial error correlation coefficient. We estimate the models using generalized two-stage least squares (2SLS) where the spatial error coefficient (λ) is estimated by the generalized method of moments (GMM). The generalized 2SLS procedure produces consistent estimates of the model's parameters.
Our estimation procedure has several steps and is based on the methodology proposed by Harry Kelejian and Ingmar Prucha.
19Kelejian and Prucha, “Generalized Moments Estimator.”

using a GMM estimator. We then pre-multiply equation 2 by(I -
λW) and estimate this transformed equation using 2SLS.
EMPIRICAL RESULTS
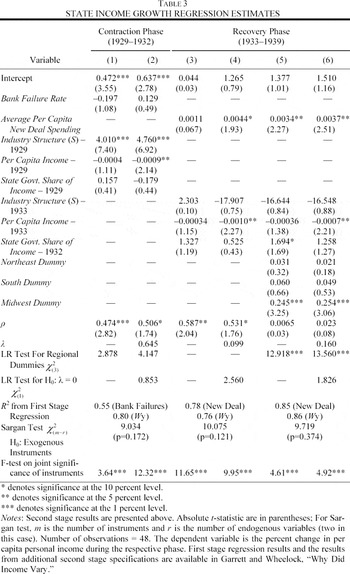
Regression results for the contraction (1929–1932) and recovery periods (1933–1939) are reported in Table 3. In addition to the second-stage coefficient estimates, we report the R2 statistics from the first stage regressions for the bank failure rate, New Deal spending, and Wy (the spatially lagged dependent variable). To provide evidence on the validity of our instruments, we also report, first, a Sargan test statistic on the null hypothesis that the instruments are uncorrelated with the errors of the second stage regressions and, second, an F-test on the null hypothesis that the instruments in the first stage regressions are jointly different than zero. The Sargan test statistics indicate that we cannot reject the hypothesis that the instruments are uncorrelated with the second stage error terms and the F-tests reveal that the instruments are jointly different than zero.20
We experimented with a variety of instruments and specifications for the bank failure rate to ensure exogeneity and good fit, and obtained qualitatively similar results to those reported here. Other details, including all first-stage regression results and the results from additional model specifications, are reported in Garrett and Wheelock, “Why Did Income Vary.”

We report two specifications for the contraction phase. Neither specification includes regional dummy variables, which we found to neither add explanatory power (based on likelihood ratio tests) nor influence the size and significance of the other coefficient estimates. Model 1 includes a spatial lag (with coefficient estimate ρ) and Model 2 includes both a spatial lag and a spatial error term (with coefficient estimate λ). The coefficient ρ is statistically significant in both specifications, and indicates that a 1 percentage point decline in the average per capita income growth rate of neighboring (border) states caused a state's per capita income growth rate to decline by about 0.5 percentage points.
We also find evidence that differences in the performance of major economic sectors contributed significantly to variation in state per capita income growth, as evidenced by the statistically significant coefficient on industry structure (S). States that derived a high percentage of personal income from sectors that performed especially poorly during 1929–1932, such as construction, farming, and mining, had significantly larger declines in per capita income than did more diversified states. States that were concentrated in sectors that performed relatively less poorly, such as services, finance, and transportation, experienced even smaller income declines.
Our results indicate that industry structure and spatial dependence can account for divergence in the level of state per capita incomes during 1929–1932. When these two variables are included in the model, the coefficient on the 1929 level of per capita income is negative (and statistically significant in model 2). Hence, within our model, industry structure and spatial dependence can fully explain the positive correlation between state per capita income in 1929 and income growth during 1929–1932. By contrast, we find no evidence that differences in bank failure rates or state government expenditures explain variation in state per capita income growth during 1929–1932.21
The coefficient on the bank failure rate is statistically significant in a model that does not include spatial effects. However, the nonspatial model is clearly rejected by likelihood ratio tests of fit in favor of the spatial lag model. See Garrett and Wheelock, “Why Does Income Vary” for additional results and discussion.
We report the estimates of four specifications for the recovery phase, 1933–1939. Models 5 and 6 include regional dummy variables, whereas models 3 and 4 do not. In contrast to the results for 1929–1932, we find that the regional dummy variables contribute (jointly) significant explanatory power to the regressions for 1933–1939. All else equal, the average Midwestern state had a 25 percentage point larger increase in nominal per capita income during this period than did the average Western state (the omitted group). The average increase across all states during the period was 59 percent (see Table 1). Further, a comparison of models 5 and 6 with models 3 and 4 reveals that spatial dependence in per capita income growth is not statistically significant when regional dummy variables are included in the model. This suggests that the degree of spatial dependence is different across regions, but that within each region there is no significant spatial dependence once unobserved regional variation in income growth is considered in the model. Finally, although we are unable to reject the hypothesis of no spatial correlation in the model error terms, a comparison of models 3 and 4 with models 5 and 6 reveals that, when we allow for spatial error correlation, the coefficients on the level of per capita income in 1933 are statistically significant. Their negative sign indicates that, all else equal, the higher a state's per capita income in 1933, the lower its per capita income growth rate during 1933–1939.
In contrast to the contraction phase of the Great Depression, we find no evidence that differences in income growth across major sectors contributed to variation in state per capita income growth during the recovery, as evidenced by the insignificant coefficients on industry structure. Compared with 1929–1932, income growth varied little across sectors during 1933–1939. Hence, differences in industry structure across states contributed little to variation in state per capita income growth rates.
Finally, we find evidence that New Deal spending patterns contributed to variation in state per capita income growth rates. The higher the level of federal expenditures and loans within a state, all else equal, the higher the state's per capita income growth rate.22
In light of the findings of Fishback, et al., “Did New Deal Grant Programs,” we investigated whether spending by the Agricultural Adjustment Administration (AAA) had a different effect on state per capita income growth rates than other forms of New Deal spending. Subtracting AAA spending from our New Deal variable resulted in essentially no changes in any of the coefficient estimates. We also found no difference in the empirical results when we used grants alone rather than loans plus grants as our measure of New Deal spending.
We use the standard deviation of the fitted New Deal expenditure variable ($27.19) rather than the standard deviation of the actual New Deal expenditure variable ($30.68). Annual New Deal expenditures averaged 14.72 percent of state personal income during 1933–1939.
CONCLUSION
Per capita income fell substantially in all U.S. states during the contraction phase of the Great Depression, but the extent to which per capita income declined varied widely across states. States that had relatively low per capita incomes on the eve of the Depression suffered larger percentage declines in per capita income than did high income states. We find that much of this divergence in per capita income was due to the concentration of low income states in sectors such as agriculture, mining, and construction that suffered disproportionately large income declines at the national level. Further, we find evidence of cross-state spillovers, in that a decline in one state's per capita income was larger the greater the decline in income growth among its immediate neighbors. Indeed, industrial composition and spatial effects can fully explain why states with low initial income suffered larger declines in income during the contraction.
State per capita incomes converged during the recovery phase of the Great Depression. In contrast to the contraction phase, differences in industrial composition and cross-state income spillovers explain little or no variation in per capita income growth across states during the recovery. We find evidence that New Deal expenditures had a rather large and statistically significant effect on state per capita income growth. However, we would caution that considerable regional variation in state per capita income growth during the recovery remains unexplained.
The authors thank Jeremy Atack and two anonymous referees for comments on previous drafts of this note, and Molly Castelazo and Joshua Ulrich for research assistance. Views expressed in this note do not necessarily reflect official positions of the Federal Reserve Bank of St. Louis or the Federal Reserve System.