Introduction
Phyllosilicate minerals play an important role in the physical and chemical processes of many natural systems, especially under the action of an aqueous solution (e.g. the presence of water molecules). Refining, component dissolution, exchange/ adsorption, structural evolution and other processes are constantly occurring, all very important to maintain the Earth’s ecosystem (Sposito, Reference Sposito1989; Hao et al., Reference Hao, Shannon and Teruhiko2019). Due to the development of human industries there are now many additional factors affecting the environmental ecosystem, such as wastewater discharged from coal and oil burning, mining and processing, organic and inorganic chemical production, etc., leading to air pollution and acid rain, ultimately resulting in acidification of local water or soil (Ren et al., Reference Ren, Cao and Wu2023). These additional factors, further increase the rate and complexity of the reaction process at the mineral–water interface, and it becomes imperative that these reaction processes and the affect of acidic media on layered silicate minerals are fully understood.
A large amount of basic research has been done on the weathering of phyllosilicate minerals (Stumm and Wieland, Reference Stumm, Wieland and Stumm1990; Meng et al., Reference Meng, Li, Huang and Chen2016; Peng et al., Reference Peng, Min, Liu and Chen2016). However, this work has primarily focussed on the weathering of dioctahedral minerals such as kaolinite and montmorillonite (Amram and Ganor, Reference Amram and Ganor2005; Cappelli et al., Reference Cappelli, Yokoyama, Cama and Huertas2018; Krupskaya et al., Reference Krupskaya, Novikova, Tyupina, Belousov, Dorzhieva, Zakusin and Belchinskaya2019; Lin et al., Reference Lin, Yu, Zhang, Zhang, Zhong, Wang and Huang2020). Recently attention has begun to focus on the reaction mechanisms of trioctahedral minerals such as lizardite, chlorite, talc and vermiculite in acidic media. The most significant results show that Mg2+ in different lizardite minerals has different dissolution characteristics, and the dissolution rate of Mg2+ is closely related to the crystal structure, chemical properties and microscopic morphology (Lacinska et al., Reference Lacinska, Styles, Bateman, Wagner, Hall, Gowing and Paul2016). In sulfuric acid solutions with different pH values, the dissolution rate and the sequence of ion release of chlorite are controlled by the pH, and the higher the concentration of H+, the more favourable the preferential release of Fe3+ from the octahedron (Liao et al., Reference Liao, Chen, Wang and Zhang2021). When talc is reacted in a closed solution system at 25℃ and pH 5, it can be found that the dissolution rate of Mg in octahedral sheets is higher than that of Si in tetrahedral sheets, and the dissolution rate of talc is controlled by the degree of destruction of silica tetrahedral sheets (Lin and Cemency, Reference Lin and Cemency1981). An in-depth study of talc in different pH ranges, found that pH has little or no effect on its dissolution rate (Jurinski and Rimstidt, Reference Jurinski and Rimstidt2001). For our current investigation into the dissolution process of stratified silicate minerals in different acidic media we found that it is difficult to compare previous research results due to the different experimental conditions of the obtained data. There is also a lack of research on the chemical kinetics mechanism at the mineral–water interface based on the different properties of two-dimensional structural units of phyllosilicate minerals. Due to differences in composition and structure, dioctahedral minerals generally exhibit greater stability than trioctahedral minerals – trioctahedral minerals demonstrate higher ion dissolution rates and migration abilities, leading to a more significant impact on the ecological environment. Consequently, this study uses trioctahedral minerals as the research object.
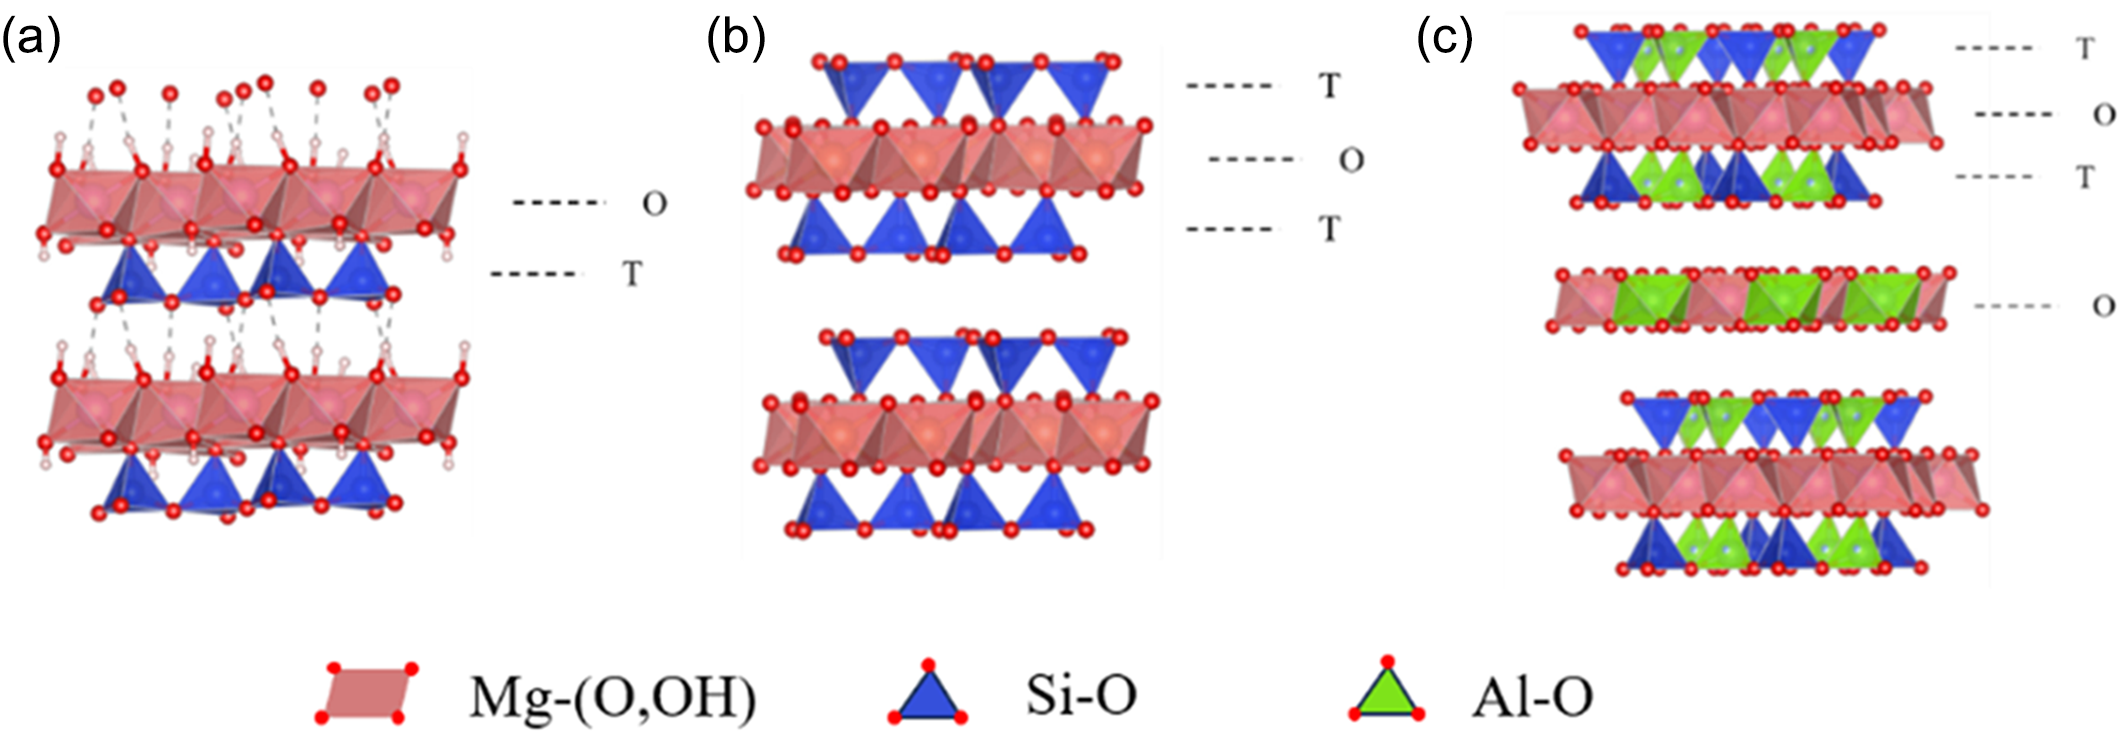
The trioctahedral phyllosilicate minerals lizardite, chlorite and talc have structural layers formed of a silica tetrahedral (T) sheet (Si2O5) and an octahedral (O) sheet M–(O,OH). Between the structural layers are interlayer domains with or without interlayer matter (Gazze et al., Reference Gazze, Stack, Ragnarsdottir and Mcmaster2014; He et al., Reference He, Zhang, Yu, Xu and Chi2016). For example, along the c axis of lizardite (1:1 type, no interlayer, Fig. 1a), talc (2:1 type, no interlayer, Fig. 1b) and chlorite (2:1 type, interlayer, Fig. 1c), the structural layers and interlayer domains form structural unit layers or crystal layers (Hegyesi et al., Reference Hegyesi, Pongráccz, Vad and Pukánszky2020). The minerals formed by the different crystal layers have different composition, structure and chemical bond strength properties, so they have different chemical stability and dissolution kinetics, and hence the siloxane or hydroxyl base surface and corresponding edge (end surface) formed by them should have different chemical activities.
Schematic diagram of the crystal structures of (a) lizardite, (b) talc and (c) chlorite. T = tetrahedral sheet and O = octahedral sheet.

In this research, by constructing percolation systems with different pH values (ranging from 2 to 6) and simulating acid precipitation, leaching experiments were carried out on the test minerals, and an open mineral–water interface reaction environment was established to analyse the mineral filtrate residue and filtrate samples after leaching. In order to investigate the structural changes and the dissolution efficiency and dissolution rate of components in the mineral–water interfacial reaction of lizardite, chlorite and talc under different acidic environments, a kinetic model of Mg and Si dissolution in lizardite, chlorite and talc was established.
Materials and methods
Materials and reagents
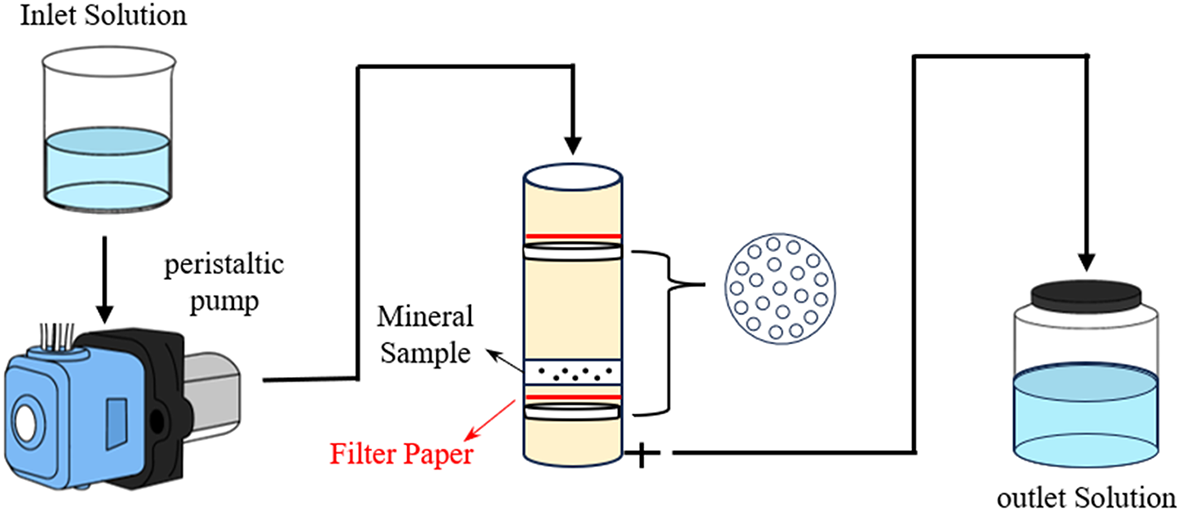
Lizardite and chlorite were collected from Xiuyan County, North Wagou Xiuyu Mine, and talc was collected in Guilin Longsheng, Guangxi. The samples were crushed and ground (through 200 mesh screening). In order to minimise the influence of high-energy surface sites and fine particles generated during the grinding process, the samples were rinsed three times in ultrapure water (resistivity ≥ 18.2 mΩ cm) subsequent to immersion in an ultrasonic bath. The pH was adjusted with a solution of sodium hydroxide (NaOH, 1%) and dilute sulfuric acid (H2SO4, 1%). All chemical reagents were analytical grade reagents, provided by Chengdu Kelong Chemical Ltd. All experiments were carried out in the leaching device, as shown in Fig. 2.
Experimental apparatus used in the leaching process.

Experimental
At room temperature, samples of 1 g lizardite, chlorite and talc, respectively, were weighed and placed in the leachate (Fig. 2). This leaching method is considered to be closer to a natural system, and so was used in place of a mixed flow reactor. In the leaching process, the pH of the leaching solution is always kept constant to prevent experimental error that could be caused by a change in pH due to reactions with the mineral sample; the solution is continuously transferred to replicate a water interface interaction between air precipitation and mineral samples in their natural environment. Additionally, the reaction device was built to release the filtrate after the reaction. The leaching solution used was sulfuric acid solution with pH values of 2.0, 4.0 and 6.0, respectively. In the leaching experiments, the flow rate of sulfuric acid solution for the different pH values was set at 0.4 mL/min, and the duration of each experiment was 40 hours. The filtrate was collected in a closed glass bottle and analysed every 4 hours for a total of 10 sample solutions. The sample solution was used for ICP analysis to calculate the concentrations of Mg, Si and Al in the solution. After the leaching experiment was completed, the solid mineral samples were washed three times with ultrapure water, dried at 60℃, and then ground for X-ray diffraction (XRD). The samples were labelled as Lz, Chl and Tlc, for lizardite, chlorite and talc respectively.
Characterisation
Chemical analysis of major elements was performed by X-ray fluorescence (XRF). Elements were analysed using an Axios series X-ray fluorescence spectrometer, equipped with an X-ray tube with a Rh anode and a maximum voltage/current of 60 kV/150 mA. The fundamental parameter method using Spectra plus software was used to quantify the elements.
The specific surface area of the lizardite, chlorite and talc were measured by the Brunauer–Emmett–Teller (BET) method, using 5-point N2 adsorption isotherms, after degassing the sample for 60 min at 120°C, using a McASAP 2460 (Norcross, Georgia, USA) instrument.
X-ray diffraction (XRD) was used to determine the mineralogical changes in the samples before and after the water–interface reaction. XRD data were obtained using a D/max-IIIA diffractometer manufactured by Rigaku (Tokyo, Japan). A copper target with a sum-tube voltage of 40 kV and a sum-tube current of 40 mA was accompanied by a slit system DS1/2(°). The powdered samples were analysed between 3 and 80°2θ. The step size was 0.02°2θ and the scan rate was 2 s/step.
The cation (Mg, Si) content in solution was measured by an inductively coupled plasma emission spectrometer (ThermoiCAP 6500, Waltham, Massachusetts, USA). Prior to each analysis, the ICP was calibrated (r 2 > 0.999) via serial dilution of certified standards (BDH Limited).
The average rate of dissolution of each ion in the mineral is calculated as follows:
 \begin{equation}{r_i\left(\,\overline t\right)=\frac{C_i\times m_1}{t\times m_0\times SSA\times{\unicode{x03B7}_{i}}}}\end{equation}
where Ci is the concentration of solute i (Mg, Si, Al, mmol/kg) in the sample recovered at time t; m 1 is the mass of the sample solution before sampling (in kg); t is the sample reaction time; m 0 is the initial mass of the mineral (in g); SSA (m2/g) is the specific surface area of the mineral; and ηi is the stoichiometric coefficient of element i in the mineral.
Results and discussion
Chemical analysis of raw minerals
The XRF compositions of the purified samples of lizardite (Lz), chlorite (Chl) and talc (Tlc) have been reported in Zhao et al., (Reference Zhao, Sun, Peng, Zeng and Wu2025) and are given in Supplementary Table 1. The typical structural layer of lizardite is 0.44 nm thick and consists of tetrahedral and octahedral sheets (Wang et al., Reference Wang, Lu, Wang, Zheng, Zhao and Liu2006; Evans et al., Reference Evans, Hattori and Baronnet2013). In the tetrahedral sheets, Si is replaced by Al and Fe, whereas in the octahedral sheets, Mg is replaced by Fe and a small amount of Cr, Ni and Ti (Mellini and Zanazzi, Reference Mellini and Zanazzi1987; Fuchs et al., Reference Fuchs, Linares and Mellini1998). The Chl sample consists of a negatively charged tetrahedral–octahedral–tetrahedral (TOT) layer with a thickness of 0.66 nm and a positively charged interlayer octahedral sheet with a thickness of 0.22 nm (Brigatti et al., Reference Brigatti, Galan and Theng2013). In the tetrahedral sheet, Al replaces Si, and in the octahedral sheet, Al and Fe replace Mg, and a small amount of Cr and Mn occupy the octahedral sheets (Barnhisel and Bertsch, Reference Barnhisel, Bertsch, Dixon and Weed1989). The Tlc sample has a 2:1 type structure, where the tetrahedral sheet only contains Si; there is a small amount of Fe instead of Mg in the octahedral sheets (Douillard et al., Reference Douillard, Salles, Henry, Malandrini and Clauss2007; Saldi et al., Reference Saldi, Köhler, Marty and Oelkers2007). Using the compositions in Supplementary Table 1, the crystal chemical formulas of the Lz, Chl and Tlc samples were calculated on the basis of (O) 11 and (O) 14 oxygen atoms as:
Lz: (Mg5.418Fe0.402Cr0.028Ni0.02Ti0.007)5.875[(Si3.777Al0.123Fe0.1)4O10](OH)8
Chl: (Mg3.401Fe1.105Al0.956Mn0.033Cr0.007)5.502[(Si2.586Al1.414)4O10](OH)8
Tlc: (Mg2.987Fe0.013)3[Si4O10](OH)2
Leaching based variations in mineral structure
XRD analysis
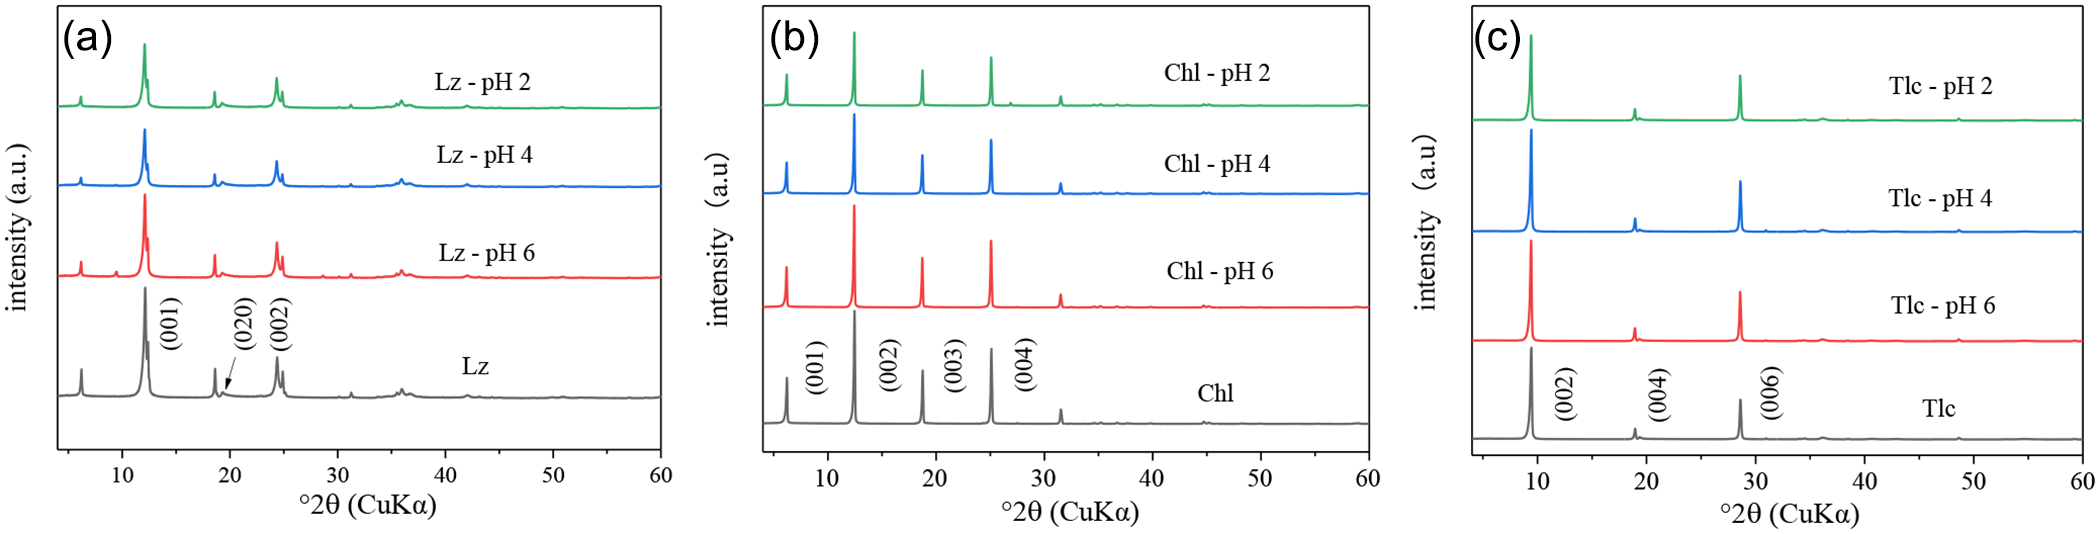
The diffraction pattern in Fig. 3 shows the original lizardite (Lz) before the leaching has peaks at d 001 = 7.29 Å, d 020= 4.76 Å and d 002 = 3.64 Å, and there is a small amount of chlorite (d 001 = 14.1 Å, d 004 = 3.67 Å). The diffraction peaks for the original Chl sample are d 001 = 14.23Å, d 002 = 7.11Å, d 003 = 4.73Å and d 004 = 3.55Å. The diffraction peaks for Tlc are d 002 = 9.37Å, d 004 = 4.67Å and d 006 = 3.12Å. After being leached by sulfuric acid solutions with pH values of 2.0, 4.0 and 6.0 for 40 hours, the intensity of the d 00l series diffraction peak decreases with the decrease in pH of the sulfuric acid solution. This indicates that the crystal structure of lizardite and chlorite is being destroyed with the ‘attack’ of H+ in solution. After the Tlc samples were leached by sulfuric acid solution with different pH values for 40 hours, the diffraction peak intensity did not change significantly. Therefore, compared with Lz and Chl, the Tlc sample is more stable, and the ‘attack’ of H+ in the solution will not cause obvious damage to the crystal structure of talc.
XRD patterns of mineral samples with sulfuric acid solution at pH 2.0, 4.0 and 6.0 after leaching for 40 hours for (a) lizardite (Lz), (b) chlorite (Chl) and (c) talc (Tlc) samples.

Scanning electron microscopy analysis
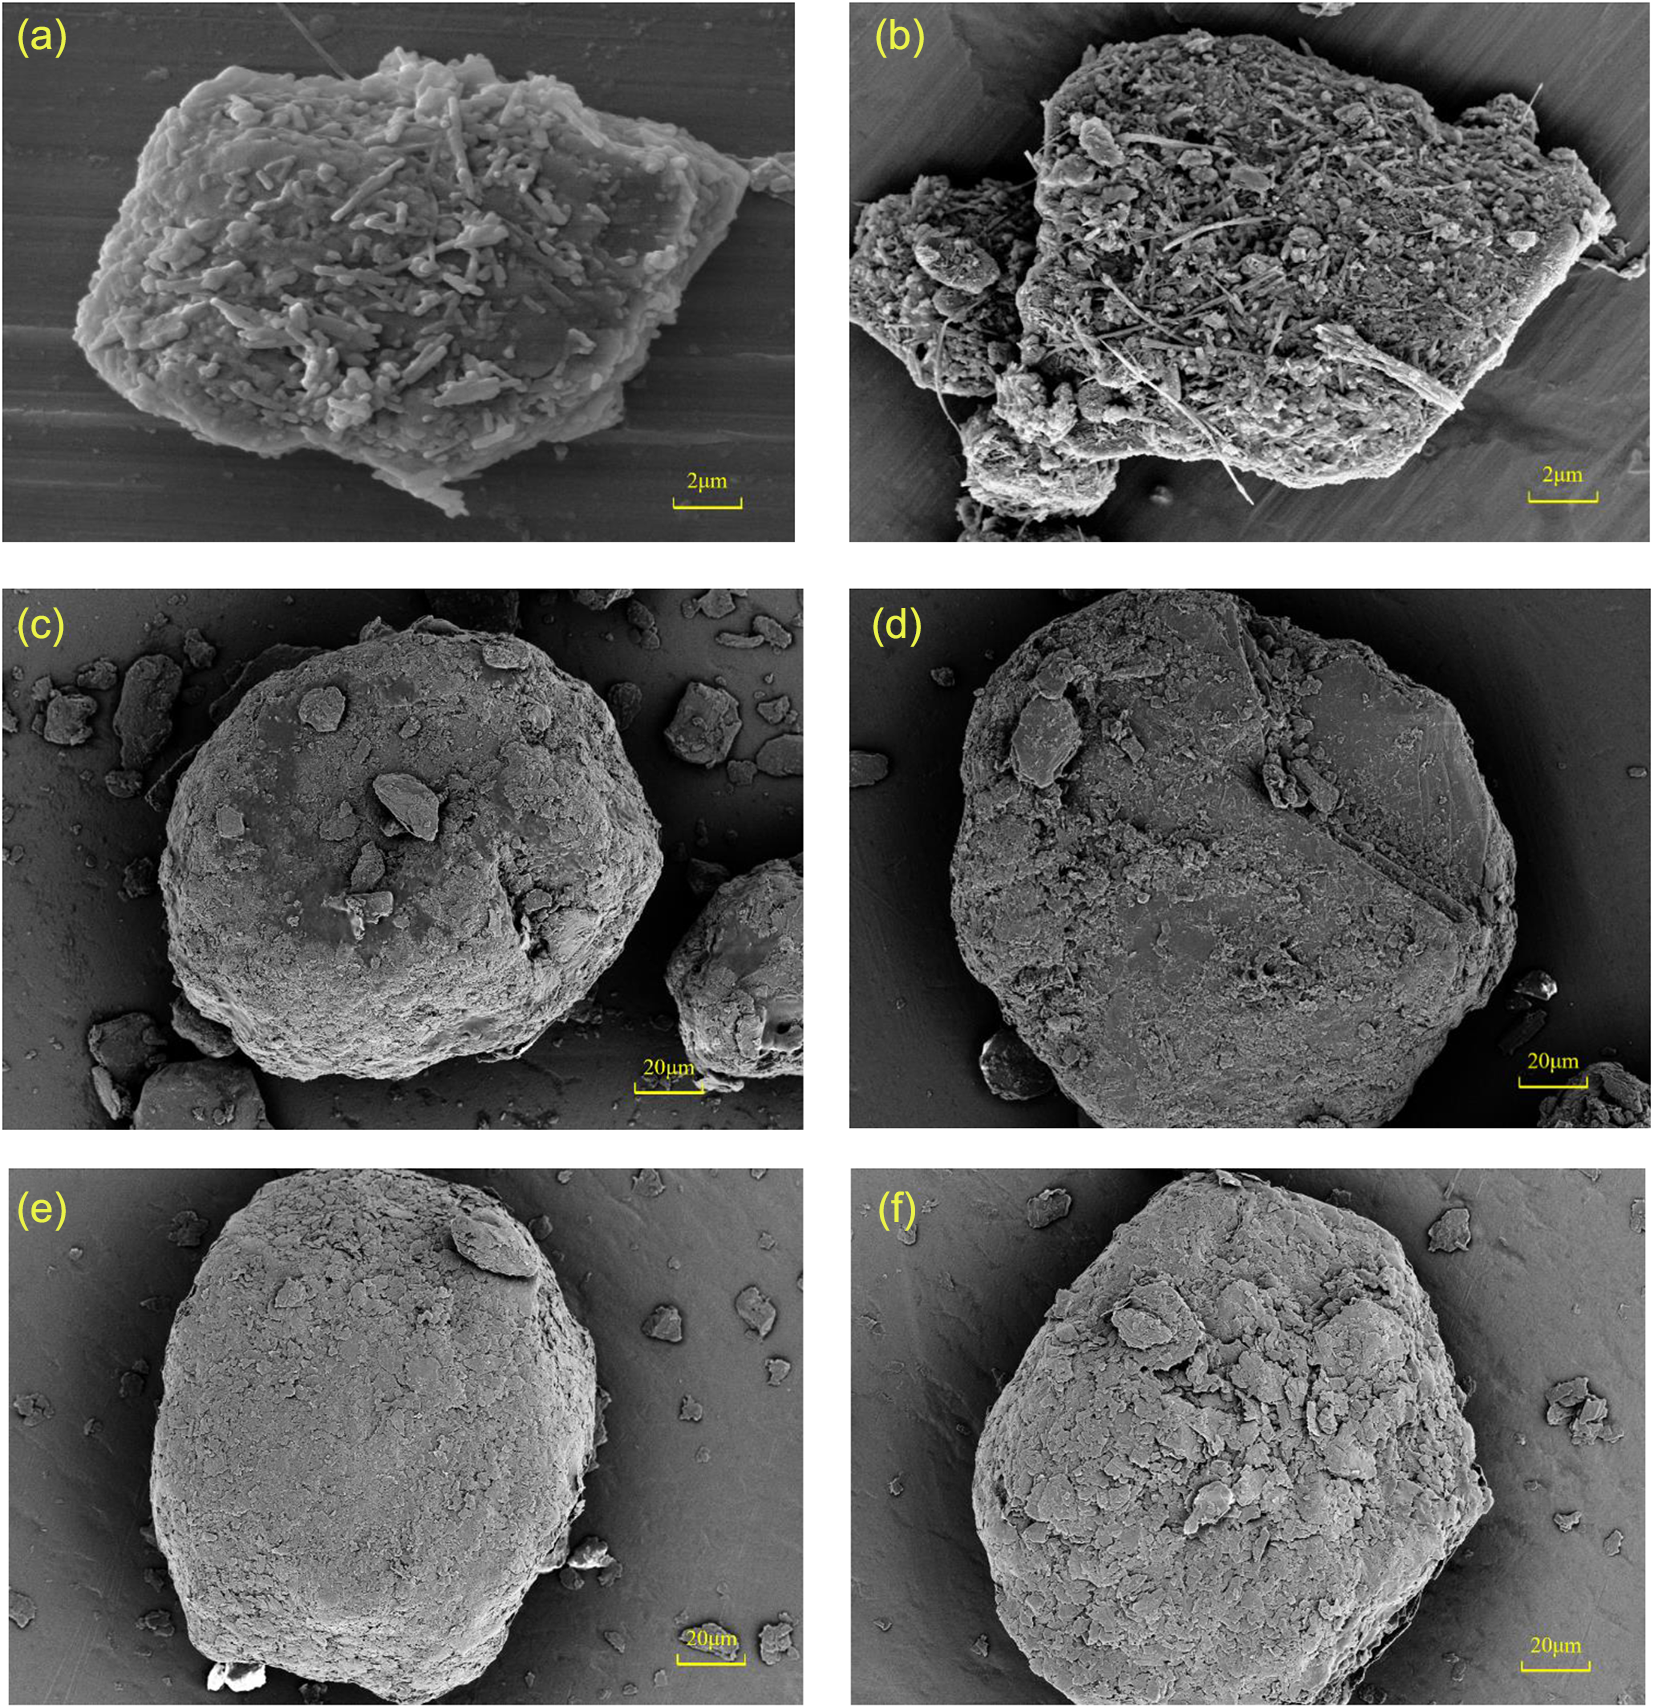
Imaging using scanning electron microscopy (SEM) shows that the Lz original sample (Fig. 4a) has predominantly lamellar micromorphology, with some small mineral particles and tubular chrysotile attached to the surface. After Lz has reacted with sulfuric acid solution with pH of 2.0 for 40 h (Fig. 4b), the main laminar structure is retained, but the outer surface is corroded and erosion pits have formed. The large layer structure is destroyed into small layers, and more small mineral particles and tubular chrysotile corroded by H+ were adsorbed on the lizardite surface. The original structure of Chl is relatively complete (Fig. 4c) after a 40 h reaction with a pH of 2.0 sulfuric acid solution. However, obvious erosion signs can be found on the surface of Chl, and clear lamellar structures can be seen from the edge of the destroyed mineral. This indicates that the dissolution of Chl in acidic solution occurred at the grain edge, and at the cracks and structural defects (Ross, Reference Ross1969; Kameda et al., Reference Kameda, Sugimori and Murakami2009). For Tlc, after reaction for 24 h (Fig. 4f), the edge lamellae were attacked by H+, the structure was destroyed and corroded, and part of the structure of Tlc collapsed. The Tlc surface undergoes corrosion, resulting in the formation of small flakes that adhere to the mineral surface.
SEM images: (a) original sample of lizardite (Lz) and (b) in sulfuric acid solution with pH 2.0; (c) original sample of chlorite (Chl) and (d) Chl in sulfuric acid solution with pH 2.0; (e) original sample of talc (Tlc) and (f) in sulfuric acid solution with pH 2.0.

Dissolution of Mg, Si and Al in minerals
Dissolution efficiencies of Mg, Si and Al
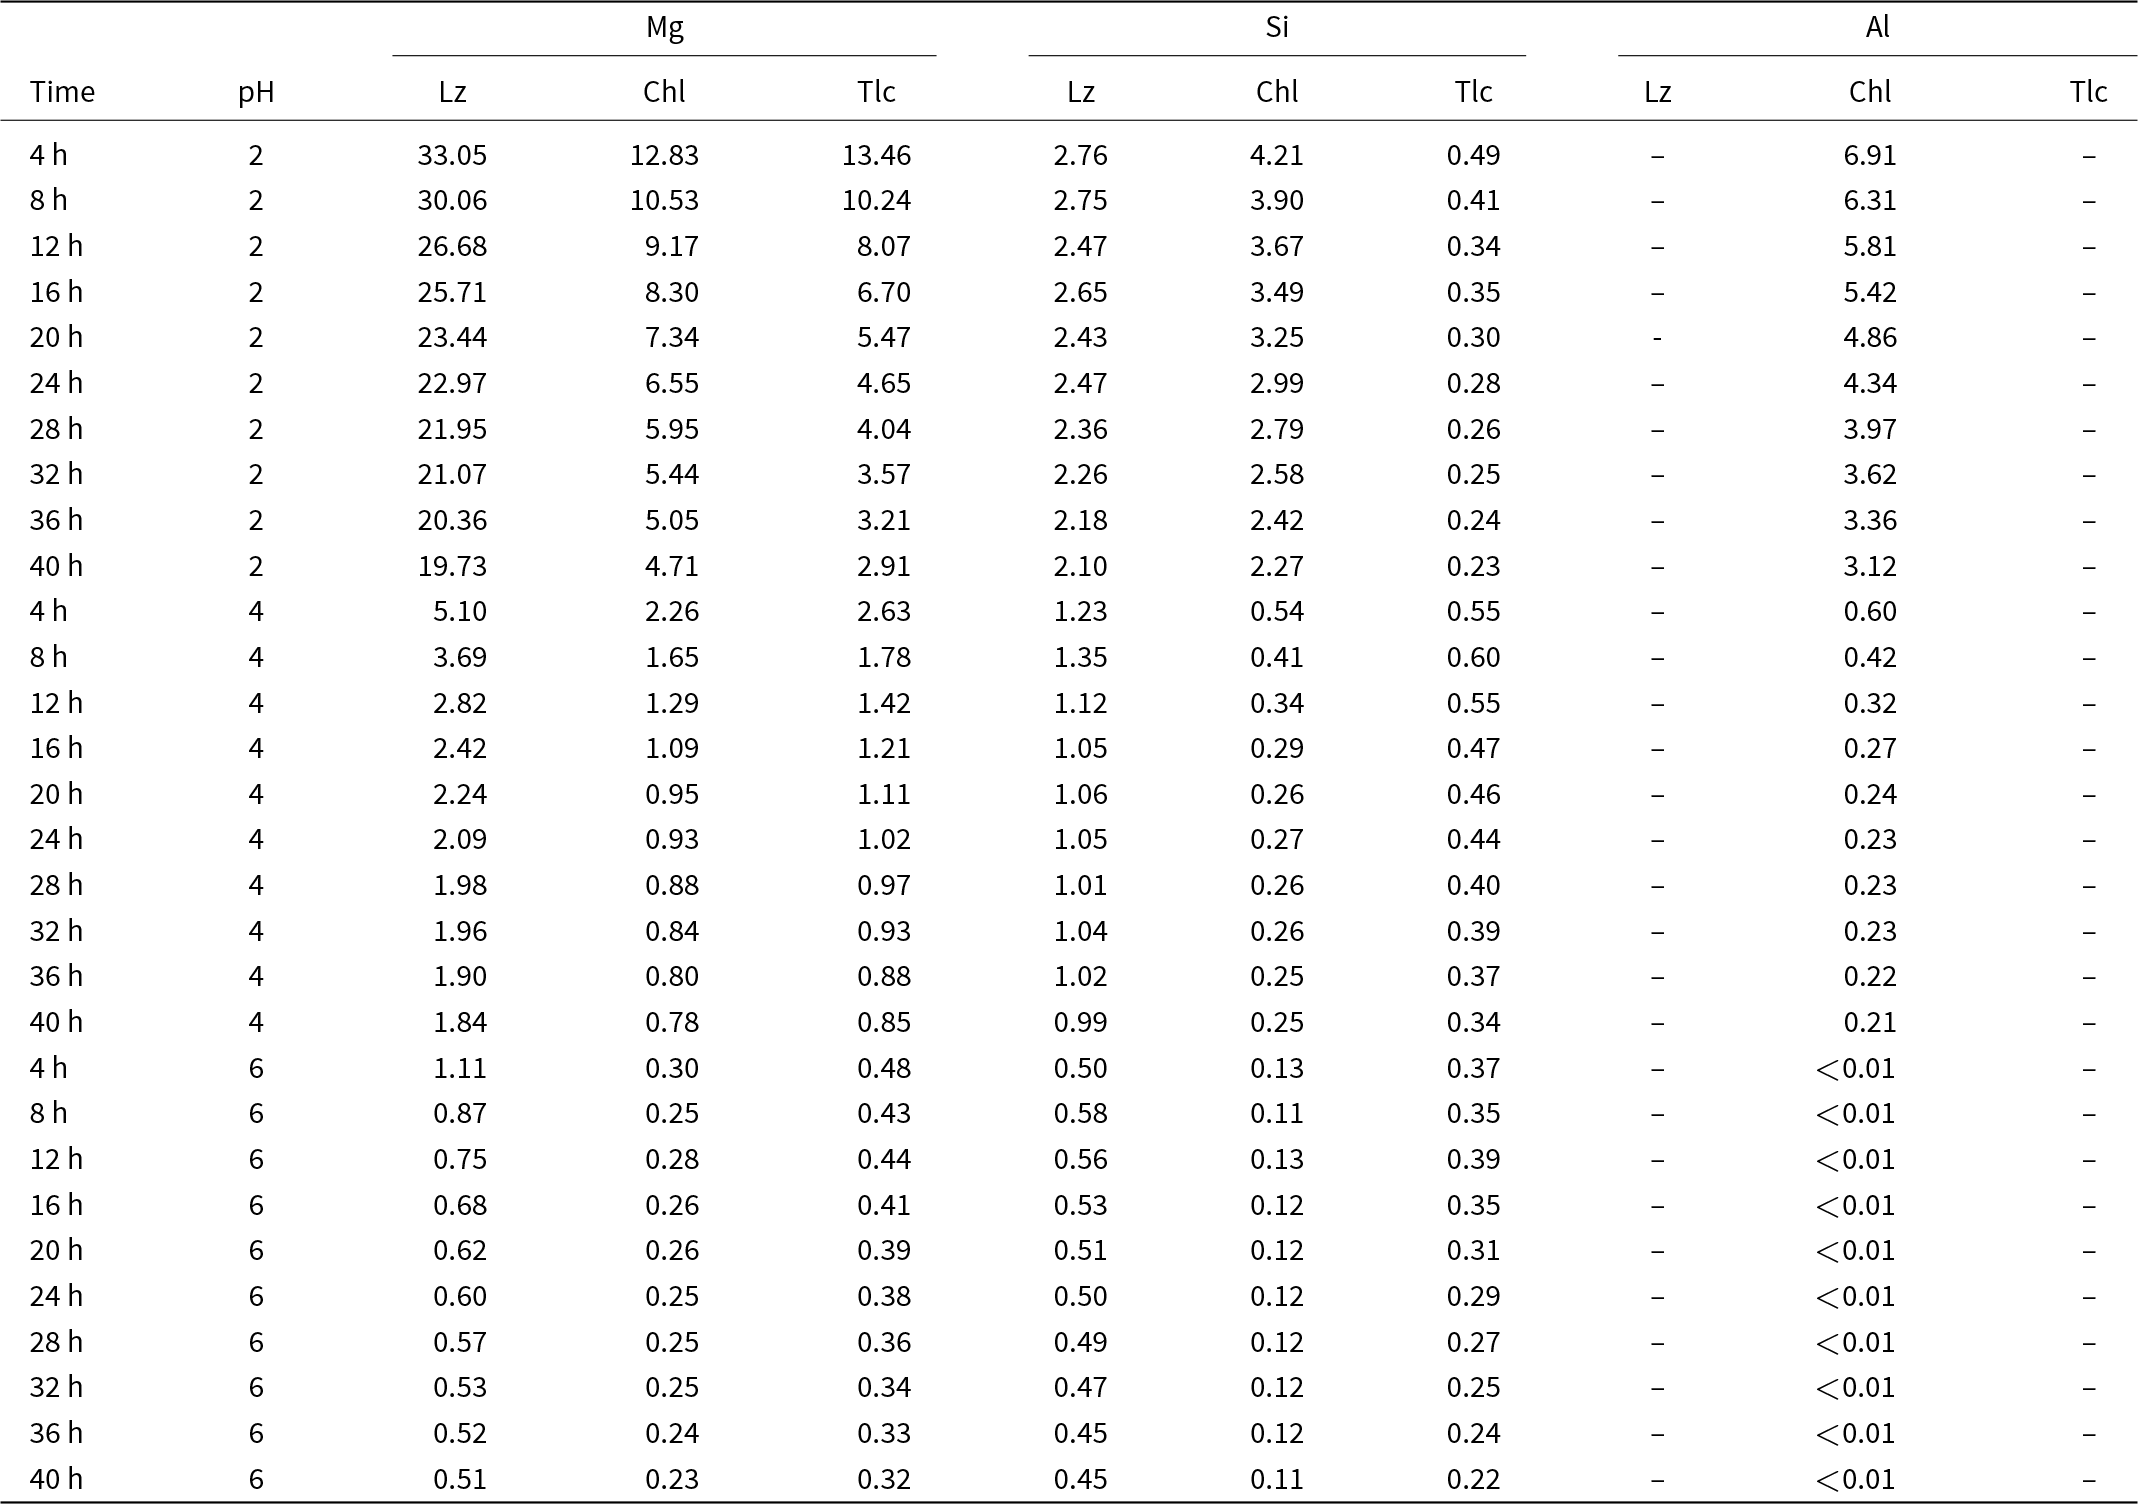
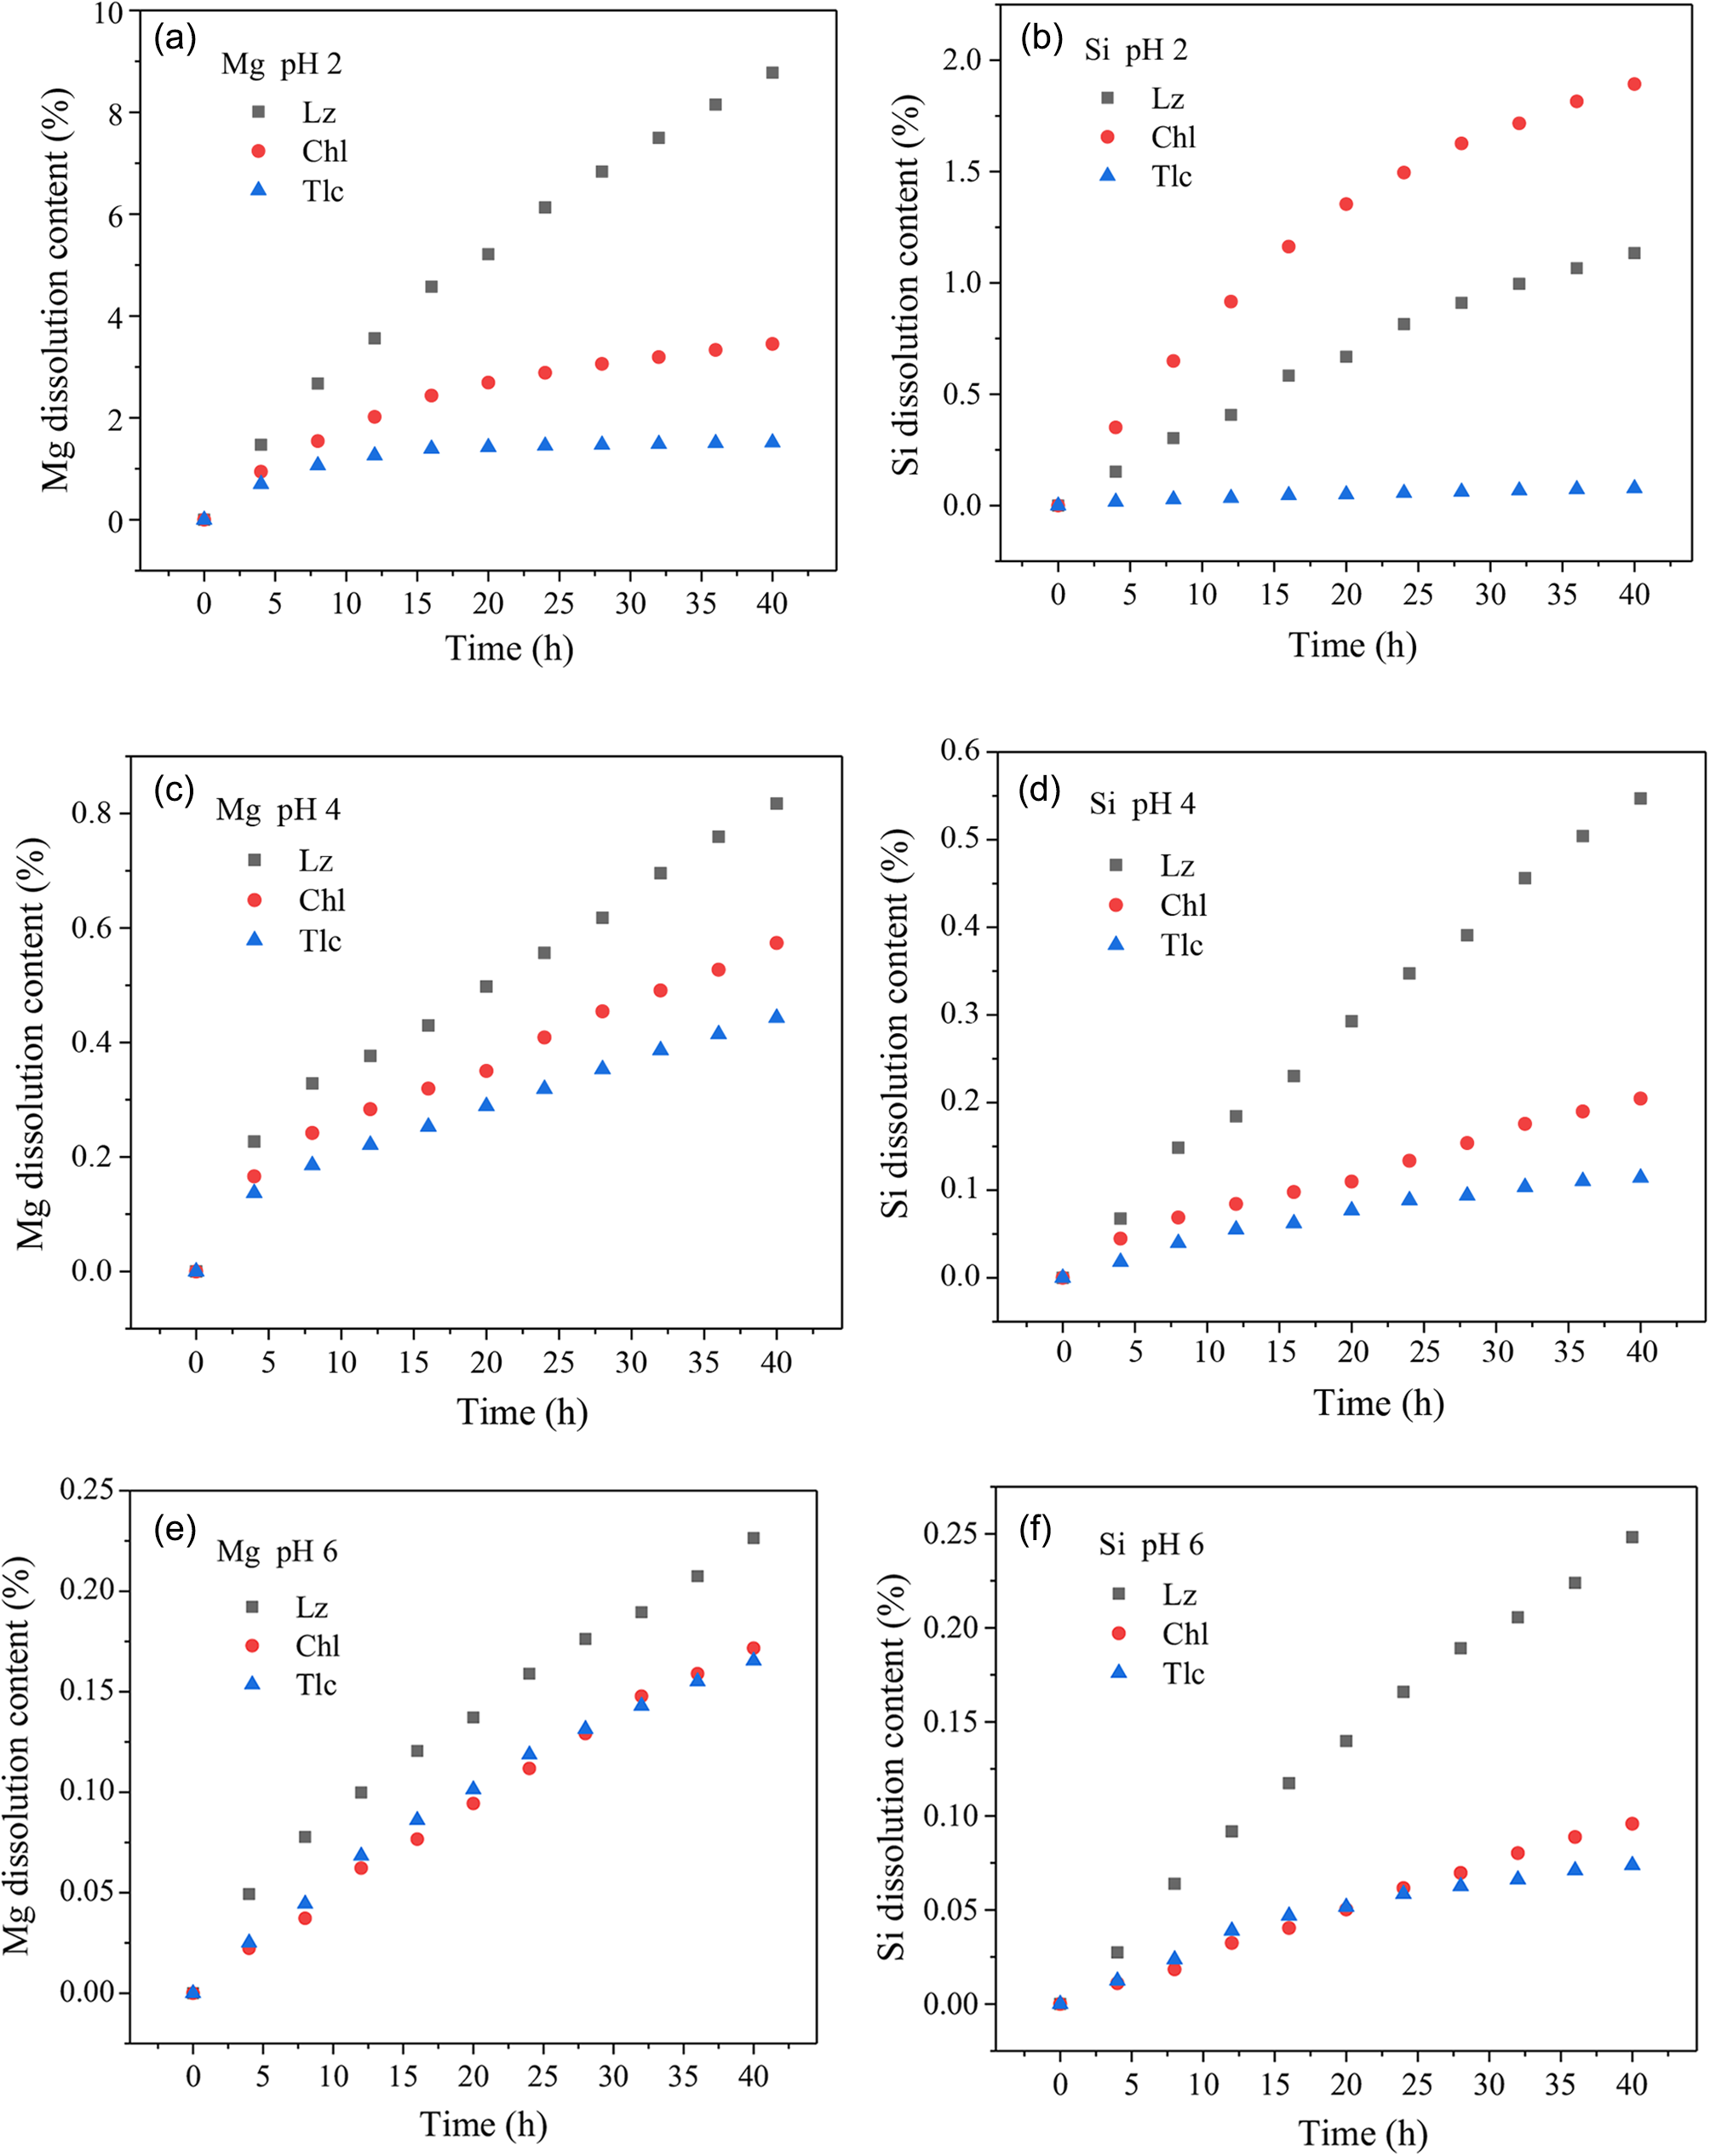
The concentration of Mg and Si in the filtrate collected each time was analysed and calculated (Table 1), and the dissolution efficiencies of Mg and Si in the Lz, Chl and Tlc samples were obtained (Fig. 5). In general, when sulfuric acid solutions with different pH leached the Lz, Chl and Tlc samples, the dissolution efficiencies of Mg and Si of the three minerals increased with the decrease of pH. The dissolution efficiency of Mg in Lz is higher than that of Chl and Tlc under acidic pH values of 2.0, 4.0 and 6.0. The dissolution efficiency of Mg in Chl is greater than that of Tlc under acidic pH of 2.0 and 4.0. When the pH was 6.0, the dissolution efficiency of Mg in Chl and Tlc was basically the same (Fig. 5e). The difference in the dissolution efficiency of Mg is mainly due to the difference in the structure of minerals – lizardite has a 1:1 type structure. When H+ in sulfuric acid solution enters the interlayer domain, Mg–OH on each octahedral sheet reacts fully with H+, and a large amount of Mg can be released from the octahedral sheet. In contrast talc and chlorite are 2:1 type structure minerals, H+ attacks (OH)– on the octahedral sheets by the mineral edge (end surface), resulting in the destruction of the outer octahedral sheet and the dissolution of a small amount of Mg. When pH was 2.0, the dissolution efficiency of Mg in Lz gradually increased with the increase of leaching time, whereas the dissolution efficiency of Mg in Chl and Tlc increases first and then gradually approaches a constant value (Fig. 5a). In the early stage of the leaching process of the Chl and Tlc samples, the dissolution of Mg is gradual, progressing from the outside to the inside at the edge (end surface) (Saldi et al., Reference Saldi, Köhler, Marty and Oelkers2007). Due to the dissolution of Mg, the silica tetrahedral sheets on both sides gradually collapse to the middle, resulting in the dissolution reaction between the solution and Mg–OH (Kameda et al., Reference Kameda, Sugimori and Murakami2009). Therefore, the dissolution efficiency of Mg in 2:1 type minerals is smaller than that of 1:1 type minerals, and the dissolution efficiency of Mg gradually stabilises after the first increase.
Concentrations of Mg, Si and Al in solution (mg/L) after leaching lizardite (Lz), chlorite (Chl) and talc (Tlc) samples in sulfuric acid medium with pH of 2.0, 4.0 and 6.0 for different durations (hours).

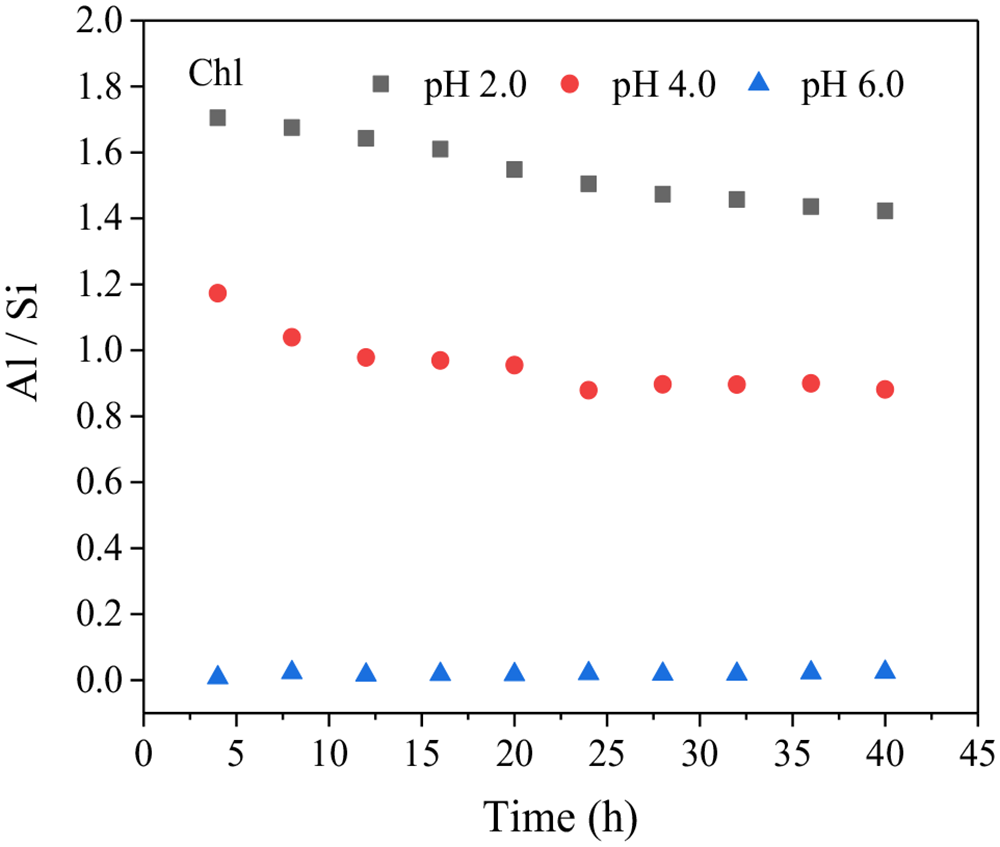
The differential dissolution of Mg in the Chl and Tlc samples at pH of 2.0 and 4.0 occurs primarily due to structural differences between chlorite and talc. In chlorite, the interlayer domain consists of a brucite (Mg–OH) octahedral layer. The presence of H+ ions can react directly with the brucite layer, leading to the destruction of the octahedral sandwich structure and subsequent dissolution of Mg from the chlorite structure. The tetrahedral structure has the phenomenon that Al replaces Si, and Al occupies ∼35% of the tetrahedral sheet. When chlorite reacts with a sulfuric acid solution, because the bond energy of the Al–O bond is smaller than that of Si–O bond (Ikechukwu et al., Reference Ikechukwu, Mabel and Okechukwu2022, Reference Ikechukwu, Mabel and Okechukwu2024), Al on tetrahedral sheets will dissolve out before Si, resulting in defect sites on tetrahedral sheets. H+ enters these defect sites and reacts with octahedral sheets, increasing the dissolution efficiency of Mg. Due to the dissolution of Al from the mineral structure and subsequent hydrolysis reactions, it leads to the disruption of the bridging oxygens that are between the tetrahedral and octahedral sheets, thereby expediting the dissolution process of both sheets (Bickmore et al., Reference Bickmore, Bosbach, Hochella, Charlet and Rufe2001; Li et al., Reference Li, He, Tao, Zhu, Tan, Ji and Zhang2020). The dissolution efficiency of Al is very important in the leaching process of chlorite in an acidic medium. This conclusion can be confirmed by Fig. 6. When the pH is 2.0, Al/Si >1 (Fig. 6) during the mineral reaction, Al is preferentially dissolved from the tetrahedral sheet compared to Si. The dissolution efficiency of Mg in chlorite is obviously higher than that of talc. When the pH is 4.0, Al/Si ≈ 1 during the reaction, indicating that the release amount of Al is equal to that of Si, and the dissolution efficiency of Al decreases, indicating that with the increase of pH, the defect sites on tetrahedral sheets decrease, preventing H+ from entering these defect sites and reacting with octahedral sheets. Therefore, the dissolution efficiency of Mg in chlorite is slightly greater than that of talc. At pH 6.0, Al/Si ≈ 0 and this remained constant during the reaction. This suggests that the dissolution efficacy of Al is negligible and can be disregarded. Consequently, the tetrahedral sheets exhibit a minimal number of defect sites during the water interface reaction process. Therefore, the dissolution efficiency of Mg in chlorite is basically the same as that of talc.
At a pH of 2.0, the percentage of Si dissolution in the Chl sample is greater than that of Lz and Tlc (Fig. 5b) due to the preferential dissolution of Al in many tetrahedral sheets. (Hamer et al., Reference Hamer, Graham, Amrhein and Bozhilov2003). As a result, Si is able to connect to the mineral surface through fewer than three bridging oxygen atoms, causing it to detach from the octahedral sheet more rapidly. Consequently, Si in chlorite dissolves more easily compared to lizardite and talc (Saldi et al., Reference Saldi, Köhler, Marty and Oelkers2007).
The dissolution efficiency of Si in the lizardite sample (Lz) is greater than that for the talc (Tlc), because there is a small amount of Al and Fe replacing Si in the silica tetrahedral sheet of lizardite, whereas there is basically only Si on the tetrahedral sheet of talc, and there is almost no defect site, so the dissolution efficiency of Si in Tlc in the acid medium leaching process is the lowest. By comparing the dissolution efficiency of Si in Tlc when pH values are 2.0, 4.0 and 6.0, it can be assumed that the silicon–oxygen tetrahedron sheet in Tlc is very stable, and that pH values have little or no effect on its dissolution efficiency (Jurinski and Rimstidt, Reference Jurinski and Rimstidt2001). At pH values of 4.0 and 6.0, the dissolution efficiency of Si in Chl and Tlc is the same as that of Mg, which is related to the defect site on the tetrahedral sheet and controlled by the dissolution efficiency change of Al.
Mg/Si content variation in filtrate
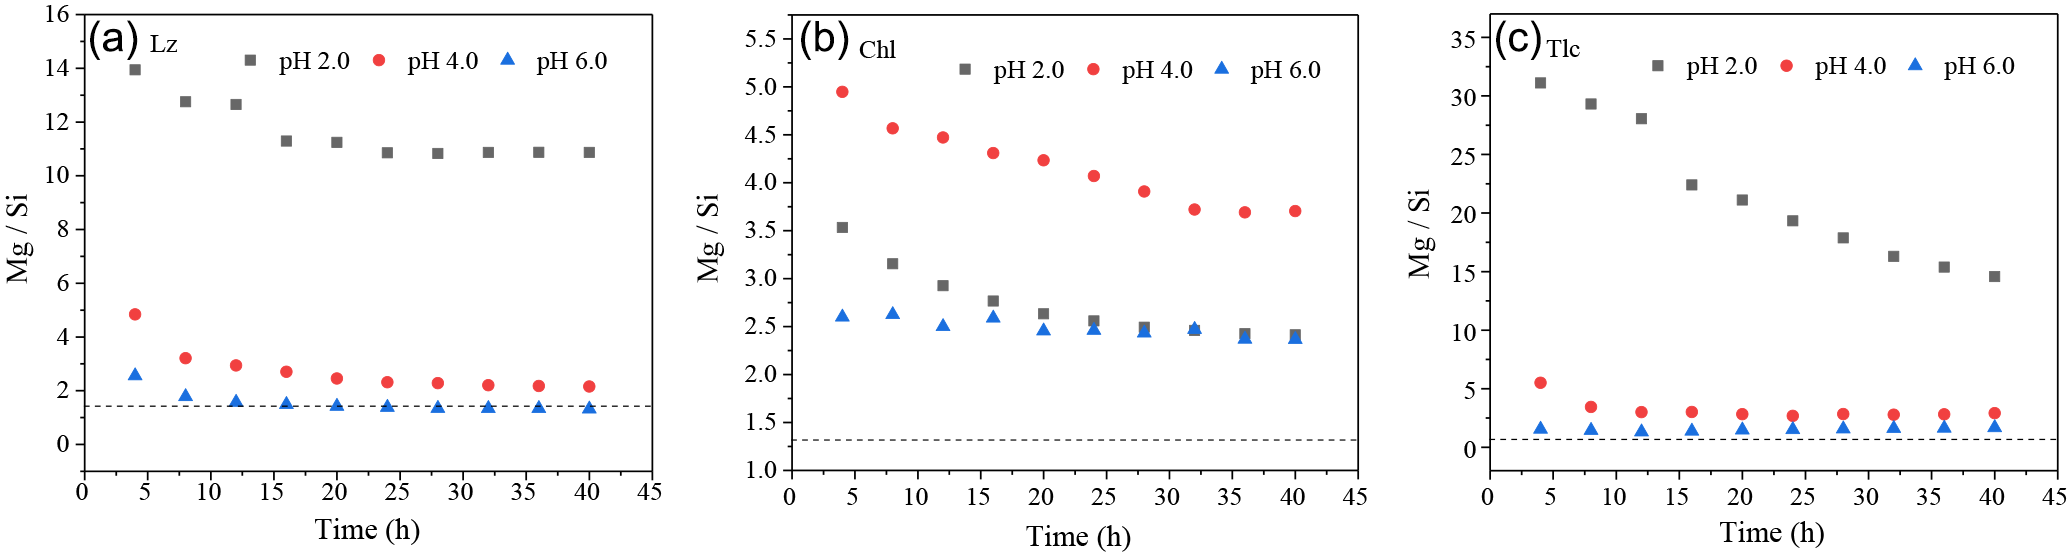
The different pH sulfuric acid solutions all have a substantial influence on the Mg/Si ratio of the Lz, Chl and Tlc samples by leaching, and have different dissolution laws (Fig. 7). The general trend is that in acidic media with pH of 2.0, 4.0 and 6. consistent with other measurements of early silicate dissolution (Lin and Cemency, Reference Lin and Cemency1981; Schott and Berner, Reference Schott and Berner1983, Reference Schott, Berner and Drever1985).
Effect of leaching time of sulfuric acid solution with pH values of 2.0, 4.0 and 6.0 on the dissolution efficiency of Mg and Si in lizardite (Lz), chlorite (Chl) and talc (Tlc) minerals.

Effect of leaching time of sulfuric acid solution at pH 2.0, 4.0 and 6.0 for Al/ Si in chlorite.

With the increase in pH, the Mg/Si ratio of Lz and Tlc is closer to the ideal stoichiometric ratio (Fig. 7a). Under the leaching of an acidic medium with pH of 6.0, the Mg/Si ratio of Lz gradually tends to a constant and reaches the ideal stoichiometric ratio as the reaction progresses, whereas the Mg/Si ratio of Tlc is slightly higher than the ideal stoichiometric ratio. When pH is 2.0, the Mg/Si dissolution ratio of the three minerals is as follows: Tlc > Lz > Chl. Because the tetrahedral sheet of talc is stable, and the tetrahedral sheet of chlorite has the phenomenon of Al replacing Si, the reaction with H+ will produce a large number of defect sites and lead to the dissolution of Si. The Mg/Si ratio of Chl at pH 4.0 is greater than that at pH 2.0 (Fig. 7b). This is different from the dissolution rule for the Mg/Si ratio of Lz and Tlc. This is because with the increase of pH, the dissolution efficiency of Al in Chl greatly decreases, and the defect site on the tetrahedral sheet greatly decreases, resulting in the dissolution efficiency of Si also decreasing. It can be shown that the change of Al dissolution efficiency in Chl will directly affect the size of Si dissolution efficiency, and the change of acidic pH value has a greater impact on the dissolution efficiency of Al.
Dissolution rate of Mg, Si and Al
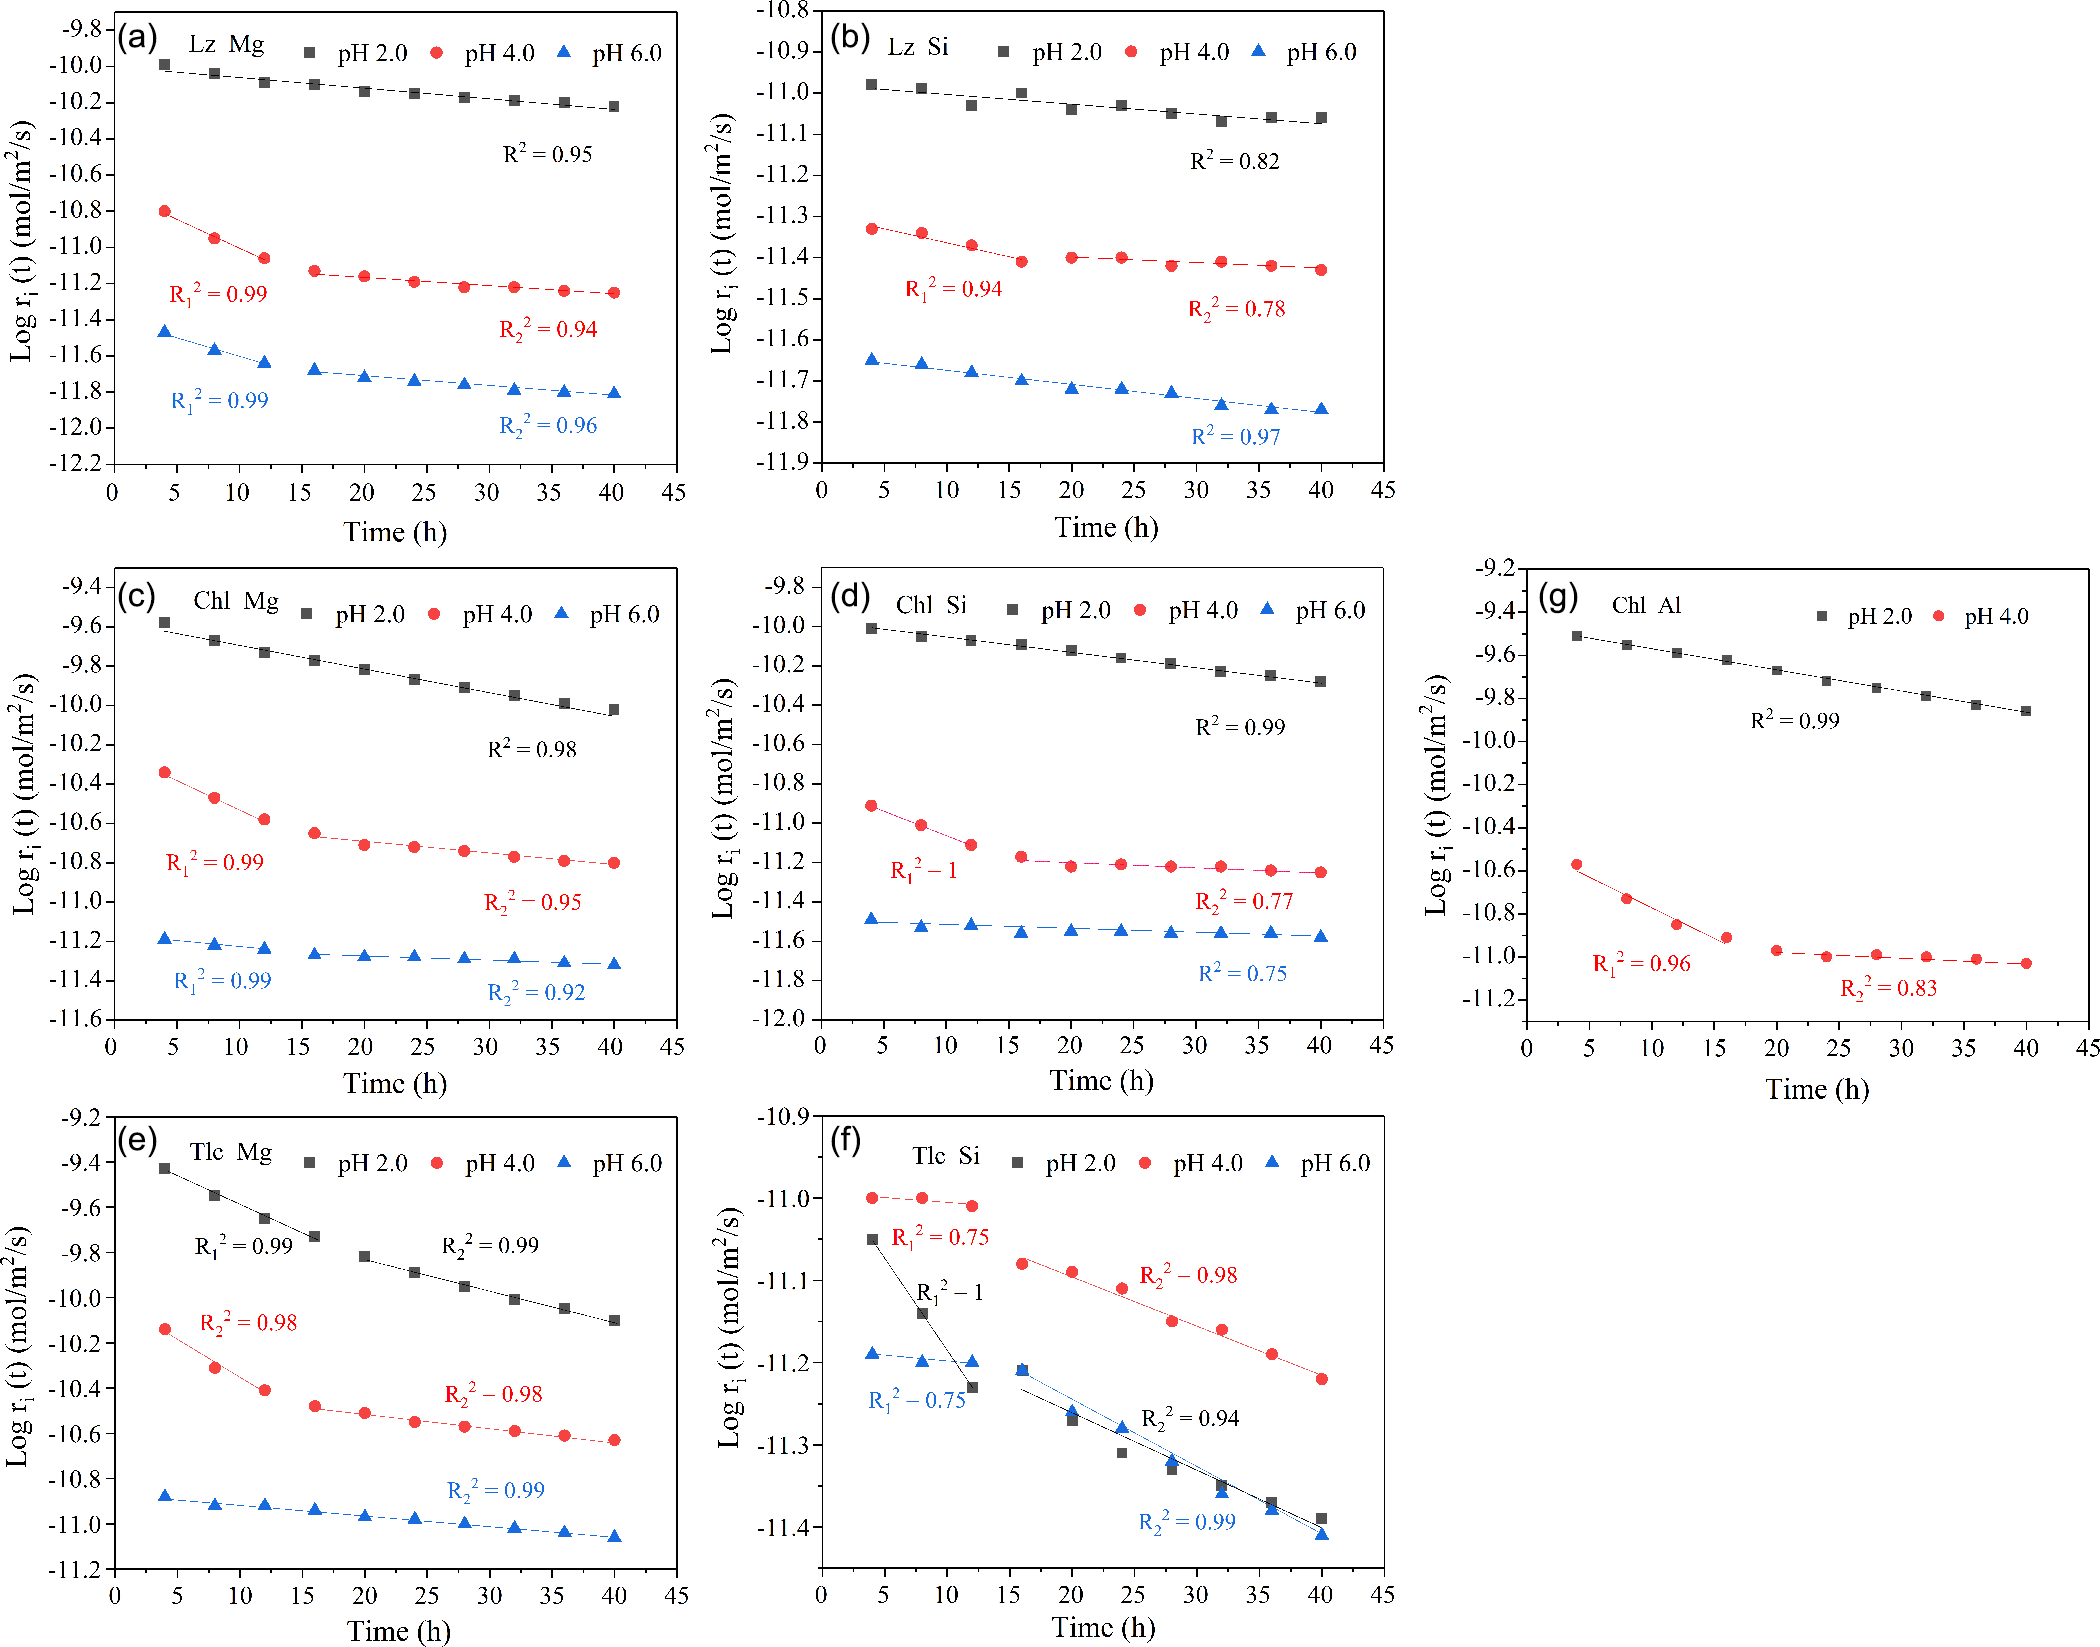
The normalisation of the reaction surface area is typically correlated with the macroscopic dissolving rate of ions in minerals. Various models for reaction surface area are proposed based on different minerals: (1) The reaction surface area is typically considered to be either the BET surface area of the mineral or directly proportionate to the BET surface area (Ganor et al., Reference Ganor, Mogollon and Lasaga1999). (2) The reaction surface area is limited to certain crystal surfaces or is mainly controlled by surface defects (Nagy, Reference Nagy, White and Brantley1995). When studying the dissolution kinetics of clay minerals, a common practice is to normalise the dissolution rate to their specific surface area (e.g., either partial or total surface including interlayer, external surface or edge surface; Bibi et al., Reference Bibi, Singh and Silvester2011; Daval et al., Reference Daval, Hellmann, Saldi, Wirth and Knauss2013). Figure 8 shows the dissolution rates of Mg, Si and Al in acidic media with different pH using the BET surface area as the reaction surface area. The BET specific surface area test results were 17.8 m2/g for Lz, 4.1 m2/g for Chl, and 3.5 m2/g for Tlc.
Although there are differences in mineral composition, such as the highest Mg content in lizardite and the highest Si content in talc, the results of the study showed that the dissolution rate of these minerals has a similar relationship with time and pH of the medium. In general, the dissolution rate of Mg and Si in lizardite, chlorite and talc decreased with the increase of time when pH values were kept at 2.0, 4.0 and 6.0. This may be due to the dissolution of fine particles and the preferential reaction of high surface activation energy regions or defect sites on large granular minerals during the initial phase of dissolution. For 2:1 type minerals (Chl and Tlc), the initial dissolution rate was higher, and the dissolution rate of Mg was higher than that of Si, due to the rapid ion exchange reaction between H+ in the acidic medium and Mg in the outer layer of the octahedral sheet (Kohler et al., Reference Kohler, Bosbach and Oelkers2005; Bibi et al., Reference Bibi, Singh and Silvester2011). Due to the high surface area of lizardite, the dissolution rate of Mg is always lower than that of chlorite and talc after normalisation.
Effect of leaching time of sulfuric acid solution at different pH values on Mg/Si in the filtrate of (a) lizardite (Lz), (b) chlorite (Chl) and (c) talc (Tlc) minerals. The horizontal line represents the ideal stoichiometric ratio.

When the pH is 2.0, the dissolution rate of Mg in Tlc presents a two-stage linear decrease trend during the reaction, which is different from the dissolution rate of Mg in Lz and Chl. This is because the dissolution of Mg in Tlc proceeds gradually from the outside to the inside at the edge (outer surface) during the reaction. Due to the dissolution of Mg, the silica tetrahedral sheet on both sides gradually collapses to the middle. As a result, the dissolution reaction between the solution and Mg-OH is blocked, so the dissolution rate of Mg gradually decreases. When pH is 4.0 for all three samples, Lz, Chl and Tlc, the dissolution rate of Mg has a rapid decrease stage in the first 12 hours, and then it gradually decreases, showing a linear decrease trend in two stages during the reaction. It can be observed that the dissolution rate of Mg from Lz and Chl is greatly affected by the increase of pH, that is, the dissolution of Lz and Chl are more sensitive to pH. The dissolution rate of Si in Lz and Chl has the same dissolution law in acidic media with different pH values (Fig. 9), while the dissolution rate of Si in Tlc is almost unaffected by the pH value (Jurinski and Rimstidt, Reference Jurinski and Rimstidt2001). At pH 2.0 and 4.0, the dissolution laws of Al (Fig. 8g), Mg and Si in Chl are the same (note – when pH = 6.0, the dissolution of Al in Chl was found to be negligible).
Effect of leaching time of sulfuric acid solution at different pH values on the dissolution rate of Mg, Si and Al in lizardite (Lz), chlorite (Chl) and talc (Tlc) (logarithmic form).

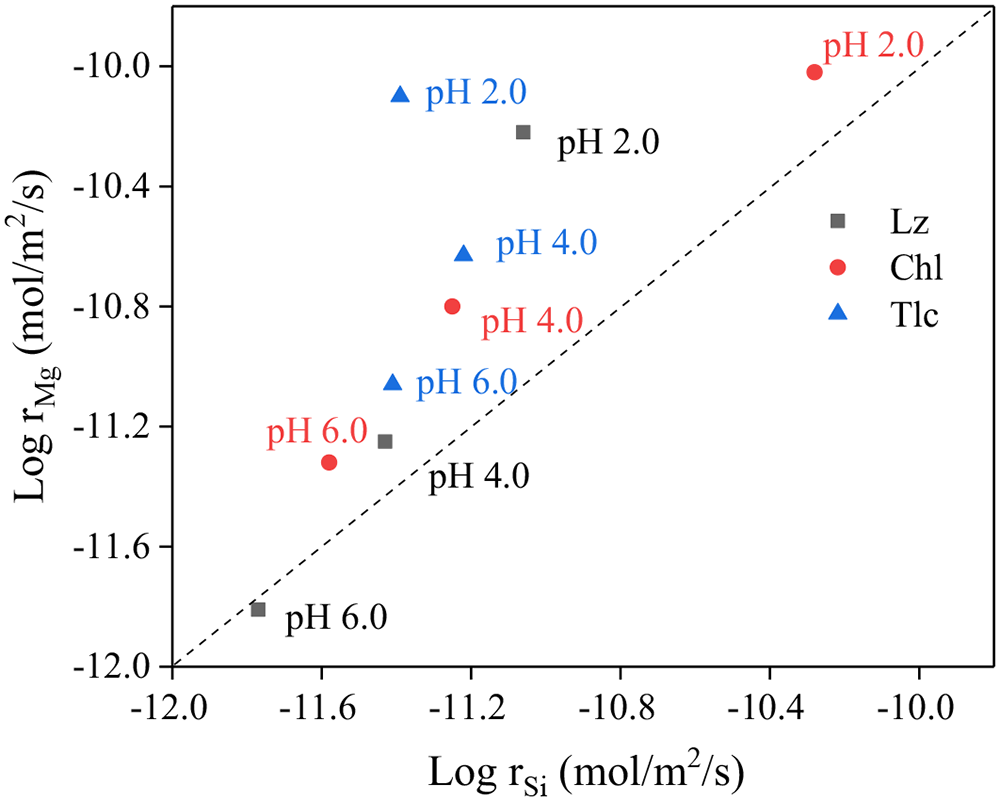
The logarithm of the dissolution rates of Mg and Si compared in sulfuric acid solutions of different pH values (the diagonal line corresponds to equal dissolution).

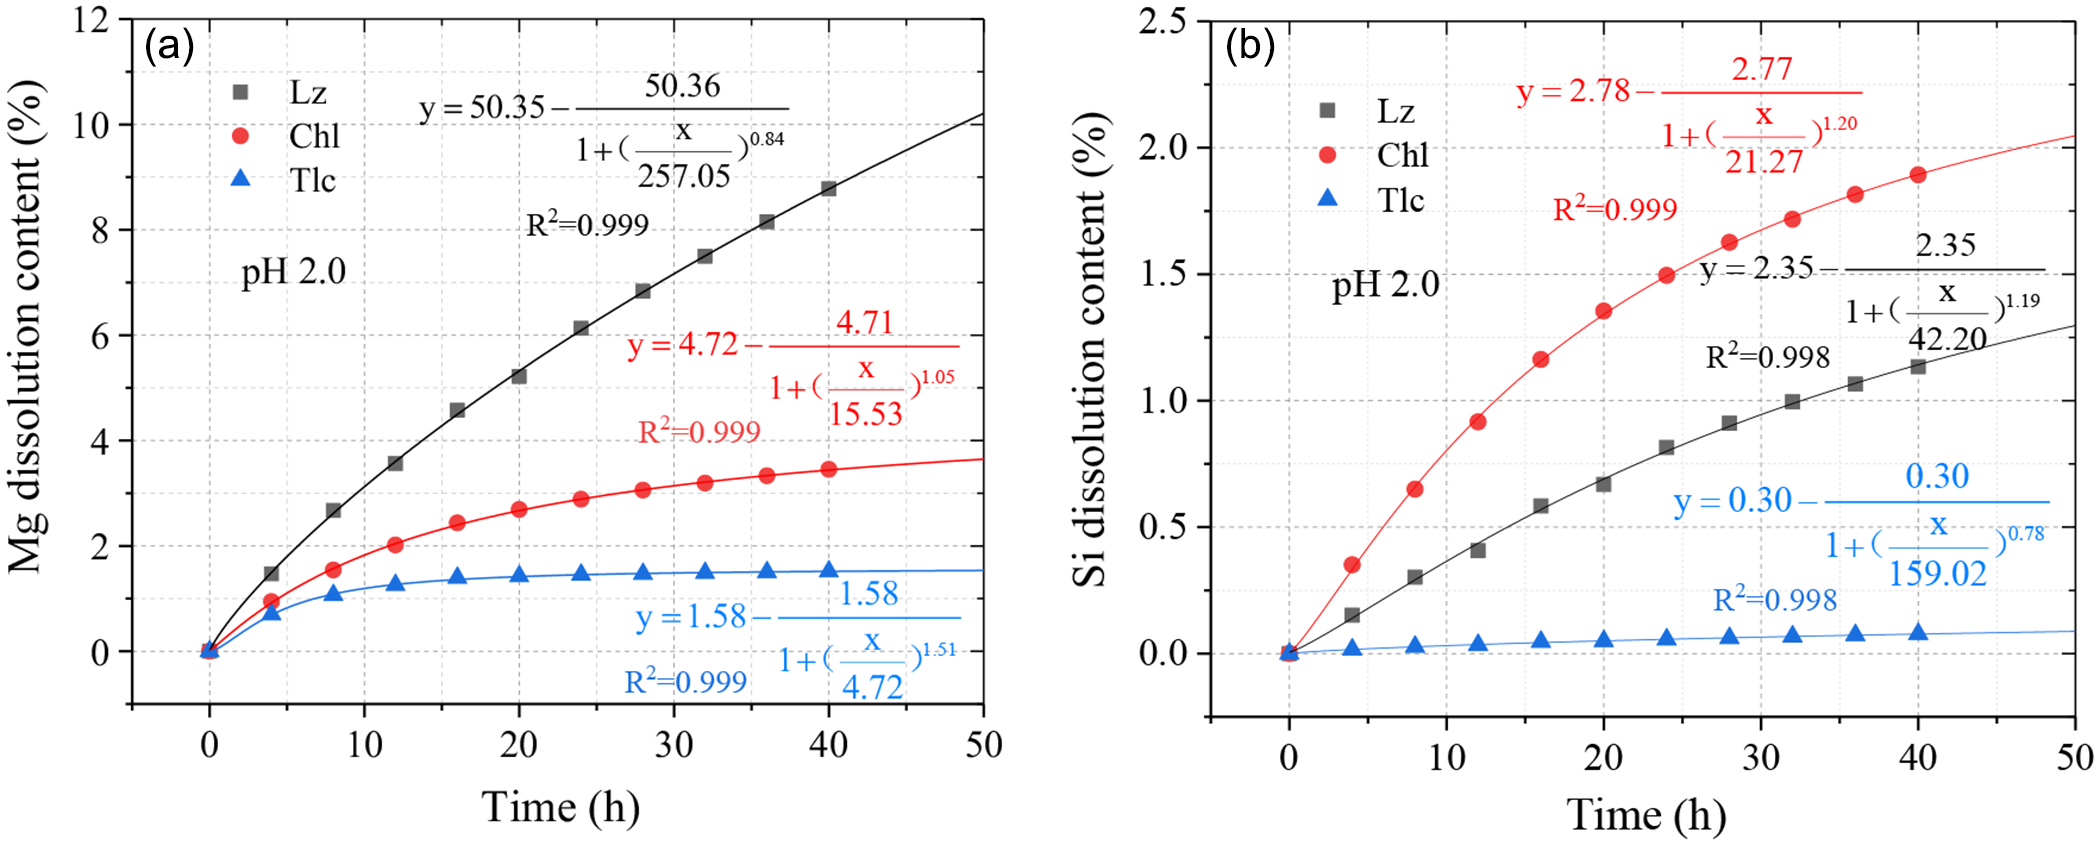
Logistic model that was used to simulate the influence of sulfuric acid leaching time for the pH value of 2.0 on the dissolution efficiency of Mg and Si in Lz, Chl and Tlc.

Previous studies on the dissolution reactions of 1:1 type and 2:1 type layered silicates in acidic media showed that cations in octahedral sheets were more easily released into solution than those in tetrahedral sheets (Kalinowski and Schweda, Reference Kalinowski and Schweda2007; Rozalen et al., Reference Rozalen, Huertas, Brady, Cama, Garcia-Palma and Linares2008; Krupskaya et al., Reference Krupskaya, Zakusin, Tyupina, Dorzhieva, Zhukhlistov, Belousov and Timofeeva2017; Li et al., Reference Li, Lu, Nkoh, Hong and Xu2022). This is because the Mg–O bond is more likely to break than the Si–O bond, that is, the dissolution efficiency and dissolution rate of Mg in the octahedral sheet are greater than that of Si in the tetrahedral sheet. The dissolution laws found in this investigation for lizardite, chlorite and talc when leached in acidic media are consistent with previous studies.
Model study on dissolution rate of Mg and Si
The dissolution efficiencies of Mg and Si in lizardite, chlorite, and talc were simulated using an open mineral–water interface reaction system (Fig. 10). The simulations were conducted at a pH of 2.0, and various models were compared. Ultimately, it was determined that the Logistic model effectively replicated the variations in dissolving percentages of Mg and Si in the three minerals as time progressed. The applicability of the Logistic function to investigations relating to clay minerals has been confirmed in previous studies (Zhang et al., Reference Zhang, Chen, Ma and Zhan2013; Chassagne, Reference Chassagne2021; Chassagne and Safar, Reference Chassagne and Safar2020; Ali and Chassagne, Reference Ali and Chassagne2022). The Logistic function accurately fits the curve and shows strong agreement with the experimental values (R 2 ≥ 0.998). The formula derived from curve fitting can be used to compute the dissolving percentages of Mg and Si in the Lz, Chl and Tlc samples at various reaction durations. Furthermore, it can also forecast the highest levels of dissolution for Mg and Si among the three minerals when exposed to sulfuric acid solution with a pH of 2.0. An illustration is given in Fig. 10a, Lz attains a condition of equilibrium when the proportion of Mg that dissolves is precisely 50.35%, however, Chl and Tlc, both belonging to the 2:1 type minerals, have maximum solubility percentages of Mg of just 4.72% and 1.58% respectively. These percentages are significantly lower than those of 1:1 type lizardite. The maximum dissolution efficiency of Si in Lz, Chl and Tlc is less than Mg (Fig. 10b), and the difference of the maximum dissolution efficiency of Si for the minerals with a different layer structure is small. The Si in Tlc exhibits exceptional stability, with a maximum dissolution efficiency of merely 0.30%. In contrast for a pH of 4.0 or 6.0, the concentration of H+ ions is low and the reaction time is short. As a result, at the first stage of the dissolving process of Mg and Si in minerals, there is no suitable condition for establishing a model. Therefore, this study has only established a model to simulate the dissolution efficiencies of Mg and Si in lizardite, chlorite and talc at a pH of 2.0.
The investigation of the reaction kinetics model for lizardite, chlorite, and talc can directly illuminate the chemical reaction processes taking place at the mineral–water interface in an acidic medium, and contribute to a better understanding of the mechanism of interaction between the two interfaces. In addition to forecasting the next experimental studies, the model’s development can offer a theoretical direction for the ion dissolution and migration of minerals in aqueous media.
Conclusions
These leaching studies demonstrated that pH values and reaction times have a significant impact on both the dissolution efficiencies and dissolution rates for lizardite, chlorite and talc. Furthermore, they also result in the differential dissolution of Mg and Si components. The dissolution efficiency of Mg in lizardite is higher than that of chlorite and talc in an acidic environment with pH values of 2.0, 4.0 and 6.0. The dissolution efficiency of Mg in chlorite is greater than that of talc in an acidic environment with pH values of 2.0 and 4.0. At a pH of 6.0, the dissolution efficiency of Mg in chlorite and talc is basically the same. This phenomenon is related to the defect site on the tetrahedral sheet of chlorite and is controlled by the change of the dissolution efficiency of Al.
The dissolution of lizardite, chlorite and talc in a sulfuric acid solution with varying pH significantly affects the Mg/Si ratio and the speeds at which Mg and Si dissolve, and follows distinct dissolving patterns. The general trend is that the Mg/Si ratio can be observed to decrease gradually with the increase of reaction time in acidic media with pH of 2.0, 4.0 and 6.0. The Mg/Si ratio of lizardite and talc is closer to the ideal stoichiometric ratio with the increase of pH. The dissolution rates of Si and Mg in lizardite, chlorite and talc decrease with the increase of reaction time in an acidic medium (pH values of 2.0, 4.0 and 6.0), and there are two linear dissolution trends for the different pH. One reason is the dissolution of fine particles and the preferential reaction of high surface activation energy regions or defect sites on large-particle minerals, and the other reason is the structural difference between 1:1 type minerals and 2:1 type minerals. That is, the rapid ion exchange reaction between H+ in the acidic medium and Mg located in the outer layer of the octahedral sheet of 2:1 type minerals.
A model was established to simulate and forecast the dissolution efficiencies of Mg and Si in lizardite, chlorite and talc. The highest dissolving percentages of chlorite and talc as 2:1 type minerals are determined to be only 4.72% and 1.58%, respectively. These values are significantly lower than the dissolution efficiency (50.36%) of 1:1 type lizardite.
Supplementary material
The supplementary material for this article can be found at https://doi.org/10.1180/mgm.2024.57.
Acknowledgements
This study was supported by the National Natural Science Foundation of China (Grant No. 42072048).
Competing interests
The authors declare none.