Introduction
Hardware-based, neuro-inspired information processing offers efficient ways of data manipulation well beyond traditional von-Neumann architectural paradigms. The basic neural information processing and neuroplasticity functions were mimicked over the past years with solid-state microelectronic devices. Functions such as neural potentiation and depression, spike time-dependent plasticity, and short-term to long-term memory transition were implemented at a single device level.[Reference Kuzum, Jeyasingh, Lee and Wong1–Reference Jo, Chang, Ebong, Bhadviya, Mazumder and Lu4] Over the past years, organic materials have also entered the realm of neuromorphic devices.[Reference Alibart, Pleutin, Guérin, Novembre, Lenfant, Lmimouni, Gamrat and Vuillaume5, Reference van de Burgt, Lubberman, Fuller, Keene, Faria, Agarwal, Marinella, Talin and Salleo6] Recently, the rise of organic bioelectronics has made available various devices for interfacing with living systems,[Reference Rivnay, Owens and Malliaras7–Reference Berggren and Richter-Dahlfors9] with the organic electrochemical transistor (OECT) being the benchmark device of the field.[Reference White, Kittlesen and Wrighton10, Reference Bernards and Malliaras11] Apart from bioelectronics-related applications, OECTs also offer attractive characteristics suitable for the implementation of neuro-inspired devices, including low-power consumption, the ability to operate in the electrolyte or biologic environment, and their potential integration in flexible and stretchable substrates.
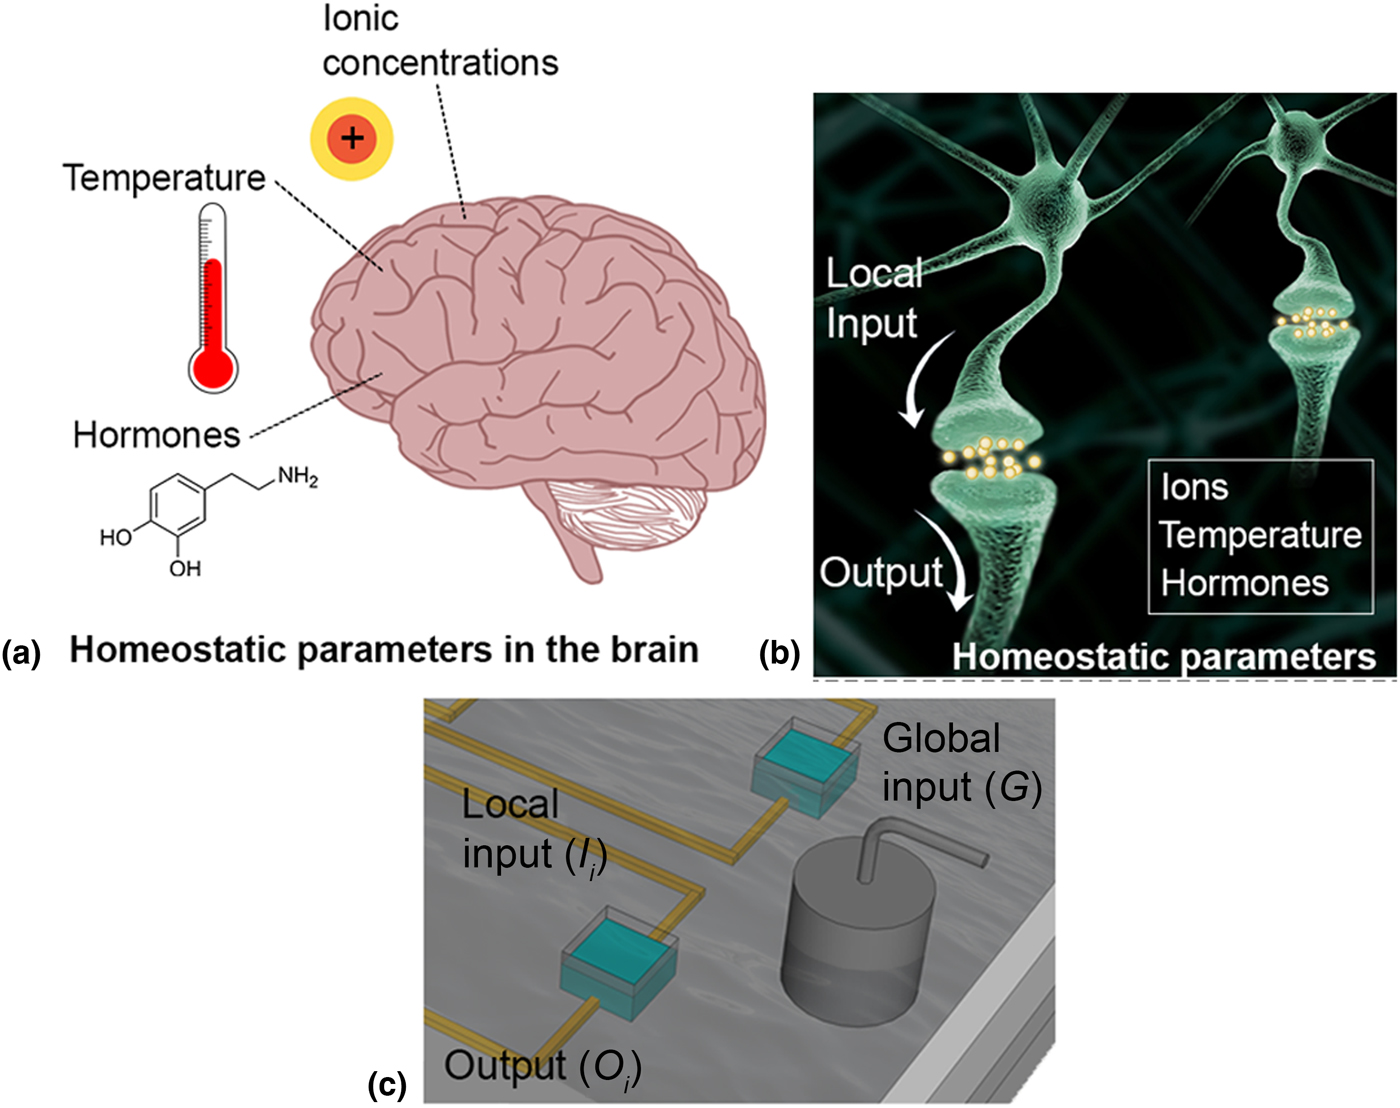
Neuro-inspired paradigms of information processing have been recently demonstrated with OECTs, including various forms of neuroplasticity and spatially correlated functions.[Reference Gkoupidenis, Schaefer, Garlan and Malliaras12–Reference Gkoupidenis, Rezaei-Mazinani, Proctor, Ismailova and Malliaras15] The operation of OECTs in electrolytes can lead to novel features suitable for neuromorphic architectures.[Reference Gkoupidenis, Koutsouras and Malliaras16] More specifically, a shared electrolyte for an array of OECTs permits the device-to-device communication through the electrolyte, as well as the array control with a global electrode. Therefore, this mode of operation enables the use of electrolytes as connectivity media, and as global or homeostatic regulation parameters.[Reference Gkoupidenis, Koutsouras and Malliaras16] Although homeostatic regulation is biologically realistic and has various implications in the actual neural processing, it is barely addressed in neuromorphic device architectures. Over the past years, the majority of research in neuromorphic devices has been focused on the emulation of various synaptic plasticity functions. Although these functions are the basic building blocks for implementing bio-inspired models of neural processing, there are many other biology-relevant phenomena, which are crucial for neural processing including homeoplasticity. In the actual neural environment, for example, homeostatic parameters, such as temperature and ionic/hormonal concentrations (Fig. 1), offer a normalization mechanism that stabilizes the activity of large neural ensembles and prevent their over- and hyperactivation.[Reference Turrigiano and Nelson17, Reference Abbott and Nelson18] Furthermore, global potential oscillations offer windows of activation in neural ensembles that “phase lock” the activity of neurons and this phenomenon is believed to contribute to the propagation of synchrony in different layers of neurons.[Reference Gupta, Singh and Stopfer19]
(a) Schematic representation of homeostatic parameters in the brain. (b) In the brain, homeostatic parameters regulate the overall activity of large neural ensembles. (c) Schematic representation of the device architecture. The architecture consists of a grid of devices. Every device has a local input I i, a local output O i, and the whole grid is addressed with a global input G.
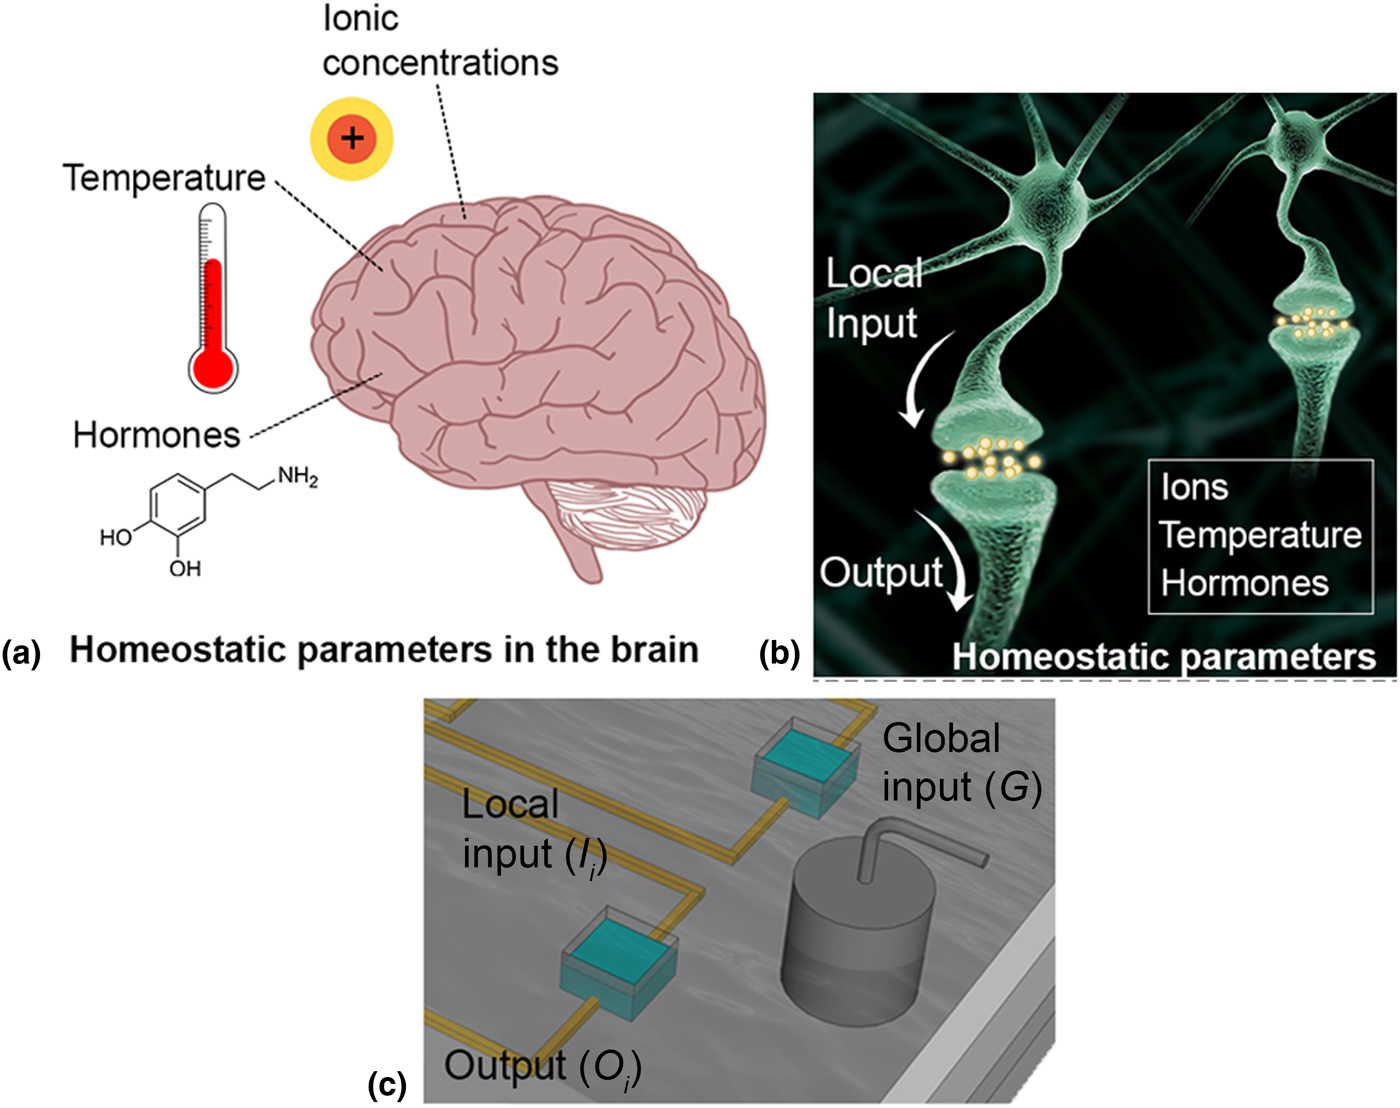
This work follows our previously published work on global regulation of a grid of PEDOT:PSS [poly(3,4-ethylenedioxythiophene):poly(styrene sulfonate)]-based OECTs.[Reference Gkoupidenis, Koutsouras and Malliaras16] As also previously reported, the device grid is immersed in a common electrolyte in order to achieve global control of the overall grid (Fig. 1). Here we demonstrate that in a single device, this global control is “multiplicative,” a characteristic of global regulation which modulates neuronal gain in the actual neural environment. By analyzing the statistics of the grid, we show that under the influence of the global electrolyte, the devices operate similarly to an individual device, a behavior that demonstrates clearly the concept of electrolytes as global parameters. We also show that global metrics such as the global transconductance can be used to represent the collective behavior of the grid. These results show that gating OECTs with electrolytes offer a straightforward way to emulate homeostatic regulation, a phenomenon that is not easily accessible with solid-state technologies.
Experimental section
Device fabrication
The fabrication process of the device grid is described thereafter: The grid of the devices was made using standard microfabrication techniques. As substrates, 26 mm × 76 mm glass slides were used. The contact lines were defined by evaporating a 10 nm Cr and a 100 nm Au layer on top of prepatterned photoresist and a subsequent soaking in an acetone/isopropanol bath to remove the excess material. To protect the contact lines from the electrolyte, two parylene C layers were deposited on top, with 2 µm thickness each. The first was deposited on a surface treated with silane to enhance adhesion with the substrate and a thin 2% soap solution layer was spin-coated before the second evaporation to act as an antiadhesive promoter. The active area of each device was W × L = 50 µm × 50 µm. PEDOT:PSS was then spin-coated from the solution [Clevios PH 1000 from Heraeus Holding GmbH, with 5 wt.% ethylene glycol, 0.1 wt.% dodecyl benzene sulfonic acid, and 1 wt.% of (3-glycidyloxypropyl)trimethoxysilane]. Three subsequent spin-coating steps with varying rotation speeds of 1.500, 650, and 650 rpm, respectively, yielded a film thickness of ~500 nm. For patterning these features, a second photolithographic step was used. PEDOT:PSS spin coating was followed by a soft-bake step at 110 °C for 1 min, then a peel-off of the upper parylene C layer, and finally a hard-bake step at 140 °C for 60 min.
Electrical characterization
Following the above-mentioned procedure, a grid of 4 × 4 PEDOT:PSS-based devices was fabricated. For electrical characterization, the grid was immersed in a 100 mM NaCl common electrolyte and was gated with an Ag/AgCl electrode. In all electrical measurements, a pulse was applied at the input of a device and the current was measured at its output for different global gate voltages (DC or AC). The output current was measured using a National Instrument PXIe-1062Q system. The OECT was biased with a PXIe-4145 source measure unit that was simultaneously recording output current with a sampling rate of 1 kHz. Gate voltages were generated by a National Instrument USB-6259. Both gate voltages and output current measurements were internally triggered by the PXIe system. The acquisition system was monitored by custom-made LabVIEW software.
Results
A simplified sketch of the device structure is depicted in Fig. 1(c) (for simplicity purposes, only two devices of the grid are depicted). One terminal of the device is regarded as a local input I i and the other terminal as an output O i. In addition to that, there is also a gate electrode which is regarded as the global input G. As will be shown thereafter, the gate electrode is used to emulate homeoplasticity phenomena in analogy to a neural environment [Figs. 1(a) and 1(b)].
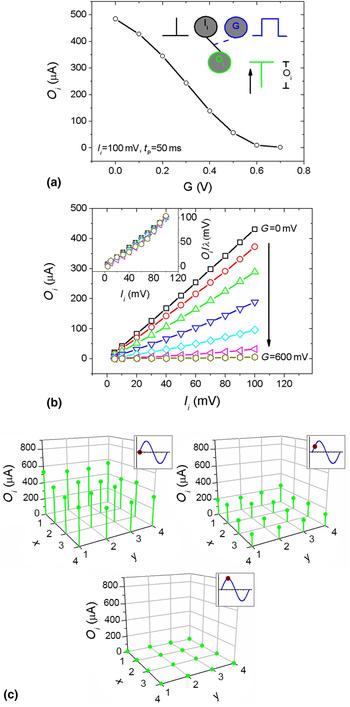
In this configuration, voltage pulses are applied at the local input (pulse amplitude 100 mV and width 50 ms) and the resulting current amplitude is measured at the local output O i of every device. This procedure is repeated for different DC global gate voltages (0–700 mV). Figure 2(a) shows the single device behavior, presented as output amplitude O i versus the global gate voltage G. By polarizing the electrolyte, the local input/output (I/O) transmission is gradually suppressed and for large positive global voltages (G ≥ 600 mV), due to the dedoping process of the PEDOT:PSS channel with the influence of the gate electrode G.[Reference Bernards and Malliaras11] Figure 2(b) shows the output O i versus the amplitude of the input pulse I i (5–100 mV, pulse width t P = 50 ms) at the I i terminal, for different global voltages G (0–600 mV). Every O i versus I i characteristic can be approximated with a linear fit (O i = λ·I i), and the slope normalized output characteristics, O i/λ versus G, are also presented in the inset of Fig. 2(b), which merge into a single curve. In terms of transistor characteristics, this behavior is attributed to the fact that the device is effectively operated on the linear regime and thus operates as a voltage-controlled resistor. The latter behavior suggests that the gate electrode (i.e., the modulatory input) creates a multiplicative, rather than subtractive scaling of the I/O transmission, at the single device level.[Reference Abbott and Nelson18, Reference Miller and MacKay20, Reference Turrigiano, Leslie, Desai, Rutherford and Nelson21] In multiplicative scaling, the slope of the I/O characteristic changes and thus the gain as well [also shown in Fig. 2(b)].[Reference Mitchell and Silver22] Subtractive, or additive scaling leads to an offset of the I/O characteristic, therefore without altering the gain.[Reference Mitchell and Silver22] In analogy with biologic scaling, the electrolyte forces a multiplicative scaling due to the modulation of the I/O slope (or gain) under the influence of the global input (i.e., gain is decreased by increasing G). It should be referred that multiplicative scaling has also been recently reported on graphene oxide synaptic transistors.[Reference Wan, Zhu, Liu, Feng, Liu, Cao, Xiao, Shi and Wan23] As will be presented below, due to the fact that all devices are immersed in a common electrolyte, this scaling is global and thus affects the entire grid of the devices.
(a) Amplitude of the output current O i as a function of the global DC gate voltage G (0–700 mV). (b) Amplitude of O i as a function of the amplitude of the input voltage pulse I i (5–100 mV) for different global voltages G (0–600 mV). The inset shows the slope normalized output response O/λ as a function of I i, and suggests a multiplicative scaling behavior. (c) Spatial output current mapping of O i, at different moments of time of the AC global signal (f G = 1 mHz and amplitude G = ± 600 mV) when a voltage pulse is applied at every local input I i (t P = 50 ms, I i = 100 mV). Every graph corresponds to a moment of time of the AC signal (inset).
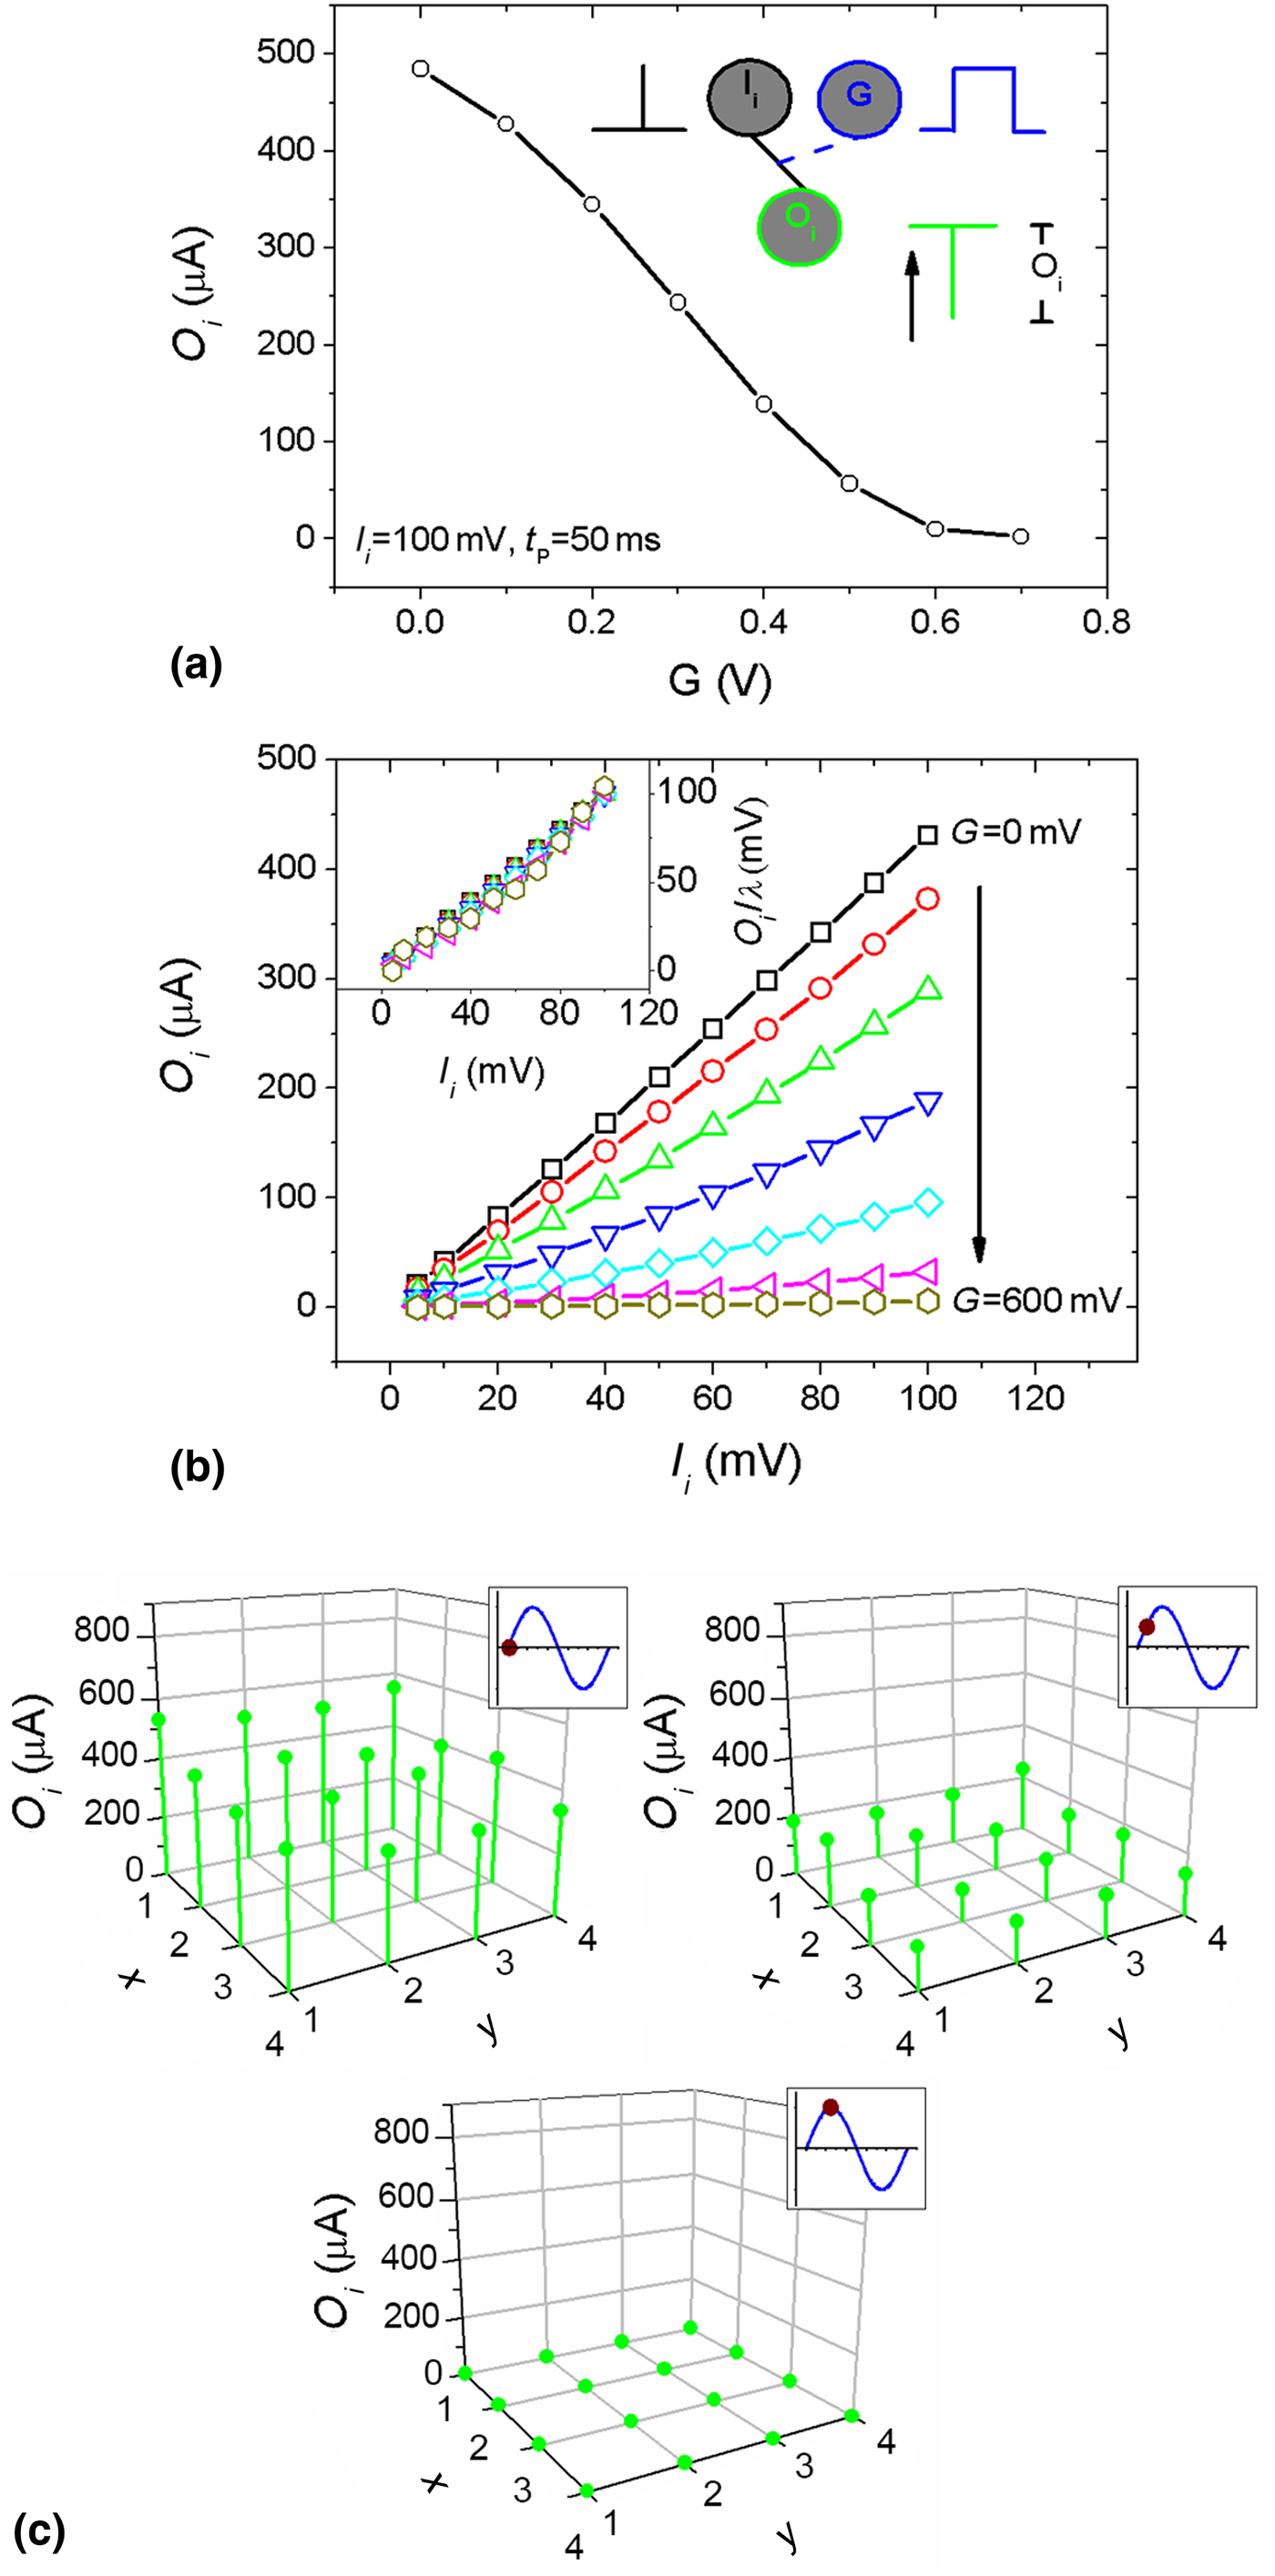
The spatial mapping of the current amplitude of every output O i on the 4 × 4 grid, for a global, AC signal at the gate electrode is depicted in Fig. 2(c). A train of pulses is applied at the local input of every device (amplitude of 100 mV, width of 50 ms, period of 5 s), a global AC signal is applied at the gate electrode (amplitude of ±600 mV, frequency of 1 mHz), and the resulting amplitude of the output response O i of every device is measured as a function of time. It should be noticed that the response of the device grid is independent of the position of the gate electrode on the grid.[Reference Gkoupidenis, Koutsouras and Malliaras16] This behavior was also confirmed with impedance spectroscopy measurements, by placing the gate electrode at different positions on the grid. The spatial mapping of the output amplitude O i of the grid, at different moments of time of the global AC signal, is depicted in Fig. 2(c). The I/O transmission of the 4 × 4 grid is also modulated with the influence of a global, AC signal at the G terminal. The gate electrode (or the electrolyte) can be regarded as a homeostatic parameter, which forces a global behavior to the device grid. This global behavior is attributed to the common potential that the electrolyte obtains through the gate electrode. The global AC signal, in this case, is considered as synchronization function, or a global “clock,” and the I/O transmission can be modulated with a periodicity. Therefore, this global “clock” provides an activation window to the device grid in analogy to the low-frequency global oscillations in the brain.[Reference Buzsáki and Draguhn24]
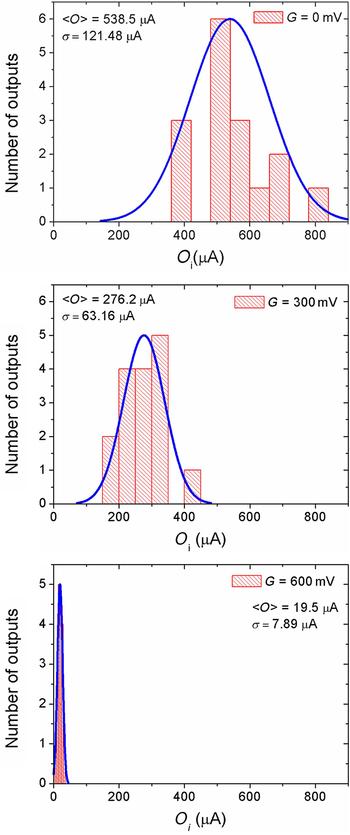
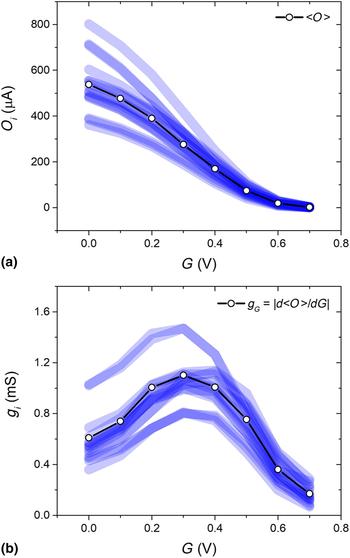
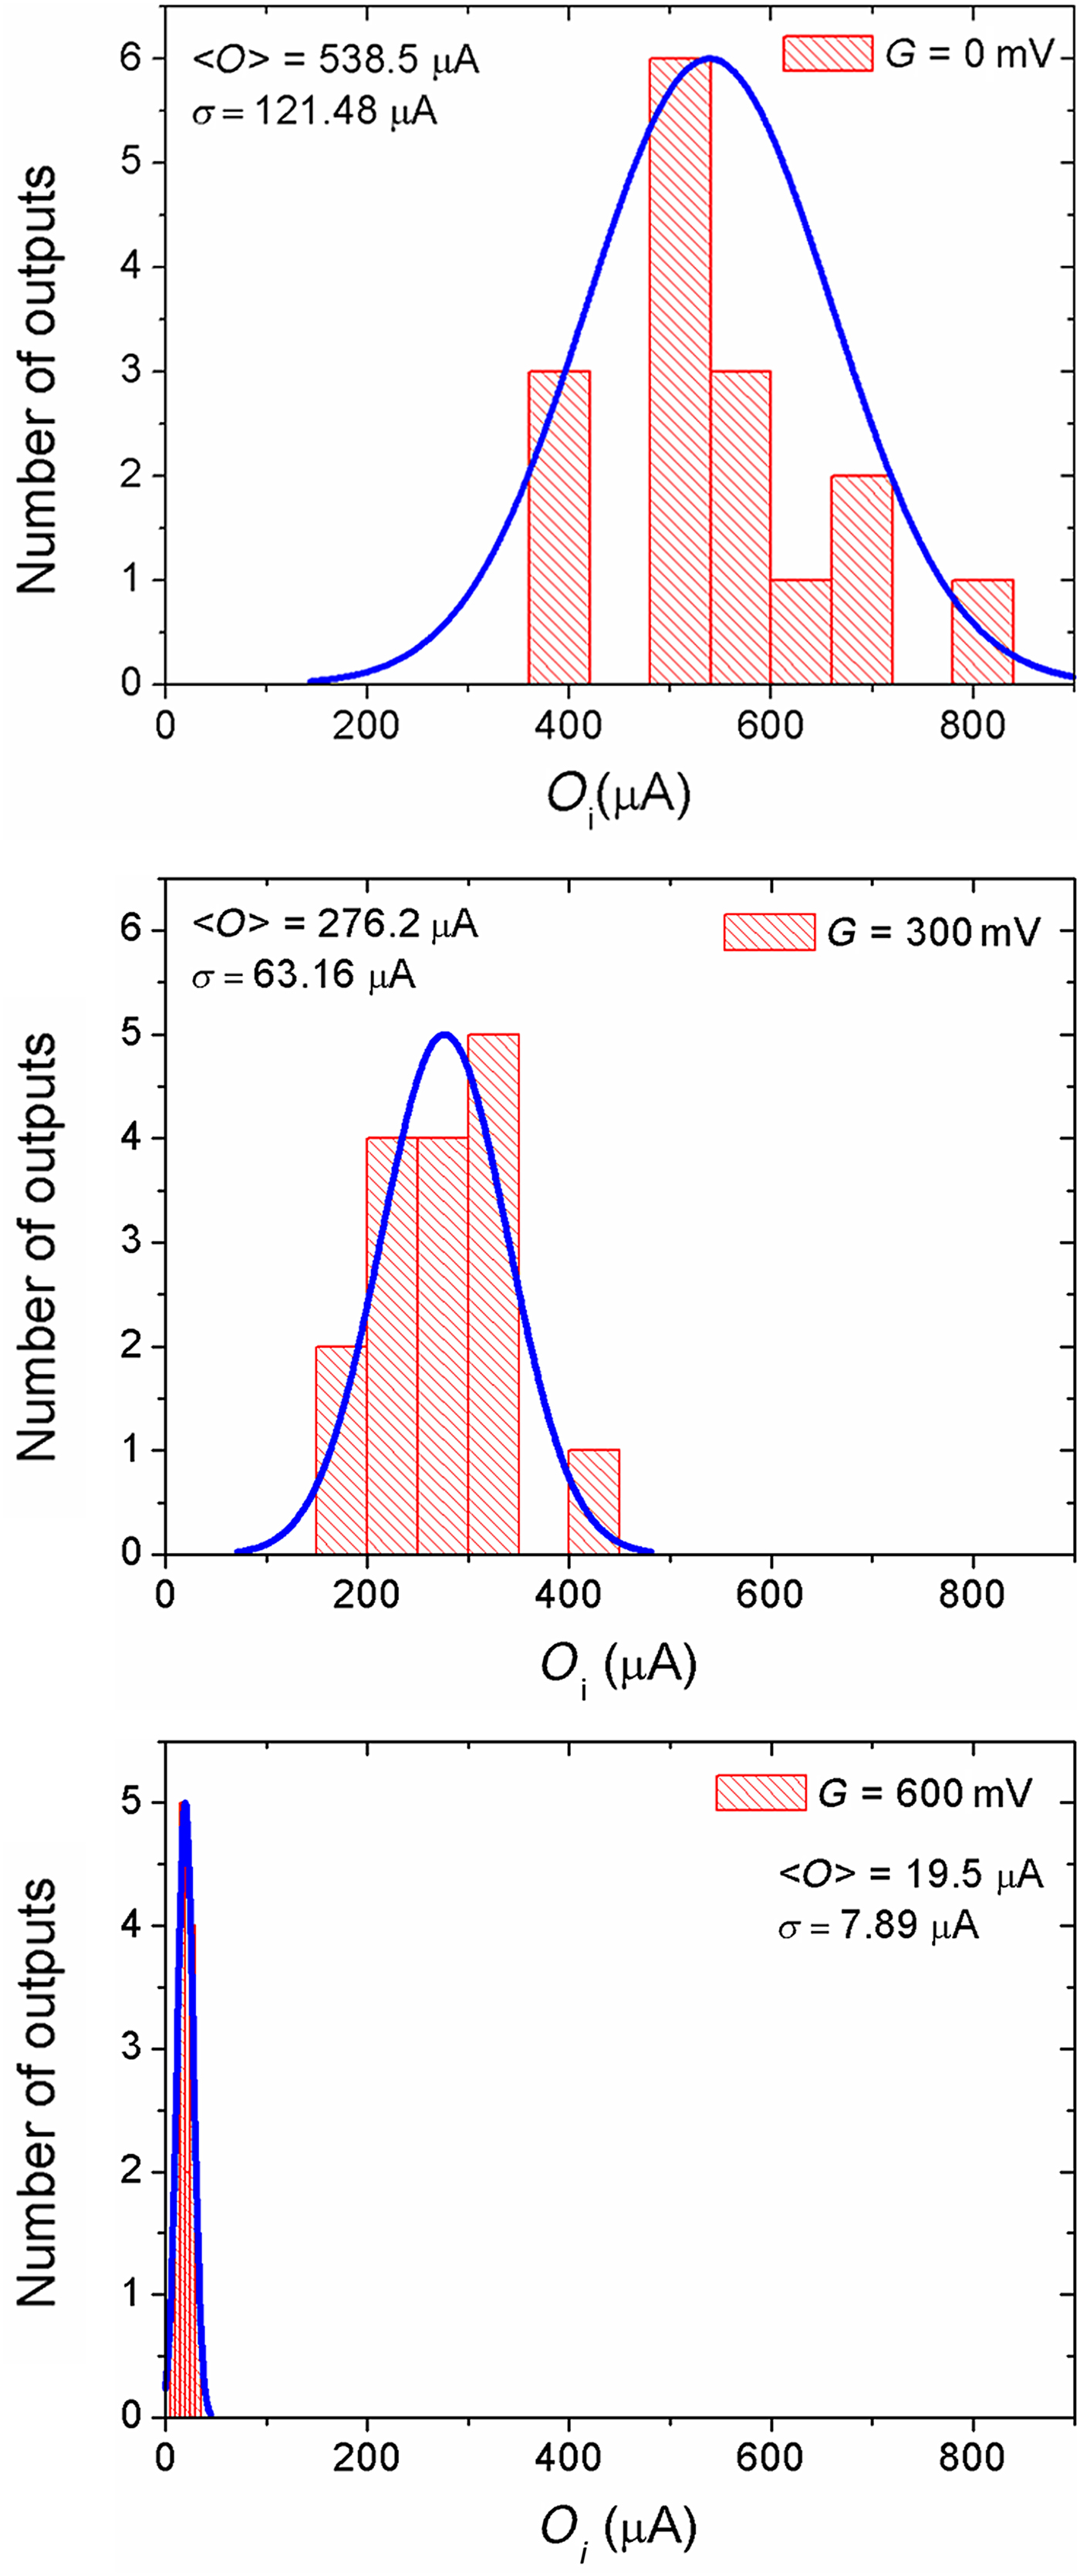
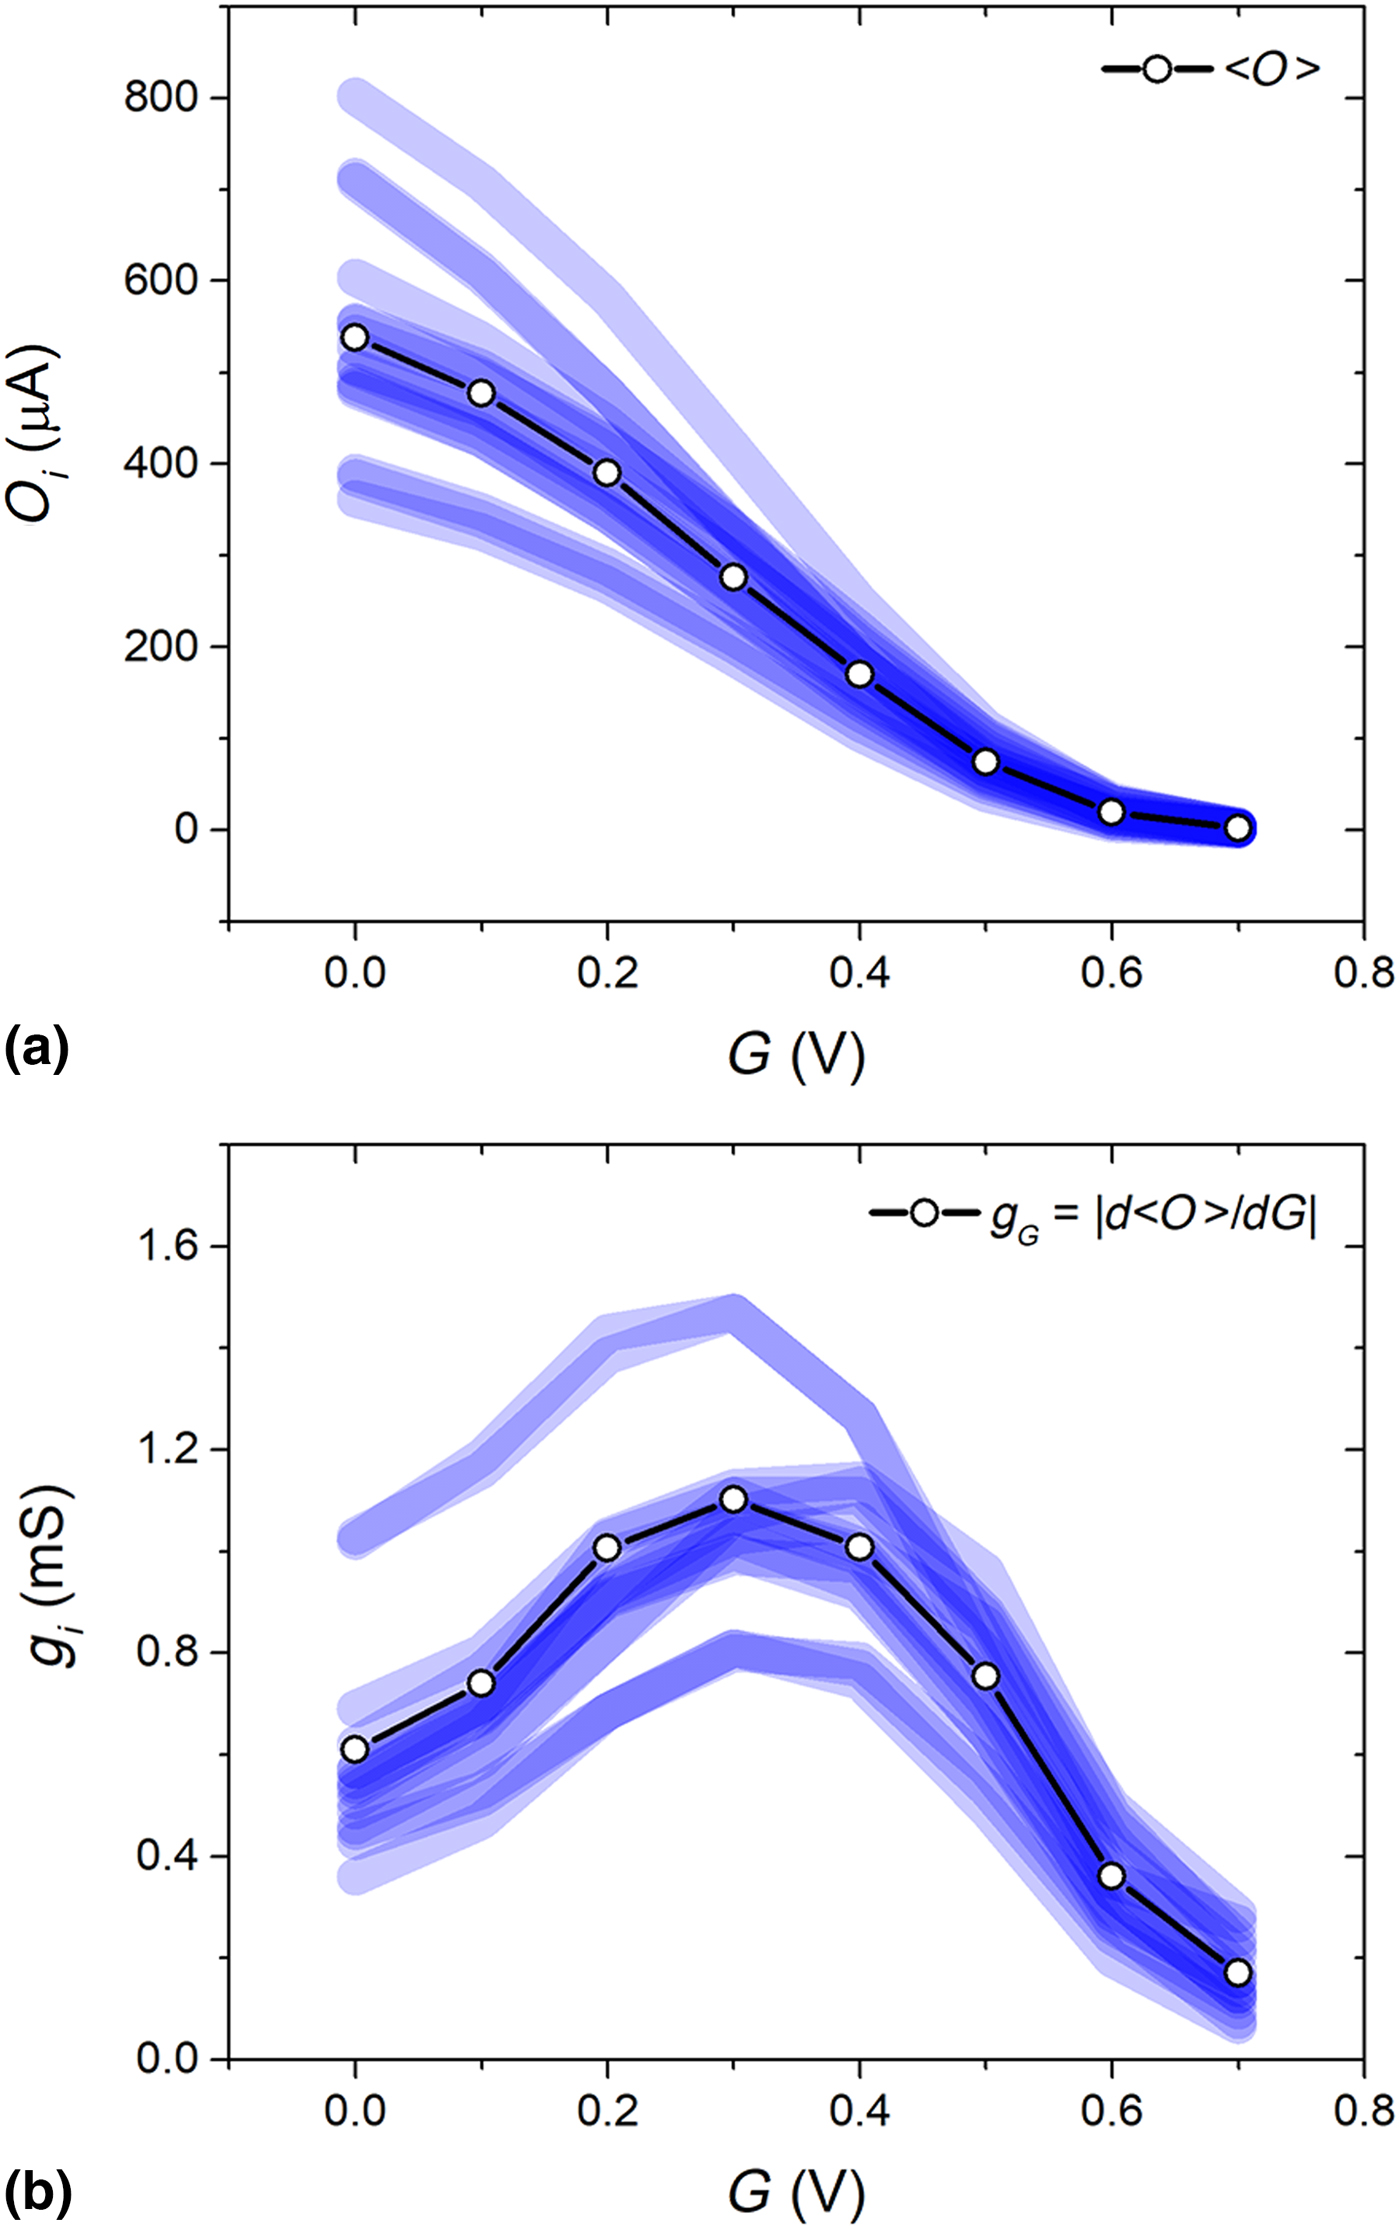
In Fig. 3, the statistical analysis of the global behavior of the grid is investigated. Initially, a voltage pulse is applied at every local input I i (pulse amplitude 100 mV and width 50 ms) and the resulting current amplitude is measured at every local output O i. This procedure is repeated for different global DC gate voltages (G = 0–700 mV). The statistical analysis of the local outputs O i is shown in Fig. 3 (distribution of output amplitude, mean value 〈Ο〉, and standard deviation σ) for different DC voltages. A reasonable bin size (~5–60 µA) is used for representing adequately the histograms in Fig. 3 for all 16 devices. The output amplitude O i for all 16 devices and the mean amplitude 〈Ο〉 as a function of the global gate voltage is depicted in Fig. 4(a). Compared with the single device behavior, the global 〈Ο〉 versus G has a similar form with a distribution that is attributed to device variability during fabrication and not to the position of the gate electrode. From Fig. 4(a), transconductance g i (|dΟ i/dG|) for all devices is presented in Fig. 4(b), and a global transconductance g G of the grid is defined as g G = |d〈Ο〉/dG| [Fig. 4(b)]. In analogy to the single device case, g G expresses the global sensitivity of the output 〈Ο〉, with respect to a global input G. Similarly to the single device behavior g i, global g G exhibits a maximum of transconductance.[Reference Khodagholy, Rivnay, Sessolo, Gurfinkel, Leleux, Jimison, Stavrinidou, Herve, Sanaur, Owens and Malliaras25]
Statistical analysis of the global behavior of the grid when a voltage pulse is applied at every I i (amplitude 100 mV and width 50 ms), and the resulting current amplitude is measured at every O i for different global DC voltages G (0–700 mV).
(a) Output O i (for 16 devices), mean output 〈O〉, and (b) transconductance g i (for 16 devices), global transconductance g G of the device grid as a function of the global gate voltage G (0–700 mV).
Statistical analysis of the grid behavior shows that under the influence of a global voltage, the function of the grid is similar to that of an individual device. Therefore, global or statistical metrics, such as global transconductance g G, can be defined for the characterization of the device ensemble, revealing a synchronous regulation of the device grid. This global regulation is multiplicative and can be used to force specific gain margins to a device ensemble. This offers an additional degree of freedom in neuromorphic architectures, especially in cases when stabilization of the activity of artificial neural ensembles is needed in order to avoid fading or saturation of output signals.[Reference Turrigiano and Nelson17]
Conclusions
In this work, we demonstrate that an electrolyte can be used as a global parameter in neuromorphic device architectures, emulating thus homeostatic phenomena of the neural environment. The gate electrode forces a global restriction to the whole grid of the devices, which exhibits a multiplicative behavior. This means that the gain of each device can be scaled, modulating the local I/O transmission with a global voltage G. The introduction of homeostatic control concepts through an electrolyte paves the way for plausible and more biologically realistic features in neuromorphic device architectures.
Acknowledgments
The authors would like to thank the Marie Curie initial training network OLIMPIA for the financial support. The authors acknowledge Thomas Lonjaret from the Department of Bioelectronics for the development of the acquisition software.