


1 Introduction
The ultimate goal of magnetic confinement fusion research is to demonstrate the scientific and technological feasibility of fusion energy for peaceful purposes. In order to achieve the conditions required for those expected in an electricity-generating fusion power plant, very hot plasmas, with temperatures exceeding 10 keV, must be generated and sustained for long periods. Early tokamaks relied entirely on ohmic heating of the plasma resulting from the toroidal current. However, ohmic heating becomes less effective at higher temperatures because the electrical resistivity of the plasma falls as the electron temperature increases, varying as
 $1/T_{e}^{3/2}$
. Tokamak plasmas can be heated by ohmic heating to temperatures of a few keV, which is not high enough for the alpha power to dominate. Besides, toroidal current is also necessary for equilibrium in a tokamak. Unfortunately, the toroidal current induced by the transformer can only be sustained for a limited period. In order to increase the plasma temperature and to achieve long pulse operations, some other auxiliary heating and current drive (H/CD) methods are required. There exists a wide range of auxiliary H/CD methods possessing a variety of different characteristics and attributes. For example, ion cyclotron resonance frequency (ICRF) and neutral beam injection (NBI) are capable of providing central ion heating for a tokamak reactor. Electron cyclotron resonance frequency (ECRF) offers the potential for localized, controllable current drive, well-suited for control of magnetohydrodynamic (MHD) instabilities, while lower hybrid current drive (LHCD) offers the potential for high current drive efficiency in the outer half of the plasma and it has produced the largest current so far in existing devices. It is likely that a combination of schemes will be employed in a reactor. However, the LHCD efficiency would drop sharply at higher plasma density due to parametric collisional absorption (CA) (Bonoli & Englade Reference Bonoli and Englade1986), and parametric instabilities (PI) (Liu & Tripathi Reference Liu and Tripathi1986; Cesario et al.
Reference Cesario, Cardinali, Castaldo, Paoletti and Mazon2004). Moreover, for typical reactor temperatures, the accessibility properties may force the current to be driven close to the plasma edge. Thus, the LHCD tool for the reactor is considered to be problematic. However, recent experiments (Cesario et al.
Reference Cesario, Amicucci, Cardinali, Castaldo, Marinucci, Panaccione, Santini, Tudisco, Apicella and Calabro2010) show that the PI effects are mitigated by operating at higher edge temperature, and consequently, the LHCD efficiency can be greatly improved. The theoretical analysis (Amicucci et al.
Reference Amicucci, Cardinali, Castaldo, Cesario, Galli, Panaccione, Paoletti, Schettini, Spigler and Tuccillo2016; Cardinali et al.
Reference Cardinali, Castaldo, Cesario, Santini, Amicucci, Ceccuzzi, Galli, Mirizzi, Napoli and Panaccione2017), considering the role of the width of the launched antenna spectrum, shows that the driven current can be tailored over most of the outer radial half of reactor plasmas, thus satisfying the request of a current profile control system of the reactor.
The Experimental Advanced Superconducting Tokamak (EAST) is the first fully superconducting tokamak with major radius
 $R_{0}=1.85$
m, minor radius
 $a=0.45$
m, toroidal magnetic field
 $B_{t}<3.5$
T and plasma current
 $I_{p}<1$
MA (Wan, Team & Team Reference Wan, Team and Team2000). One of the main objectives of EAST is to study physics issues of the advanced steady-state tokamak operations with higher plasma performance. After the successful engineering commissioning of EAST in 2006 and the first plasma discharges, significant improved performances have been achieved. In the 2012 campaign, the world’s longest pulse H-mode were achieved, lasting more than 30 s with LHCD and ICRF, as well as the longest pulse divertor plasma (411 s), which was fully driven by LHCD (Li et al.
Reference Li, Guo, Wan, Gong, Liang, Xu, Gan, Hu, Wang and Wang2013). In the 2014 campaign, upgraded H/CD systems were installed on EAST with
 $4.0/6.0$
MW LHCD power at
 $2.45/4.60$
GHz (Liu et al.
Reference Liu, Li, Shan, Wang, Liu, Zhao, Hu, Feng, Yang and Jia2016) and 12 MW of ICRF power with tunable frequency in the range 25–75 MHz (Zhao et al.
Reference Zhao, Zhang, Mao, Yuan, Xue, Deng, Wang, Ju, Cheng and Qin2014). In addition, a 8 MW NBI system was also installed on EAST (Hu et al.
Reference Hu, Xie, Xie, Liu, Xu, Liang, Jiang, Li and Liu2016). A 2 MW ECRF system at 140 GHz was developed and has been commissioned since 2015, and another 2 MW system at 140 GHz is under construction (Xu et al.
Reference Xu, Wang, Liu, Zhang, Huang, Shan, Wu, Hu, Li and Li2016). The advent of significantly improved auxiliary H/CD systems would lead to the ability explore advanced steady-state plasma operations modes with high plasma performance that is essential for ITER and the future fusion reactor.
On the basis of upgraded H/CD systems, exploration of operation space and assessment of current drive capability is made using a 0.5 dimension Minute Embedded Tokamak Integrated Simulator (METIS) code (Giruzzi et al. Reference Giruzzi, Artaud, Joffrin, Garcia and Ide2012). Sets of simulations of operation scenarios with different performances will also be illustrated and discussed.
2 METIS code and physical model
METIS is a submodule of the CRONOS (Artaud et al. Reference Artaud, Basiuk, Imbeaux, Schneider, Garcia, Giruzzi, Huynh, Aniel, Albajar and Ane2010) suite of codes. It includes a complete current diffusion solver, which can be used for preliminary operation scenario design, fast shot analysis, plasma discharge feedback and making preparation or verification for CRONOS. Depending on the simplification of the sources and the coarse time–space grid, the METIS code can describe any time-dependent scenario in a CPU time of the order of one minute. As a 0.5-D code, the fast calculation is the main advantage of METIS, but it is in approximations to other full 1.5-D code (e.g. CRONOS, which typically has computation times a hundred times longer).
2.1 Energy scaling law
Plasma energy content is decomposed between offset (
 $W_{o}$
), pedestal (
 $W_{\text{ped}}$
) and core (
 $W_{\text{core}}$
). The core energy is defined as
 $W_{\text{core}}=\unicode[STIX]{x1D70F}_{E,L}P_{\text{loss}}$
in low confinement mode (L-mode) and
 $W_{\text{core}}=\unicode[STIX]{x1D70F}_{E,H}P_{\text{loss}}-W_{\text{ped}}$
in H-mode with
 $W_{\text{ped}}=\unicode[STIX]{x1D70F}_{E,\text{ped}}P_{\text{loss}}$
.

Various scaling laws based on simple models are used in the METIS code. Scaling laws used for energy content prediction that depend on the scenarios are paired (cf. figure 1): one for the L-mode and one for the H-mode, or one for the pedestal energy and one for the total H-mode energy. The energy content, linked to the confinement time, is given by
 $$\begin{eqnarray}W_{\text{sc},\ldots }=P_{\text{loss}}\times \unicode[STIX]{x1D70F}_{\text{sc},\ldots },\end{eqnarray}$$
where
 $P_{\text{loss}}$
is the plasma loss power and
 $\unicode[STIX]{x1D70F}_{\text{sc},\ldots }$
is the energy confinement time with the subscript ‘
 $\text{sc},\ldots$
’ denoting the energy scaling laws for different types of confinement regime in the METIS code. In this paper, for example, the energy confinement time law ITERL-96 (
 $\unicode[STIX]{x1D70F}_{E,L}$
) and ITERH-98(
 $y,2$
) (
 $\unicode[STIX]{x1D70F}_{E,H}$
) (Wakatani et al.
Reference Wakatani, Mukhovatov, Burrell, Connor, Cordey, Esipchuk, Garbet, Lebedev, Mori and Toi1999) are adopted separately for L-mode and H-mode, while the pedestal energy confinement time takes the form
 $\unicode[STIX]{x1D70F}_{\text{ped}}=(\unicode[STIX]{x1D70F}_{E,L}+\unicode[STIX]{x1D70F}_{E,H})/2$
and gives quite reasonable results.
In practice, the plasma confinement can be modified by various processes, and in METIS we ultimately rewrite the (2.1) as follows:
 $$\begin{eqnarray}W_{\text{th}}=H_{\text{MHD}}H_{\text{ref}}\unicode[STIX]{x1D70F}_{E,\text{sc}}P_{p\text{loss}}+W_{\text{ITB}},\end{eqnarray}$$
where
 $W_{\text{ITB}}=(H_{\text{ITB}}-1)\unicode[STIX]{x1D70F}_{E,\text{sc}}W_{\text{core}}$
.
 $H_{\text{ref}}$
is a prescribed factor according to the characterizing feature of tokamak discharge, and
 $H_{\text{MHD}}$
and
 $H_{\text{ITB}}$
are internally computed, time-dependent, confinement factors that take into account the confinement degradation due to MHD effects or confinement enhancement due to the formation of internal transport barriers (ITBs). By default, all these multiplicative factors are equal to 1, equation (2.2) can thus reduce to the simple form of (2.1).
The transition from L-mode to H-mode requires that the total input power
 $P_{\text{in}}$
is greater than the H-mode power threshold
 $P_{\text{thr}}$
, which is given by the empirical scaling LH99(1) as follows (Snipes & Database Reference Snipes and Database2000):
 $$\begin{eqnarray}P_{\text{thr}}=2.84n_{e,\text{bar}}^{0.58}B_{t}^{0.82}SR_{0}a^{0.81}m_{i}^{-1},\end{eqnarray}$$
where
 $S$
is the plasma external surface area, and
 $n_{e,\text{bar}}$
and
 $m_{i}$
are line-averaged electron density and atomic mass number, respectively. In addition, the offset power may be required to fit the experimental data of EAST (Liu et al.
Reference Liu, Gao, Liu, Ding, Xia, Zhang, Zhang, Wang, Han and Li2013).
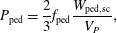
In METIS, the pressure
 $P_{\text{ped}}$
at the top of the pedestal is computed with the energy content predicted by scaling law and modulated by a free coefficient
 $f_{\text{ped}}$
:
 $$\begin{eqnarray}P_{\text{ped}}=\frac{2}{3}f_{\text{ped}}\frac{W_{\text{ped},\text{sc}}}{V_{P}},\end{eqnarray}$$
where
 $W_{\text{ped},\text{sc}}=P_{\text{loss}}\times \unicode[STIX]{x1D70F}_{\text{ped},\text{sc}}$
and by default
 $f_{\text{ped}}$
is set to 1.
2.2 Profiles description
The density profile (
 $n_{e,x}$
) is described by the line-averaged value (
 $n_{e,\text{bar}}$
), the peaking factor (
 $\unicode[STIX]{x1D708}_{n}$
) and the edge density value (
 $n_{e,a}$
) obtained from a simple model. In L mode, the shape of the density profile takes the following form:
 $$\begin{eqnarray}n_{e,x}=(n_{e,0}-n_{e,a})(1-x^{2})^{\unicode[STIX]{x1D708}_{n-1}}+n_{e,a},\end{eqnarray}$$
where
 $\unicode[STIX]{x1D708}_{n}=n_{e,a}/n_{e,\text{bar}}$
. In H mode, the density profile is computed by another method to ensure that the pedestal is also present. The density profile is constrained by the given volume averaged value, the peaking factor and the constraint of zero derivative at the centre. The edge value is obtained separately, and then, the other point value is derived by using cubic Hermite polynomial interpolation.
The temperature profiles are computed using time-independent transport equations:
 $$\begin{eqnarray}\frac{\unicode[STIX]{x2202}T_{e}}{\unicode[STIX]{x2202}x}=\frac{\displaystyle \int _{0}^{x}V^{\prime }Q_{e}}{\unicode[STIX]{x1D705}_{e}V^{\prime }\langle |\unicode[STIX]{x1D735}\unicode[STIX]{x1D70C}|^{2}\rangle }\quad \text{and}\quad \frac{\unicode[STIX]{x2202}T_{i}}{\unicode[STIX]{x2202}x}=\frac{\displaystyle \int _{0}^{x}V^{\prime }Q_{i}}{\unicode[STIX]{x1D705}_{i}V^{\prime }\langle |\unicode[STIX]{x1D735}\unicode[STIX]{x1D70C}|^{2}\rangle },\end{eqnarray}$$
where
 $Q_{e}$
and
 $Q_{i}$
are the total heat sources for electrons and ions respectively, as defined in CRONOS (Artaud et al.
Reference Artaud, Basiuk, Imbeaux, Schneider, Garcia, Giruzzi, Huynh, Aniel, Albajar and Ane2010),
 $\unicode[STIX]{x1D705}_{e}=\unicode[STIX]{x1D705}_{0}(1+K_{E}x^{2})$
and
 $\unicode[STIX]{x1D705}_{i}=\unicode[STIX]{x1D707}_{e,i}\unicode[STIX]{x1D705}_{e}$
are electron and ion heat diffusivity coefficients shape with
 $\unicode[STIX]{x1D707}_{e,i}$
computed with the help of Ion Temperature Gradient and Trapped Electron Mode (ITG-TEM) fluid stability analysis (Asp et al.
Reference Asp, Weiland, Garbet, Mantica, Parail, Suttrop and Contributors2005),
 $K_{E}$
is a shape scalar factor to fit the experiment data, and
 $\unicode[STIX]{x1D705}_{0}$
is a constant normalized to retrieve the correct energy content. In addition, the heat diffusivity coefficients shape will be rewritten, when the ITB forms, as (Waltz et al.
Reference Waltz, Staebler, Dorland, Hammett, Kotschenreuther and Konings1997):
 $$\begin{eqnarray}\unicode[STIX]{x1D705}_{\text{ITB}}=\frac{f_{s}(q,\unicode[STIX]{x1D6FC}(\unicode[STIX]{x1D6FD},q))}{f_{s}(\bar{q},\unicode[STIX]{x1D6FC}(\unicode[STIX]{x1D6FD},\bar{q}))}\unicode[STIX]{x1D705}_{0}(1+K_{E}x^{2}),\end{eqnarray}$$
with
 $f_{s}(q,\unicode[STIX]{x1D6FC})=\text{e}^{-(s-(3/5)\unicode[STIX]{x1D6FC}-(1/2))^{2}/2}$
, where
 $s=(x/q)(\text{d}q/\text{d}x)$
and
 $\unicode[STIX]{x1D6FC}=-Rq^{2}(\text{d}\unicode[STIX]{x1D6FD}/\text{d}x)$
with
 $\unicode[STIX]{x1D6FD}=2\unicode[STIX]{x1D707}_{0}P/B^{2}$
(
 $P$
is the total pressure),
 $\bar{q}$
is the monotonic safety factor given by
 $\bar{q}=\min (q)+x^{\unicode[STIX]{x1D710}_{q}}(q(x=1)-\min (q))$
and
 $\unicode[STIX]{x1D710}_{q}$
is computed to minimized
 $\int _{x_{\text{min}}}^{1}(q-\bar{q})^{2}\,\text{d}x$
with
 $x_{\text{min}}$
is the most external position where
 $q=\min (q)$
. The ITB mechanism is based on the magnetic shear effect and the Shafranov shift effect (Garbet et al.
Reference Garbet, Mantica, Angioni, Asp, Baranov, Bourdelle, Budny, Crisanti, Cordey and Garzotti2004), and the effect of ITB is separated into two consistent parts: the first is the increase of the plasma energy content by the modification of the
 $H_{\text{ITB}}$
parameter (cf. (2.2)), and the second is the change in the transport coefficient shape (cf. (2.7)).
The edge value of density and temperature are necessary to solve the equations for the density and temperature profiles. In H-mode with divertor configurations, the edge density is given by the adapted multi-machine law
 $n_{e,a}=(5\times 10^{-21}{-}6.7\times 10^{-24}T_{e,a})n_{\text{min}}^{2}$
with
 $n_{\text{min}}=\min (n_{e,\text{bar}},n_{Gr})$
(Mahdavi et al.
Reference Mahdavi, Maingi, Groebner, Leonard, Osborne and Porter2003), where
 $T_{e,a}$
is the edge electron temperature,
 $n_{Gr}$
is the Greenwald limit density; In L-mode plasma, the scaling law
 $n_{e,a}=0.00236n_{e,\text{bar}}^{1.08}\unicode[STIX]{x1D705}^{1.11}B_{t}^{0.78}$
is used (Porter et al.
Reference Porter, Davies, Labombard, Loarte, McCormick, Monk, Shimada and Sugihara1999), where
 $\unicode[STIX]{x1D705}$
is the plasma elongation and
 $B$
is the toroidal magnetic field. In addition, for edge temperature in H-mode, the model
 $T_{e,a}=1.18\times 10^{-7}T_{e,d}^{0.2}(n_{e,a}L_{c}(1-f_{\text{sol}}/2))^{0.4}$
is used (Erents et al.
Reference Erents, Stangeby, Labombard, Elder and Fundamenski2000), where
 $L_{c}$
is the flux tube’s connection length,
 $f_{\text{sol}}=P_{\text{rad},\text{SOL}}/P_{\text{loss}}$
is the fraction of radiative power loss in the scrape-off layer (SOL) and
 $T_{e,d}=15(1+f_{\text{pellet}})$
is the divertor temperature with
 $f_{\text{pellet}}$
is the fraction of fuelling coming from pellet injection. In L mode, the edge temperature is given by
 $T_{e,a}=(P_{\text{LCMS}}/en_{e,a}\unicode[STIX]{x1D6FE}_{tr}L_{c}^{2}\unicode[STIX]{x1D706}_{\text{SOL}}C_{s})^{2/3}$
, where
 $P_{\text{LCMS}}$
is the power convected to the separatrix,
 $C_{s}$
is the sound speed,
 $\unicode[STIX]{x1D6FE}_{tr}=7$
is the sheath heat transmission coefficient, and
 $\unicode[STIX]{x1D706}_{\text{SOL}}$
is the characteristic SOL decay length (Stangeby Reference Stangeby2000).
2.3 Heating and current driven
The description of the sources is very important in order to obtain precise predicted values. The sources are decomposed into total power, total current drive, profile power source and current profile source. Each of these terms is computed with different formulations, depending on the best methods available (in terms of computing speed and precision).
The NBI is described by a decay equation applied in a simplified geometry and an analytical solution of the Fokker–Planck equation. The beam intensity damping equation along the beam path is
 $\text{d}\unicode[STIX]{x1D6FE}/\text{d}\unicode[STIX]{x1D704}=-n_{e}(\unicode[STIX]{x1D704})\unicode[STIX]{x1D70E}_{\text{eff}}(\unicode[STIX]{x1D704})\unicode[STIX]{x1D6FE}(\unicode[STIX]{x1D704})$
, where
 $\unicode[STIX]{x1D704}$
is the coordinate along the beam path with initial condition
 $\unicode[STIX]{x1D6FE}(\unicode[STIX]{x1D704}=0)=\unicode[STIX]{x1D6FE}_{0}$
at the entrance of the plasma and
 $\unicode[STIX]{x1D70E}_{\text{eff}}$
is the effective stopping cross-section depending on the beam ion mass (
 $A_{b}$
), the initial beam energy (
 $E_{b}(x=0)$
), the plasma effective charge (
 $Z_{\text{eff}}$
), the electron density (
 $n_{e}$
) and temperature (
 $T_{e}$
), etc. (Janev, Boley & Post Reference Janev, Boley and Post1989). Combining the decay equation and the orbit width
 $\unicode[STIX]{x1D6FF}$
(Eriksson & Porcelli Reference Eriksson and Porcelli2001), the power deposition (
 $p_{b}(x)$
) and the broadening of the deposition profile can be simulated. From the power deposition, the fraction of the power that heats the main plasma ions can be computed by using the formulae (5.4.12) in Wesson (Reference Wesson2011a
). The current source associated with NBI is computed by
 $J_{\text{NBI}}^{\text{fast}}=e(p_{b}(x)/E_{b}(x))\unicode[STIX]{x1D70F}_{s}\unicode[STIX]{x1D709}_{b}((v_{0}^{3}+v_{c}^{3})/v_{0}^{3})^{2v_{\unicode[STIX]{x1D6FE}}^{3}/3v_{0}^{3}}\int _{0}^{v_{0}/v_{c}}(z^{3}/(z^{3}+1))^{(2v_{\unicode[STIX]{x1D6FE}}^{3}/3v_{0}^{3})+1}\,\text{d}z$
, where
 $\unicode[STIX]{x1D70F}_{s}$
is the slowing down time,
 $v_{c}$
and
 $v_{\unicode[STIX]{x1D6FE}}$
are critical velocities and
 $v_{0}$
is the fast ions’ initial velocity defined in the Stix paper (Stix Reference Stix1975).
In minority heating of ICRF scheme, a fast ion population is generated and heats the majority plasmas. This means that good knowledge of the fast ion distribution function is essential. The analytical Stix formulation (Stix Reference Stix1975) that gives the steady-state velocity distribution function
 $f(v)$
without space dependence is used in METIS. This distribution function
 $f(v)$
is computed for each time and all involved parameters are taken at the resonance position
 $R_{\text{res}}(t)$
on the equatorial plane. The resonance position
 $R_{\text{res}}(t)$
and the harmonic are computed from the magnetic equilibrium, taking into account the ICRF frequency, the minority ion mass, charge and concentration. Since the hydrogen resonance coincides with the seconded harmonic resonance of deuterium, both the hydrogen ions and the deuterium ions will absorb the wave power at the same location and so, the fraction absorbed by the hydrogen is a key parameter. This fraction is deduced from the resonance width scaled on the PION code results (Eriksson, Hellsten & Willen Reference Eriksson, Hellsten and Willen1993). In addition, the shape of the ICRF power deposition is assumed to be a Gaussian curve centred on the resonance position, with a width proportional to the resonance width.
Graph of absorption for lower hybrid wave.
 $\unicode[STIX]{x1D6E4}_{L}$
is the Landau damping condition (black line);
 $N_{\text{acc}}=\sqrt{S}+\sqrt{D^{2}/|P|}$
is the accessibility limit (red line);
 $\unicode[STIX]{x1D6EC}_{\text{low}}=n_{\Vert 0}/(1+(\unicode[STIX]{x1D70C}/qR_{\text{axe}})\sqrt{-P/S})$
and
 $\unicode[STIX]{x1D6EC}_{\text{low}}=n_{\Vert 0}/(1-(\unicode[STIX]{x1D70C}/qR_{\text{axe}})\sqrt{-P/S})$
are lower and higher caustic (green line), where
 $q$
is the safety factor,
 $\unicode[STIX]{x1D70C}$
is the normalized radius,
 $R_{\text{axe}}$
is the geometrical axes of each flux surface,
 $S$
and
 $P$
are the elements of Stix dielectric tensor.

A semi-analytic model is used to describe the LHCD effect, and is separated into two parts. The first part consists of the computation of the current source profile. The second part is the evaluation of the scaling law for LHCD-driven efficiency or a simple law deduced for the C3PO/LUKE simulations (Peysson & Shoucri Reference Peysson and Shoucri1998). The power deposition is taken proportional to the current source and only electrons are heated. The lower hybrid (LH) power damping model adopted in METIS is a heuristic model that is based on the statistical theory developed by Kupfer and Moreau (Kupfer & Moreau Reference Kupfer and Moreau1992; Kupfer, Moreau & Litaudon Reference Kupfer, Moreau and Litaudon1993). In the METIS description, the
 $n_{\Vert }$
bounds that are allowed by the dispersion relation are referred to as upper caustics (
 $\unicode[STIX]{x1D6EC}_{\text{high}}$
) and lower caustics (
 $\unicode[STIX]{x1D6EC}_{\text{low}}$
), and the limit of the Landau damping is called
 $\unicode[STIX]{x1D702}_{L}$
(shown in figure 2). The strong Landau damping is given roughly by
 $n_{\Vert \text{abs}}=6.5/\sqrt{T_{e}(\text{keV})}$
. Mainly, the power deposition is computed using the distance between local Landau damping condition
 $\unicode[STIX]{x1D6E4}_{L}$
and local wave
 $n_{\Vert }$
. This distance, normalized to spectrum width, is the argument for a Gaussian function. Additionally, the power deposition decreases when wave
 $n_{\Vert }$
is approaching the caustic curves and accessibility condition
 $N_{\text{acc}}$
. The modified form of the power and current source shape are thus:
 $$\begin{eqnarray}P_{\text{LH}}\propto \unicode[STIX]{x1D712}(N_{\text{acc}},\unicode[STIX]{x1D6EC}_{\text{high}},\unicode[STIX]{x1D6EC}_{\text{low}})\exp \left[-\frac{1}{2}\left(\frac{n_{\Vert \text{abs}}-\unicode[STIX]{x1D6E4}_{L}}{\unicode[STIX]{x1D6FF}n}\right)^{2}\right],\end{eqnarray}$$
where
 $\unicode[STIX]{x1D712}$
is the penalization of absorption probability due to caustic propagation and accessibility limit (J. Artaud, private communication).
 $\unicode[STIX]{x1D6FF}n$
is defined as
 $\unicode[STIX]{x1D6FF}n_{0}(n_{\Vert \text{abs}}/n_{\Vert 0})$
with
 $n_{\Vert 0}$
is the initial refraction index of wave spectrum and
 $\unicode[STIX]{x1D6FF}n_{0}$
is initial width of wave spectrum.
 $n_{\Vert \text{abs}}$
corresponds to the position where strong Landau damping occurred.
Once the LH power absorption profile is computed, the driven current is determined from the current efficiency, as follows:
 $$\begin{eqnarray}I_{\text{LH}}=\unicode[STIX]{x1D702}_{\text{LH}}\frac{P_{\text{LH}}}{n_{e,\text{bar}}R_{0}}\quad (V_{\text{loop}}=0),\end{eqnarray}$$
where
 $\unicode[STIX]{x1D702}_{\text{LH}}$
is LH efficiency given either by the scaling law or prescribed. For
 $V_{\text{loop}}\neq 0$
, the synergy effect between the lower hybrid wave (LHW) and the parallel electric field should be considered. This synergy effect is due to the asymmetric decrease of electron collision rate caused by LH power damping. The same decrease also implies an enhancement of electrical conductivity (Fisch Reference Fisch1985). The total current generated by LH wave, including the first-order correction in parallel electric field, is written as follows (Giruzzi et al.
Reference Giruzzi, Barbato, Bernabei and Cardinali1997):
 $$\begin{eqnarray}I_{\text{LH}}=\unicode[STIX]{x1D702}_{\text{LH}}\frac{P_{\text{LH}}}{n_{e,\text{bar}}R_{0}}+\frac{V_{\text{loop}}}{R_{\text{hot}}},\end{eqnarray}$$
with
 $R_{\text{hot}}=(8R_{0}^{2}n_{e,\text{bar}}^{2}/P_{\text{LH}}\unicode[STIX]{x1D702}_{\text{LH}}^{2})+(3+Z_{\text{eff}}/(5+Z_{\text{eff}})^{2})$
is hot resistance that is inversely proportional to hot conductivity
 $\unicode[STIX]{x1D70E}_{\text{hot}}$
. The general theoretical for
 $\unicode[STIX]{x1D70E}_{\text{hot}}$
is found in Fisch (Reference Fisch1985).
The
 $\unicode[STIX]{x1D702}_{\text{LH}}$
scaling law uses a theoretical expression for the current drive efficiency (Fisch Reference Fisch1978) that is modified in order to take into account regimes at low temperature and with poor accessibility. The
 $\unicode[STIX]{x1D702}_{\text{LH}}$
expression is also modified to take into account the effect of plasma elongation and given by
 $$\begin{eqnarray}\unicode[STIX]{x1D702}_{\text{LH}}=\frac{6}{5+Z_{\text{eff}}}\unicode[STIX]{x1D701}_{\text{acc}}\frac{\displaystyle \int _{0}^{1}E_{\text{LH}}P_{\text{LH}}V^{\prime }(x)\,\text{d}x}{\displaystyle \int _{0}^{1}P_{\text{LH}}V^{\prime }(x)\,\text{d}x},\end{eqnarray}$$
with
 $E_{\text{LH}}=4\times 10^{20}((\unicode[STIX]{x1D714}_{2}^{2}-\unicode[STIX]{x1D714}_{1}^{2})/(\ln (\max (\unicode[STIX]{x1D714}_{1},\unicode[STIX]{x1D714}_{2})/\unicode[STIX]{x1D714}_{1})))\min (1,\text{e}^{(n_{\Vert \text{abs}}/n_{\Vert 0})-\unicode[STIX]{x1D705}})$
, where
 $\unicode[STIX]{x1D714}_{1}=1/\max (n_{\Vert \text{abs}},n_{\Vert 0})$
and
 $\unicode[STIX]{x1D714}_{2}=1/\max (\unicode[STIX]{x1D6EC}_{\text{low}},N_{\text{acc}})$
and
 $\unicode[STIX]{x1D705}$
is the plasma elongation.
 $\unicode[STIX]{x1D701}_{\text{acc}}=\min (1,(\text{e}^{n_{\Vert 0}-N_{\text{acc}}}/\unicode[STIX]{x1D6FF}n_{0}))$
is the modulation parameter of current drive efficiency that takes the poor wave accessibility into account.
For electron cyclotron current drive (ECCD), both power deposition and current source profile are given by a Gaussian function
 $$\begin{eqnarray}P_{\text{eccd}}=P_{\text{eccd},0}\exp \left[\frac{(x-x_{\text{eccd}})}{2\unicode[STIX]{x1D6FF}_{\text{eccd}}^{2}}\right],\quad \text{where}~\unicode[STIX]{x1D6FF}_{\text{eccd}}=\sqrt{\frac{1}{4}\left(\frac{v_{\text{th}}}{c}\right)^{2}+\unicode[STIX]{x1D6FC}_{\text{eccd}}\frac{I_{\text{eccd}}}{P_{\text{eccd}}}\left(\frac{v_{\text{th}}}{c}\right)^{2}}\end{eqnarray}$$
is the width determined from the width of the resonance with
 $v_{\text{th}}=\sqrt{2eT(x_{\text{eccd}})/m_{e}}$
,
 $\unicode[STIX]{x1D6FC}_{\text{eccd}}\approx 1$
and
 $x_{\text{eccd}}$
is the maximal position of power deposition, which is prescribed (Wesson Reference Wesson2011b
). The ECCD current efficiency is deduced from Fisch & Boozer (Reference Fisch and Boozer1980), which includes the Fisch formulation for current drive efficiency and trapped electrons effect (Giruzzi Reference Giruzzi1987) and is given by
 $$\begin{eqnarray}\unicode[STIX]{x1D702}_{\text{eccd}}=\frac{1}{1+{\displaystyle \frac{100}{T_{e}(\text{eccd})}}}\left[1-\left(1+\frac{5+Z_{\text{eff}}}{3(1+Z_{\text{eff}})}\right)(\sqrt{2}\unicode[STIX]{x1D707}_{t})^{(5+Z_{\text{eff}})/(1+Z_{\text{eff}})}\right]\frac{6}{5+Z_{\text{eff}}},\end{eqnarray}$$
with
 $\unicode[STIX]{x1D707}_{t}=\sqrt{ax_{\text{eccd}}(1+\cos (\unicode[STIX]{x1D703}_{\text{pol}}))/(R_{0}+ax_{\text{eccd}}\cos (\unicode[STIX]{x1D703}_{\text{pol}}))}$
, where
 $\unicode[STIX]{x1D703}_{\text{pol}}$
is the ECCD power deposition angle. In addition, the bootstrap current density is always given by the Sauter law, described in Sauter, Angioni & Lin-Liu (Reference Sauter, Angioni and Lin-Liu1999).
3 Modelling of EAST scenarios
3.1 Operation space
Typical waveforms of experimental full current drive discharge (a,c,e,g) and simulation result with METIS code (b,d,f,h): (a) plasma current
 $I_{p}$
, (b) line-averaged density
 $n_{\text{bar}}$
and loop voltage
 $V_{\text{loop}}$
, (c) injected lower hybrid wave power
 $P_{\text{LH}}$
(
 $f=4.6~\text{GHz}$
), (d) plasma stored energy (
 $W_{\text{dia}}$
) and normalize beta (
 $\unicode[STIX]{x1D6FD}_{N}$
).

The main physics model and parameters set for EAST tokamak are firstly validated by making the comparison between the EAST experiment and the modelling results. In figure 3(a,c,e,g), the main plasma parameters are illustrated for shot 48 888. The plasma current is 400 kA, the line-averaged density is
 $2.5\times 10^{19}~\text{m}^{-3}$
, the major and minor radii are 1.89 m and 0.45 m, respectively. The full current drive has been achieved with LHW power
 $P_{\text{LH}}=2.2$
MW (
 $f=4.6~\text{GHz}$
). The LH current profile is first modelled with the recent ‘Tail LH’ mode in C3PO/LUKE, which has been proven to reproduce well experimental results on Tore Supra (Decker et al.
Reference Decker, Peysson, Artaud, Nilsson, Ekedahl, Goniche, Hillairet and Mazon2014). The parameters of the LH statistical model in METIS are tuned to fit the C3PO/LUKE results. Figure 4 shows the LH current profiles of the two models corresponding to the case in figure 3. The results show a good agreement and the tiny discrepancy between the results may be caused by the simplified model that METIS used.
Normalized radial lower hybrid wave driven current profile calculated by METIS (black line) and the ray tracing/Fokker–Planck code C3PO/LUKE (blue line).

Assessment of current drive capability calculated with the metis scaling law. The contours of safety factor at
 $\unicode[STIX]{x1D70C}=0.95$
(
 $q_{95}$
, red line), the fraction of non-inductive current (
 $f_{\text{ni}}$
, blue line) and the fraction of LH driven current (
 $f_{\text{cd}}$
, blue line) against the plasma current (
 $I_{P}$
) and line-average density (
 $n_{e,\text{bar}}$
) are plotted. The fraction of LH driven current
 $f_{\text{cd}}$
calculated with fixed
 $\unicode[STIX]{x1D702}_{\text{LH}}=1.1\times 10^{19}~\text{AW}^{-1}~\text{m}^{-2}$
is also plotted (black line). Main input parameters:
 $B_{t}=2.3$
T,
 $P_{\text{lhw}}=3$
MW at frequency of 4.6 GHz,
 $P_{\text{nbi}}=3$
MW with beam energy of 80 keV,
 $P_{\text{icrf}}=4$
MW at frequency of 35 MHz.

Operation space with
 $n_{e,\text{bar}}=4\times 10^{19}~\text{m}^{-3}$
,
 $P_{\text{lhw}}=3$
MW,
 $P_{\text{nbi}}=3$
MW,
 $P_{\text{icrf}}=4$
MW. The contours of safety factor at
 $\unicode[STIX]{x1D70C}=0.95$
(
 $q_{95}$
, red line), the fraction of non-inductive current (
 $f_{\text{ni}}$
, blue line), the normalize beta (
 $\unicode[STIX]{x1D6FD}_{N}$
, magenta line) against the plasma current (
 $I_{P}$
) and toroidal magnetic field (
 $B_{t}$
) are plotted.

The capability of current drive with operating frequency of 4.6 GHz with a refraction index of
 $N_{\Vert }=2.04$
is illustrated in figure 5. As expected from the assumed models, the fraction of LH driven current
 $f_{\text{cd}}=I_{\text{cd}}/I_{p}$
, where
 $I_{\text{cd}}$
as calculated with the scaling law, is roughly inversely proportional to the density
 $n_{e,\text{bar}}$
. In simulations, a large fraction of non-inductive current is driven by the LHW thanks to the high available power and high drive efficiency. Also, another assessment with fixed
 $\unicode[STIX]{x1D702}_{\text{LH}}=1.1\times 10^{19}~\text{AW}^{-1}~\text{m}^{-2}$
according to the latest LHCD experiments reported in Liu et al. (Reference Liu, Ding, Li, Wan, Shan, Wang, Liu, Zhao, Li and Li2015) is performed for comparison with current drive capability calculated by the metis scaling law. The experiment assessment with fixed efficiency appears to be approximately consistent with metis scaling law calculations at low density. As the density increases, however, the
 $f_{\text{cd}}$
calculated by the scaling law decreases more steeply than the fixed one. This decrease of
 $\unicode[STIX]{x1D702}_{\text{LH}}$
can be explained by the deterioration of Landau absorption and accessibility condition when the density increases and temperature decreases (i.e. both
 $E_{\text{LH}}$
and
 $\unicode[STIX]{x1D701}_{\text{acc}}$
in (2.11) decrease).
Scans of toroidal magnetic field
 $B_{t}$
and plasma current
 $I_{p}$
have also been carried out to explore the operation space with the global parameters
 $n_{e,\text{bar}}=4\times 10^{19}~\text{m}^{-3}$
,
 $P_{\text{lhw}}=3$
MW,
 $P_{\text{nbi}}=3$
MW,
 $P_{\text{icrf}}=4$
MW. The frequency of ICRF is tuned by the expression
 $f_{ci}=15.2\times B_{t}$
(MHz) to achieve on-axis H-minority heating and hydrogen minority concentration (
 $n_{H}/n_{e}$
) is set to 7 %. The results presented in figure 6 show that the normalized beta
 $\unicode[STIX]{x1D6FD}_{N}$
increases rapidly with decreasing toroidal magnetic field and slowly with decreasing plasma current. The value of
 $\unicode[STIX]{x1D6FD}_{N}>2.6$
with an edge safety factor
 $q_{95}=3\sim 5$
could be attained when
 $B_{t}<2.1$
T and
 $I_{p}<0.7$
MA.
3.2 Predictive scenarios
Several scenarios are considered for EAST operation: steady-state (SS) H-mode, advanced regime, high
 $\unicode[STIX]{x1D6FD}_{N}$
and high
 $T_{e}$
. Table 1 summarizes the main input parameters and output quantities of METIS code for each scenario.
Results of simulated EAST SS H-mode scenario showing: waveforms of (a) plasma current (
 $I_{p}$
) and line-average electron density (
 $n_{e,\text{bar}}$
); (b) additional heating power including lower hybrid wave power (
 $P_{\text{lhw}}$
), neutral beam power (
 $P_{\text{nbi}}$
) and ion cyclotron wave power (
 $P_{\text{icrf}}$
); (c) fractions of lower hybrid driven current (
 $f_{\text{lhw}}$
), neutral beam driven current (
 $f_{\text{nbi}}$
), and bootstrap driven current (
 $f_{\text{boot}}$
); (d) normalized beta (
 $\unicode[STIX]{x1D6FD}_{N}$
), H factor (
 $H_{98}$
), and plasma stored energy (
 $W_{\text{dia}}$
).

The main parameters of SS H-mode scenario, advanced regime, high
 $\unicode[STIX]{x1D6FD}_{N}$
scenario and high
 $T_{e}$
scenario.

3.2.1 SS H-mode scenario
Results of simulated EAST SS H-mode scenario showing: ion temperature (
 $T_{i}$
), electron temperature (
 $T_{e}$
) and electron density (
 $n_{e}$
) profiles in (a) L-mode (
 $t\sim 15$
s), and (b) H-mode (
 $t\sim 30$
s).

Results of simulated EAST advanced scenario showing: waveforms of (a) plasma current (
 $I_{p}$
) and line-average electron density (
 $n_{e,\text{bar}}$
); (b) additional heating power including lower hybrid wave power (
 $P_{\text{lhw}}$
), neutral beam power (
 $P_{\text{nbi}}$
), ion cyclotron wave power (
 $P_{\text{icrf}}$
) and electron cyclotron wave power (
 $P_{\text{ecw}}$
); (c) fractions of lower hybrid driven current (
 $f_{\text{lhw}}$
), neutral beam driven current (
 $f_{\text{nbi}}$
), electron cyclotron driven current (
 $f_{\text{ecw}}$
) and bootstrap driven current (
 $f_{\text{boot}}$
); (d) normalized beta (
 $\unicode[STIX]{x1D6FD}_{N}$
), H factor (
 $H_{98}$
), and plasma stored energy (
 $W_{\text{dia}}$
).

SS H-mode scenario with plasma current
 $I_{p}=0.6$
MA, line-average electron density
 $n_{e,\text{bar}}=3.9\times 10^{19}~\text{m}^{-3}$
, toroidal magnetic field
 $B_{t}=2.3$
T, lower hybrid wave power
 $P_{\text{lhw}}=3$
MW, neutral beam power
 $P_{\text{nbi}}=3$
MW, ion cyclotron wave power
 $P_{\text{icrf}}=4$
MW of an approximately zero loop voltage is shown in figure 7. The L–H transition occurs at 18 s when the power transported across the separatrix exceeds the H-mode power threshold
 $P_{\text{thr}}$
(with a value
 ${\sim}1.65$
MW) calculated with the scaling law LH99(1). The H factor
 $H_{98}$
(i.e. the enhancement factor with respect to ITERH-98P(
 $y,2$
) scaling) increases from approximately 0.55 to 0.8, and a transport barrier is formed at the plasma edge (
 $\unicode[STIX]{x1D70C}\approx 0.95$
) where the density and temperature gradients steepen after the L–H transition, as illustrated in figure 8.
3.2.2 Advanced scenario
Figures 9 and 10 show the waveforms and profiles evolution for the advanced scenario. The main input parameters are as follows:
 $I_{p}=0.75$
MA,
 $n_{e,\text{bar}}=4.8\times 10^{19}~\text{m}^{-3}$
,
 $B_{t}=2.3$
T,
 $P_{\text{lhw}}=3$
MW,
 $P_{\text{nbi}}=3$
MW,
 $P_{\text{icrf}}=4$
MW,
 $P_{\text{eccd}}=1$
MW. A strongly reversed magnetic shear regime is obtained and maintained by off-axis current driven by LH wave together with the bootstrap current. As a result, the electron and ion ITBs are formed near the zero-shear region, and both particle and energy confinement are consequently significantly enhanced. On the other hand, the fraction of bootstrap current and LH driven current at the ITBs location increases once the ITBs are formed, and the shear reversal becomes larger. As shown in figure 9, the H factor
 $H_{98}$
increases from 0.8 to approximately 1.2.
 $\unicode[STIX]{x1D6FD}_{N}$
(
 ${\approx}2.9$
),
 $f_{\text{boot}}$
(
 ${\approx}0.35$
), and
 $W_{\text{dia}}$
(
 ${\approx}0.73$
MJ) are also improved significantly as compared with the case without ITBs.
Results of simulated EAST advanced scenario showing: profiles evolution of (a) electron temperature (
 $T_{e}$
), (b) ion temperature (
 $T_{i}$
), (c) safety factor (
 $q$
), (d) total current density (
 $j$
). The ITBs position are indicated by the vertical shaded region.

3.2.3 High
 $\unicode[STIX]{x1D6FD}_{N}$
and high
$T_{e}$
scenario


In the high
 $\unicode[STIX]{x1D6FD}_{N}$
scenario, the toroidal magnetic field is set to 1.8 T, and
 $H_{\text{ref}}$
is assumed to 0.8 and 1.0 separately. With the injection power
 $P_{\text{lhw}}=2$
MW,
 $P_{\text{nbi}}=3$
MW,
 $P_{\text{icrf}}=5$
MW, a fully non-inductive scenario has been achieved with
 $\unicode[STIX]{x1D6FD}_{N}$
up to 4.5 that exceeds the no-wall stability limit of
 $4\times li$
, where
 $li$
is the plasma internal inductance (see figure 11). The
 $H_{\text{ref}}$
factor is assumed to be 1.0 in the high-
 $T_{e}$
scenario and the electron cyclotron resonance heating (ECRH) regime is used to achieve high electron temperature. It can be seen from figure 12 that the predicted central electron temperature
 $T_{e0}$
reaches approximately 10 keV for
 $n_{e,\text{bar}}=2.8\times 10^{19}~\text{m}^{-3}$
.
High-
 $\unicode[STIX]{x1D6FD}_{N}$
scenario with
 $I_{p}=0.6$
MA,
 $n_{e,\text{bar}}=3.6\times 10^{19}~\text{m}^{-3}$
,
 $B_{t}=1.8$
T,
 $P_{\text{lhw}}=2$
MW,
 $P_{\text{nbi}}=3$
MW,
 $P_{\text{icrf}}=5$
MW. Waveforms of (a) plasma current (
 $I_{p}$
) and line-average electron density (
 $n_{e,\text{bar}}$
); (b) additional heating power including lower hybrid wave power (
 $P_{\text{lhw}}$
), neutral beam power (
 $P_{\text{nbi}}$
) and ion cyclotron wave power (
 $P_{\text{icrf}}$
); (c) normalized beta (
 $\unicode[STIX]{x1D6FD}_{N}$
), H factor (
 $H_{98}$
), plasma stored energy (
 $W_{\text{dia}}$
), and internal inductance (
 $l_{i}$
); (d) fractions of lower hybrid driven current (
 $f_{\text{lhw}}$
), neutral beam driven current (
 $f_{\text{nbi}}$
), and bootstrap driven current (
 $f_{\text{boot}}$
); (e) safety factor (
 $q$
) profiles at 15 s and 30 s.

High-
 $T_{e}$
scenario with
 $I_{p}=0.8$
MA,
 $n_{e,\text{bar}}=3.0\times 10^{19}~\text{m}^{-3}$
,
 $B_{t}=2.5$
T,
 $P_{\text{lhw}}=2.5$
MW,
 $P_{\text{fweh}}=3$
MW,
 $P_{\text{ecrh}}=2$
MW. Waveforms of (a) plasma current (
 $I_{p}$
) and line-average electron density (
 $n_{e,\text{bar}}$
); (b) lower hybrid wave power (
 $P_{\text{lhw}}$
) and electron cyclotron resonance heating power (
 $P_{\text{ecrh}}$
); (c) normalized beta (
 $\unicode[STIX]{x1D6FD}_{N}$
), H factor (
 $H_{98}$
), and plasma stored energy (
 $W_{\text{dia}}$
); (d) fractions of lower hybrid driven current (
 $f_{\text{lhw}}$
), and bootstrap driven current (
 $f_{\text{boot}}$
), and central electron temperature (
 $T_{e0}$
); (e) electron temperature (
 $T_{e}$
) profiles and safety factor (
 $q$
) profiles at 15 s and 30 s separately.

4 Conclusion
This paper presents the 0.5-D modelling work undertaken to prepare the operation and scientific exploitation of EAST. Some results of the three main areas of this work have been given, i.e. (i) validation of statistical LH model in METIS by means of C3PO/LUKE calculation; (ii) exploration of operation space of EAST and assessment of the current drive capability; (iii) simulations of prospective scenarios for EAST. Using METIS code with an H/CD mix of LHCD, NBI and ICRF power, rough ranges of operation condition (
 $I_{p}$
,
 $B_{t}$
,
 $n_{e}$
) to use for the development of a non-inductive operation scenario could be determined. Utilizing the high-power level available of the upgraded H/CD systems, an SS H-mode scenario can be most probably achieved as
 $P_{\text{in}}$
exceeds the threshold power
 $P_{\text{thr}}$
. With a hollow current profile modified by LHCD, ITBs with strongly reversed magnetic shear could occur in the vicinity of minimum
 $q$
position. High
 $\unicode[STIX]{x1D6FD}_{N}$
up to 4.5 that exceeds the no-wall stability limit
 $4\times l_{i}$
is obtained at
 $B_{t}=1.8$
T. Using the ECRH regime together with LHCD, a relatively high
 $T_{e0}$
(
 ${\sim}11$
keV) at low
 $n_{e,\text{bar}}$
(
 ${\sim}2.8\times 10^{19}~\text{m}^{-3}$
) is expected.
The main non-inductive current on EAST is provided by the LHCD system. The existing LHCD system has already demonstrated its capabilities for long pulse operation. In particular, the high edge temperature and the high LH frequency (4.6 GHz) show an enhanced CD efficiency compared with the low edge temperature and LH frequency (2.45 GHz) due to the reduced PI effect, and it is of benefit to high-density SS H-mode operation (Ding et al. Reference Ding, Li, Li, Wang, Liu, Shan, Li and Wan2017). Optimizing the use of the LHCD system in combination with ECCD, ICRF and NBI, the EAST will benefit the physics basis for SS H-mode operation of ITER.
These simulations must be confirmed by future experiments, but they give indications of the potential performances that can be reached with the upgraded H/CD system and offer guidance for EAST experiments. More detailed calculations are planned with full 1.5-D codes in order to validate the 0.5-D analysis performed with the METIS code.
Acknowledgements
This work is supported by the National Magnetic Confinement Fusion Science Program of China (grant nos 2015GB102003, 2013GB106001B, 2013GB112003), the National Natural Science Foundation of China under grant nos 11175206, 11305211 and 11275233, the Users with Excellence of Hefei Science Centre, CAS (grant no. 2015HSC-UE005) and the JSPS-NRF-NSFC A3 Foresight Program in the field of Plasma Physics (NSFC no. 11261140328). It is partly supported by the China–France Collaboration program.



