INTRODUCTION
Socioeconomic status, or SES, is a main explanatory variable that effectively accounted for the lower levels of political participation among some minority groups such as African Americans (Leighley and Vedlitz Reference Leighley and Vedlitz1999; Verba et al. Reference Verba, Schlozman, Brady and Nie1993), yet it failed to fully explain the lower levels of political participation among other groups such as immigrants (Bass and Casper Reference Bass and Casper2001; Cho Reference Cho2002; Kam, Zechmeister and Wilking Reference Kam, Zechmeister and Wilking2008; Stoll and Wong Reference Stoll and Wong2007). Why, after achieving comparable and even higher levels of SES relative to native-born citizens, do immigrants still participate less in politics? To answer this question, we turn to the political socialization literature concerning the origins and development of participatory behavior. More specifically, the “formative” or “impressionable” years theories of development, which suggest that the political environment in which individuals spend their early years (preteen to early adulthood) is one of the most influential factors shaping future political behavior.
In the political socialization literature, the formative years effect is often framed in terms of generational or cohort effects (Mannheim Reference Mannheim1952; Markus Reference Markus, Mason and Fienberg1985; Ryder Reference Ryder1965). Individuals who were born in the same generation are assumed to have shared the same historical background and societal environment growing up; thus, they form political preferences and civic engagement habits that are distinctive to their generation. The generational effect, however, is not the only way through which early-life experience affects political behavior. In this paper, we change the focus from variation across time (growing up in the same social and political climate within the United States) to variation in geography (immigrants who come from very different social and political climates outside of the United States). We expect that individuals who immigrated at a young age and spent their formative years in the new country will be most influenced by the new country's political and social environment, and consequently are likely to behave in ways similar to the new country's native-born citizens. Those who moved to a new country after their formative years are expected to be most influenced by their countries of origin, and therefore are less likely to behave like the new country's native-born population.
Our explanation aims to account for the variance in immigrants' political participation that is still left unexplained after controlling for SES. The majority of the current immigrant population moved to the United States as adults, after spending their formative years in their countries of origin. We argue, therefore, that the lower level of political participation among immigrants is driven by the original “imprint” of the civic norms in immigrants” countries of origin. By situating our theory in political socialization and utilizing data on both the native-born and the immigrant population, we seek to bridge the gap between the political socialization and the immigration politics literature. We extend the socialization literature by leveraging the immigration experience to test the formative years theory. We connect to the immigrant literature by providing a theory that explains the behavioral similarities and differences between immigrants and native-born citizens. Building upon existing studies, we extend the scope of inquiry and examine the immigrant population, in its entirety, in conjunction with the native-born population. Our theory in essence suggests that the immigrant status, per se, is not a contributing factor to lower levels of political participation. A different formative experience among some immigrants (those who migrated at an older age) but not the others (those who migrated at a younger age) is the explanation for the participation gap between immigrants and the native-born population.
Methodologically, we address the inherent heterogeneity associated with different countries of origin by employing a hierarchical model to examine the potentially different age at immigration effects based on countries of origin. Using data from the 1994 to 2016 Current Population Survey, Civic Engagement and Voting Supplements, we carry out the empirical analysis in two stages. In the first stage we employ a baseline SES model and incorporate age at immigration as a series of dummy variables. We find that one's age at immigration has the expected effect. In the second stage we develop a hierarchical model to simultaneously account for region-, country-, and individual-level variables and examine how the age at immigration effects vary by countries of origin. With a hierarchical model, we are able to account for four country-level factors at the aggregate level, which directly tested relevant theories and improved upon previous literature where country-level factors were often accounted for at the individual level. The hierarchical analysis confirms the first-stage findings that age at immigration is a significant contributor to immigrants' political participation. Using the parameters estimated from the hierarchical model, we hold all other variables at constant, vary ages at immigration, and simulate the levels of political participation of immigrants from over 130 countries. The simulation results show that after accounting for the multi-level variables, the majority of those who migrated at a young age participate in politics at a rate that is indistinguishable from that of the native born population, supporting the formative years theory.
Our findings are significant to our understanding of immigration politics. Political scientists have observed that public perception towards immigrants and immigration reform is directly related to whether or not we consider an immigrant as one of “us” or one of “them.” We have found that if an immigrant grew up in the United States, e.g. a “dreamer”, the term used to describe young people who were brought to the United States as children, grew up in the United States, and became upstanding members of the society, their political participatory behavior is indistinguishable from that of the native-born population.
EXPLAINING IMMIGRANTS' POLITICAL PARTICIPATION: THE FORMATIVE YEARS THEORY AND COMPETING THEORIES
The key argument of the formative years theory is that individuals' political orientations, including attitudes, interests, activism, etc., develop, crystallize, and maturate during the formative years (Alwin and Krosnick Reference Alwin and Krosnick1991; Mannheim Reference Mannheim1952; Meadow Reference Meadow1982; Merelman and King Reference Merelman and King1986). Ones' early-years experiences, therefore, matter disproportionately in influencing attitudes and behavior. Social and political events experienced during one's youth are more likely to be recalled as important (Schuman and Corning Reference Schuman and Corning2012; Schuman and Rieger Reference Schuman and Rieger1992). Preadult political socialization seems to leave a lasting “imprint” on individuals' subsequent political behavior (Bartels and Jackman Reference Bartels and Jackman2014; Beck and Jennings Reference Beck and Kent Jennings1982; Butler and Stokes Reference Butler and Stokes1969; Converse Reference Converse1969; McPhee and Ferguson Reference McPhee, Ferguson, McPhee and Glaser1962; Merelman and King Reference Merelman and King1986).
A common strategy to identify the effect of the formative years is to exploit variation in the set of political events experienced by different cohorts or generations who grew up during different political times. The New Deal generation was consistently more Democratic compared to other generations at similar ages (Campbell et al. Reference Campbell, Converse, Miller and Stokes1980). The protest generation, consisting of individuals who came of age during the anti-Vietnam War protest in the 1960s, exhibited higher levels of political involvement throughout their lifetime than those who came of age in different times (Jennings Reference Jennings1987; Reference Jennings2002). Women who came of age immediately after suffrage were significantly more likely to vote compared to women who came of age right before or during suffrage (Firebaugh and Chen Reference Firebaugh and Chen1995).
The difficulty in leveraging the generational effects – induced by time-specific political events during formative years – as a way to examine the formative years theory is that it is methodologically challenging to cleanly separate the generational effects from the period and the life-cycle effects, all of which are related to age. Generational effects are distinctive behavioral patterns specific to one generation but not the others. Period effects are the influence of significant political and social events across all generations. Life-cycle or aging effects refer to behavior patterns that change with age.Footnote 1 Recent scholarship has advanced a number of techniques specifically for Age-Period-Cohort modeling. Bartels and Jackman (Reference Bartels and Jackman2014) developed an “imprinting” model which allows different weights to be attached to different political events depending on the age at which an event was experienced. Stegmueller (Reference Stegmueller2014), within a Bayesian hierarchical framework, employed an informed a prior to account for the linear trend of past cohort random effects when estimating current cohort random effect.Footnote 2 Most research that employed recently developed statistical techniques confirmed a formative years effect, as noted by Bartels and Jackman (Reference Bartels and Jackman2014): “The striking implication is that adolescent political experiences play a substantial role in shaping partisan identities throughout the life-course (Reference Bartels and Jackman2014:17).”
We add to the formative years literature by leveraging different country-of-residence experiences during the formative years as an alternative to Age-Period-Cohort modeling. By changing the focus from the temporal dynamics of growing up in the same political zeitgeist to variation in geography, we are able to circumvent some of the methodological challenges faced by the Age-Period-Cohort literature. Applying the formative years theory to immigrants’ political participation, we argue that, because those who migrated into the United States at a young age spent their formative years in the United States together with the native-born population and experienced the same political institutions, civic cultures, and citizenship norms, they should behave similarly to the native-born citizens regarding political participation.
In general terms, “growing up in the U.S.” versus “growing up abroad” is the mechanism that we theorize and empirically examine as the way through which formative years’ experiences affect political participation. We believe that “growing up in the U.S.” means the political participatory norms in the United States are transmitted through mass media, formal education, and peer interactions. Regular news coverage of political protests conveyed the message that political participation is an integral part of civil society.Footnote 3 Formal education such as a civic class in middle school and high school often uses examples such as the Civil Rights Movement to emphasize the importance of political participation and its positive societal impact.Footnote 4 Schools also provide volunteering opportunities that encourage civic engagement.Footnote 5 Interaction with one's peers, especially in the context of group activities, could create a “bandwagon” effect in which otherwise reluctant individuals are motivated to participate in politics with their peers for solidary benefits.Footnote 6
In this article, we examine the effect of growing up in an environment where the media, school education, and peer socialization shapes political behavior. There are at least two competing theories that would predict a different pattern of results. If the competing theories better explain political socialization and immigrant political participation, we would find little to no effect of our main variable of interest, age at immigration. The two competing theories are the life-long openness and the parental socialization theories. Life-long openness theory argues that individuals' political behavior evolves throughout ones' lifetime, that changes in behavior are not limited in the formative years (Heckhausen, Wrosch and Schulz Reference Heckhausen, Wrosch and Schulz2010; Roberts and Mroczek Reference Roberts and Mroczek2008). Under the right circumstances, adults' political attitudes and behavior could also exhibit significant shifts. For example, Dinas (Reference Dinas2014) find that, for those who were politically active, their activism was likely to open them up to new information and consequently induce new political beliefs later in life. Life-long openness theory may be especially applicable to the immigrant population because immigrants undergo significant life changes when moving to the United States. Because of the act of migration, immigrants may have been more open to changes in political behavior that otherwise would not have occurred had they remained in their origin countries. Pantoja, Ramirez and Segura (Reference Pantoja, Ramirez and Segura2001) find that a politically charged environment has a positive effect on newly naturalized immigrants' voting turnout rate, as these immigrants, even though well past their formative years, saw voting as an expression of support to their side in a charged political debate. If the life-long openness theory better explains behavioral patterns than the formative years theory, we would observe no difference between immigrants who moved to the United States at a younger age and those who moved at an older age, or we would even find that immigrants who moved to the United States at a younger age were less likely to participate in politics.
Additionally, we make the theoretical assumption that immigrants' media consumption, formal education, and peer socialization experiences in their youth are the key elements that influence political behavior later in life, and de-emphasize parental socialization. Parental socialization is well-established as one of the most important elements of political socialization (Jennings and Niemi Reference Jennings and Niemi1981). If parental socialization is the primary method for the transmission of norms underpinning democratic citizenship, we would find that age at immigration has limited impact on participation later in life, because immigrants who migrated at a very young age are likely to be raised by parents who are also immigrants but migrated at an older age. Under parental socialization theory, immigrants who migrated at a young age would behave similarly to their parents. For our purposes, we are interested in finding out whether an age at immigration effect persists despite these two competing theories.
EXPLAINING IMMIGRANTS' POLITICAL PARTICIPATION: THE IMMIGRANT POLITICS LITERATURE
For most U.S. immigrants, their motivation for migration is an economic one as moving to the United States often means better job perspectives and higher incomes (Massey et al. Reference Massey, Arango, Hugo, Kouaouci, Pellegrino and Edward Taylor1993; Reference Massey, Arango, Hugo, Kouaouci, Pellegrino and Edward Taylor1994; Massey, Durand and Malone Reference Massey, Durand and Malone2002).Footnote 7 Only a small fraction moved to the United States for political reasons.Footnote 8 Because immigration is fundamentally economically motivated, we have no reason to expect that one's immigrant status would cause higher or lower levels of political participation. However, the literature on immigrants' political participation has long since observed immigrants' lower level of participation even after controlling for SES (Bass and Casper Reference Bass and Casper2001; Hajnal and Lee Reference Hajnal and Lee2011; Kam, Zechmeister and Wilking Reference Kam, Zechmeister and Wilking2008; Ramakrishnan Reference Ramakrishnan2005; Stoll and Wong Reference Stoll and Wong2007).Footnote 9 There has been a number of explanations for immigrants' lack of participation. Some argue that immigrants, especially Asian Americans, prefer certain forms of political involvement such as direct campaign donations (Cho Reference Cho2002; Lai et al. Reference Lai, Tam Cho, Kim and Takeda2001). Others suggest that the missing link is a lack of purposeful and effective political mobilization from candidates, political parties, and organizations (Fraga Reference Fraga2016; Hajnal Reference Hajnal2009; McCann and Chávez Reference McCann and Chávez2016; Wong Reference Wong2006). It is shown that using the right strategy, mobilization effort can increase minority voter turnout (Bedolla and Michelson Reference Bedolla and Michelson2012; Garcia Bedolla and Michelson Reference Garcia Bedolla and Michelson2009; Michelson, García Bedolla and McConnell Reference Michelson, García Bedolla and McConnell2009). When immigrant communities perceive imminent political threat and are mobilized to participate, such as the case of Arab Americans in the aftermath of 9/11, immigrants were also able to overcome barriers and increase levels of political participation (Cho, Gimpel and Wu Reference Cho, Gimpel and Wu2006; Pantoja, Ramirez and Segura Reference Pantoja, Ramirez and Segura2001).
These explanations are useful yet not entirely satisfactory. They are useful in that the researchers accurately observed that the behavior of immigrants is in many cases different from that of the native-born citizens, and sometimes the cause of the difference is external such as the lack of recruitment effort from candidates, political parties, and organizations. The explanations are not entirely satisfactory in that most implicitly focused on the “otherness” of immigrants, on what sets the immigrants apart. When advocating for their rights in the recent immigration debate, many young immigrants were very vocal about their similarities with, not differences from, the native-born population. This is exactly what we are trying to examine here. Is it possible that one's immigrant status is not a contributing factor to the lack of participation?
To answer this question, the key is the age at immigration. A number of previous studies on immigrants' linguistic, social, and political assimilation have taken into consideration the age at which individuals migrated. Different ages at immigration imply different developmental characteristics, life stages, and sometimes reasons for immigration (Portes and Rumbaut Reference Portes and Rumbaut2001; Portes, Fernández-Kelly and Haller Reference Portes, Fernández-Kelly and Haller2009). It is found that age at immigration has, in general, a negative relationship with levels of assimilation. Those who migrated at an older age have less English proficiency (Kulkarni and Hu Reference Kulkarni and Hu2014), are less academically successful (Portes and Fernández-Kelly Reference Portes and Fernández-Kelly2008), face greater barriers participating in politics (Abrego Reference Abrego2011), and are in general less acculturated into the mainstream American society (Rumbaut Reference Rumbaut2008; Rumbaut and Komaie Reference Rumbaut and Komaie2010).
Even though we are not the first ones who take into consideration the effect of age at immigration, we are the first to apply this crucial consideration to bridge the political participation gap between immigrants and the native-born population. There are two main differences between existing research and ours. First, existing literature emphasizes that age at immigration directly affects one's life experience after the migration (e.g. linguistic and culture assimilation), we argue that age at immigration matters to both the pre-migration (the original behavioral “imprint” brought from origin country) and the post-migration experience. For example, Wals (Reference Wals2011; Reference Wals2013) shows that, for Mexican migrants in the United States, their political views previously developed in Mexico had a direct impact on their political views and participatory habits after they migrated to the United States. While we fully agree with the idea that pre-migration political views matter, we also argue that, in order for the pre-migration views to matter, these views had to be developed in the first place. In other words, we only assume that one's pre-migration experience matters when this immigrant moved to the United States at an older age and had a chance to experience political socialization in their country of origin. This consideration has to be examined empirically through an interactive term between age at immigration and pre-migration experience, not by either one alone.
Second, existing literature mainly focuses on explaining the variance of political participation among the immigrant population, especially among a specific ethnicity. This kind of fragmentation delves deeper into the immigrant sub-populations and helps depicting a more nuanced picture of immigrant politics, however, it separates immigrants from the rest of the population. We include immigrants from various origins together with the native-born citizens and study immigrants as a segment within the U.S. population: we conceptualize the behavioral differences between immigrants and the native-born population to be comparable to the differences between, for example, baby boomers and Gen X, all of which segments of the U.S. population but with different formative experiences.
DATA
To empirically examine how different formative years experiences affect immigrants' political participation, we use the November supplements of the Current Population Surveys (CPS) for election years between 1994 and 2016 as our main datasets. The CPS is a large-scale and nationally-representative survey conducted by the U.S. Census Bureau for the Bureau of Labor Statistics. Since the 1970s,Footnote 10 the CPS has included a voting and registration supplement, and in 2008 the survey included several additional items on civic engagement.Footnote 11 One of the advantages of the CPS data is its large sample size, which allows for sufficient statistical power to examine small sub-populations. Each of our datasets includes tens of thousands of adult respondents and thousands of immigrants from over a hundred countries, and a variety of different personal backgrounds. An additional advantage of the dataset is its wealth of demographic, socioeconomic, and political information collected from the respondents. It includes information crucial for the purpose of this research, such as year of immigration,Footnote 12 country of origin, and political participation. It is important to note that while CPS asks about citizenship status (U.S. citizen or non-citizen), it does not further inquire about non-citizens' documentation status, so we do not know if a non-citizen is a resident alien, a non-resident alien, or an undocumented immigrant.
Our data are richest when it comes to voting participation. We can draw upon a database of hundreds of thousands of completed interviews spanning more than 20 years. However, a focus on voting will restrict our attention to the segment of immigrants who are naturalized citizens, so while we begin with voting, we will show that our pattern of results is similar when we examine non-voting participation. The data allow us to control for age, sex, race, income, education, citizenship, and whether the respondent was answering for him or herself or others in the household.Footnote 13 A limitation to our data is that levels of political participation are self-reported, which is likely to inflate the actual levels of political participation.Footnote 14
EMPIRICAL ANALYSIS
Our empirical analysis strategy unfolds in two stages. First, we adopt a “standard” approach to set the baseline for both voting participation and non-voting participation. This first look at the data examines political participation from a resources based perspective using SES status as the main predictor of political involvement, informed by classics such as Berelson et al. (Reference Berelson, Lazarsfeld, McPhee and McPhee1954) and Campbell et al. (Reference Campbell, Converse, Miller and Stokes1980). Second, we develop a hierarchical model to simultaneously account for three levels of variables: region-, country-, and individual-level. Ideally, we would like to apply the hierarchical model to both voting participation and non-voting participation as well. However, because less than half of the immigrant population were voting eligible, we do not have sufficient data to satisfactorily apply the hierarchical model to voting participation. Recall that to examine the formative years’ effect, we need to essentially find the interactive effect between the country of origin and age at immigration. If we examine voting participation, for more than 40 countries we would have fewer than 30 observations which would be further divided into two age groups (pre- and post- formative years). As a result, we would either have to deal with a great amount of uncertainty or drop some of the countries. When we examine non-voting participation, we are able to double the number of observations and therefore obtain a more confident result.
To present the result, we use the parameters estimated from the hierarchical model and simulate levels of political participation for two scenarios: one scenario is an immigrant who moved to the United States at the age of 5 with all other characteristics held as constant, and the other scenario an immigrant who migrated at the age of 25 with the same characteristics. We choose these two age thresholds because the formative years can start as early as the 1st grade, around 6 years old (Jennings and Niemi Reference Jennings and Niemi1974; Hess, Torney-Purta and Valsiner Reference Hess, Torney-Purta and Valsiner2005), and can last as late as the mid-twenties (Miller and Sears Reference Miller and Sears1986; Henry and Sears Reference Henry and Sears2009).Footnote 15 By choosing the thresholds of age 5 and age 25, we have immigrants who spent their formative years in the United States and those who spent their formative years in their countries of origin. We then compare these two “immigrants” with a similarly situated native-born citizen.
The Standard Model
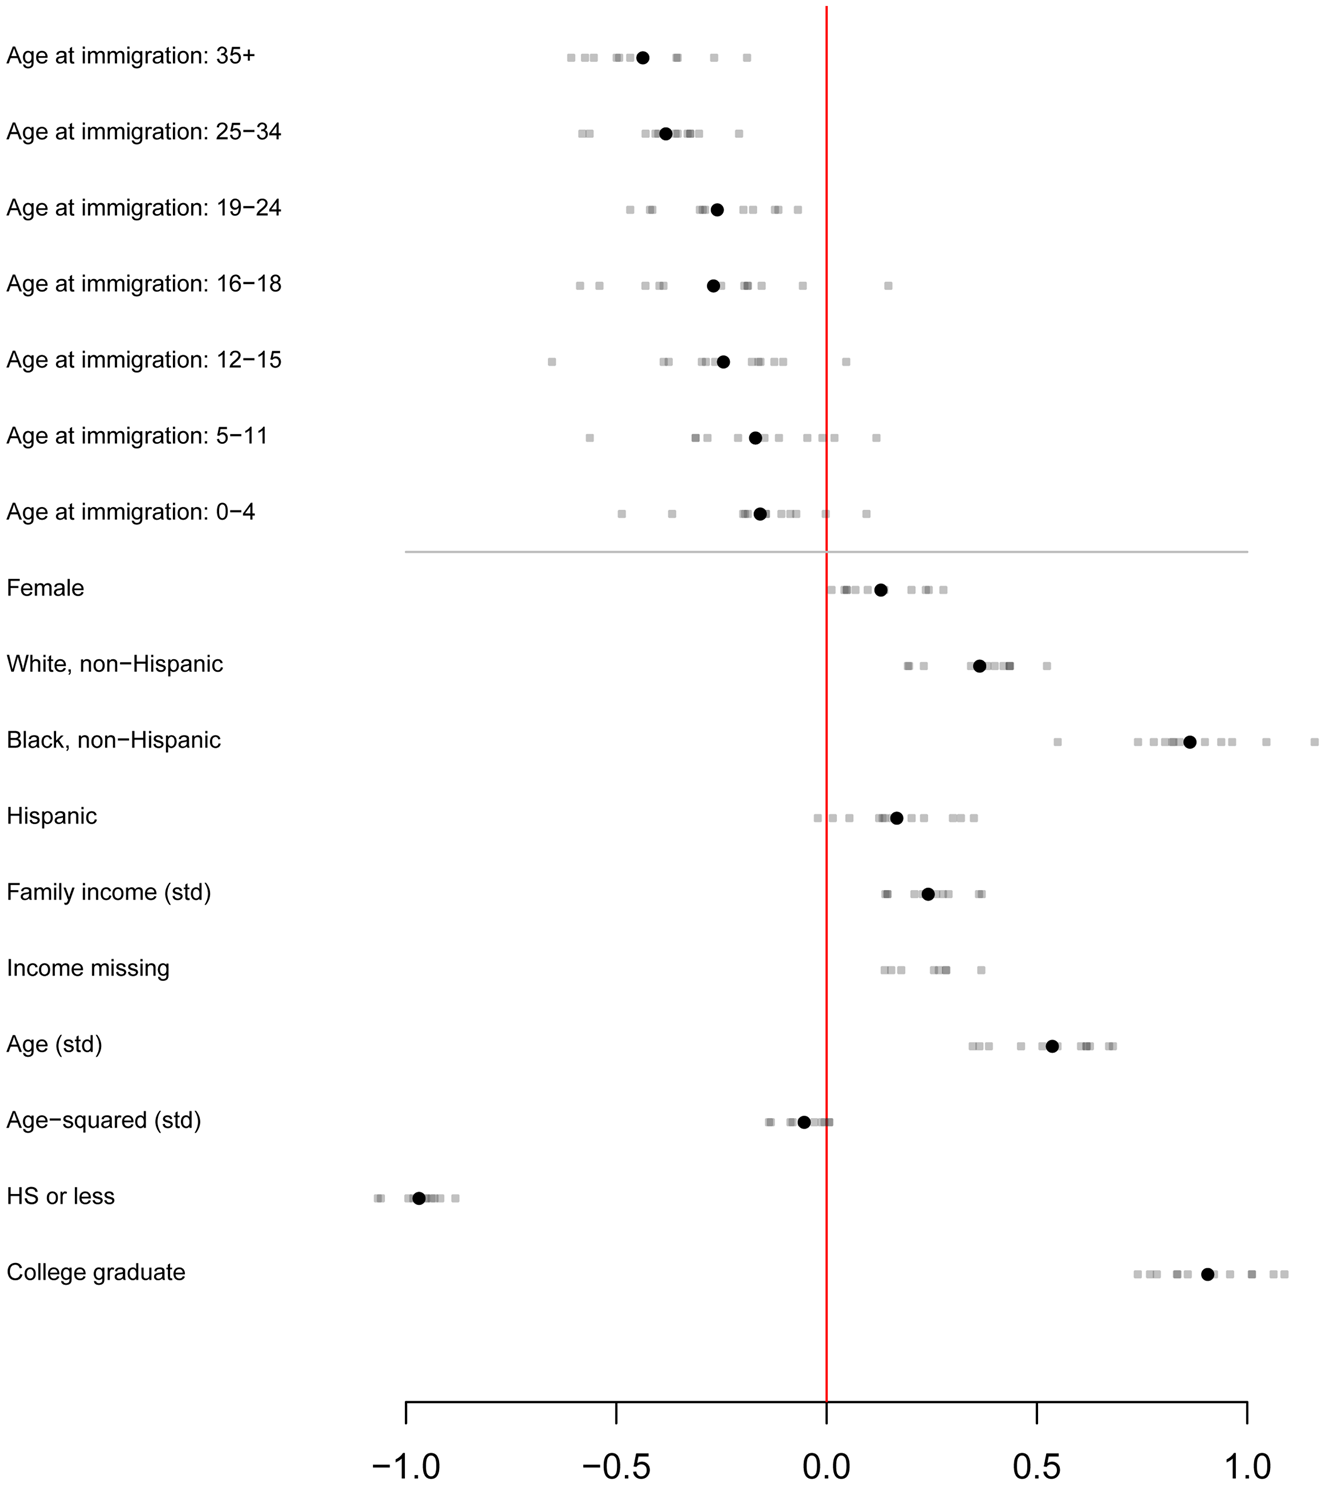
We begin our empirical analysis with a basic single-level model of political participation that accounts for demographics and SES. With 12 election years of data on voting, we fit 12 separate probit models, one for each year, resulting in a combined total of over 980,000 observations (including more than 65,000 naturalized immigrants eligible to vote). The results of these models are summarized in Figure 1.Footnote 16 The grey points show the regression coefficients from each model and the black points the average coefficient across all of the models. The top half of the figure shows the effects of age at immigration as dummy variables. As the age at immigration increases, its negative effect on voting also increases. For example, migrating between that age of 25 and 34 has a significantly larger negative impact on voting compared to migrating between the age of 0 and 4. In fact, the estimated effect for the youngest age at immigration category (0–4) clustered near zero. The overall pattern supports the idea that political participation decreases as age at immigration increases. The bottom half of the figure shows the effects of control variables. As expected, income and education are positively associated with voting, age increases voting turnout, and both blacks and whites are more likely to vote.
Effect of age at immigration and SES on voting behavior, 1994–2016

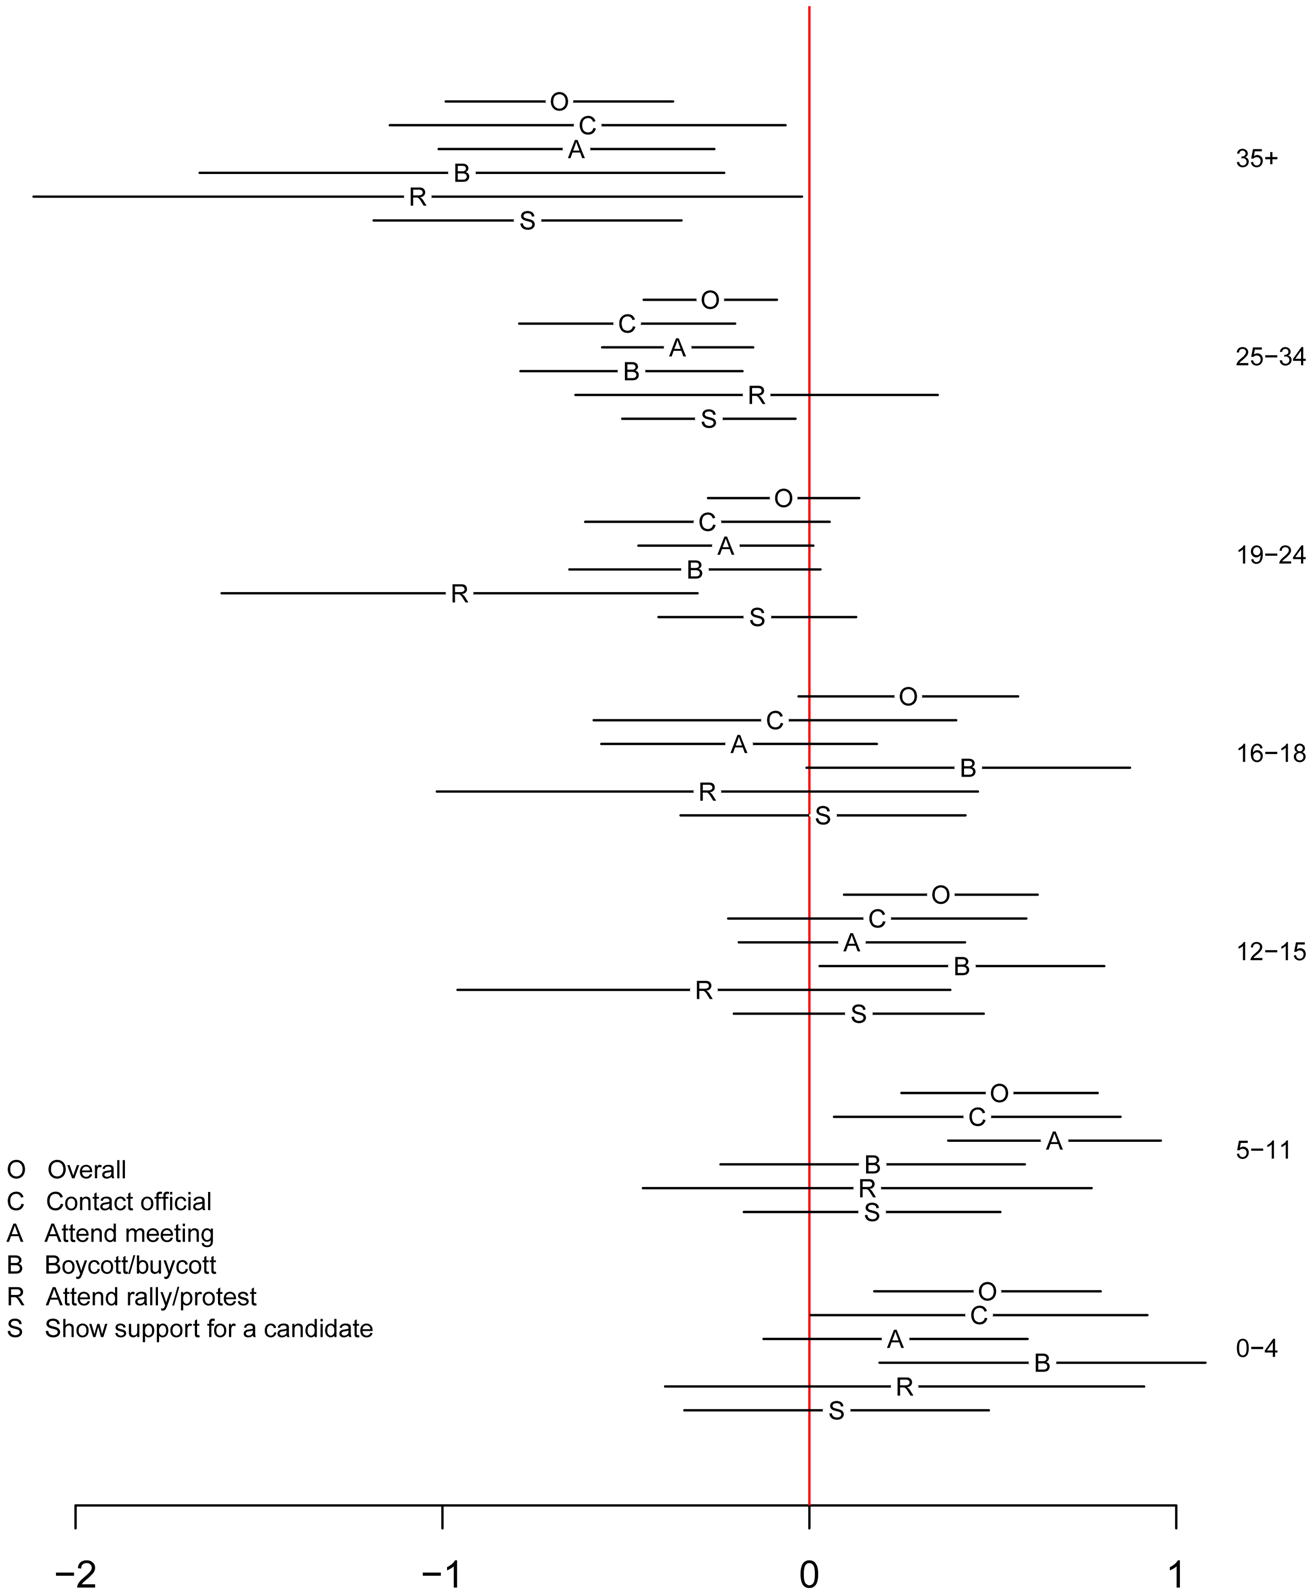
We see a similar pattern when we look at non-voting participation. About half of the immigrants in our data were not citizens at the time they were interviewed, thus studying non-voting forms of political participation is crucial for the understanding of the immigrant population as a whole. If we examine only voting, we would have excluded half of the immigrant observations. Using a similar regression strategy as we used in the voting analysis, we estimate the age at immigration effects as a series of dummy variables after controlling for demographics and SES.Footnote 17Figure 2 shows the estimated effect of different ages at immigration across five different modes of participation (Contacting public officials, attending public meetings, buying or boycotting a product for political reasons, participating in a rally or protest, and showing support for a candidate.) Note that because CPS only included a Civic Engagement Supplement that is useful to us in 2008, the data that we analyzed cover a shorter time span but still contain around 6000 observations. We see a similar pattern in non-voting participation as we did in voting. Immigrants who migrated to the United States at older ages were significantly less likely to participate in politics across a range of different activities than those who came when they were very young.
Effect of age at immigration on non-voting behavior, 2008

The Hierarchical Model
The baseline SES model is the starting point of our empirical analysis that accounts for individual-level variables. Given our theory's emphasis on the formative experiences in countries of origin, we develop a hierarchical model that simultaneously accounts for the individual-, country-, and region-level variables, and approximate the formative years effect with the country of origin effects. We choose non-voting political participation as the dependent variable because it does not have a citizenship requirement so as to be inclusive of non-citizen immigrants, naturalized citizen immigrants, and native-born citizens. The dataset that we use was the Current Population Survey's 2008 Civic Engagement Supplement as it is the only year in recent years when the U.S. Census Bureau included sufficient questions in its Civic Engagement Supplement to suit the purpose of our study. The dependent variable is coded “1” if the respondent participated in at least one of the five activities: contacting public officials, attending public meetings, buying or boycotting a product for political reasons, participating in a rally or protest, and showing support for a candidate, “0” if the respondent participated in none of these activities.
The first level of the model takes the following form:
 $$\eqalign{& y_i \sim Bernoulli\lpar {\,p_i} \rpar \cr p_i = {\rm \Phi} \lpar X_i\beta + \delta_{country\lsqb i \rsqb} \, \times \,& \alpha_{AgeAtImmig \lsqb i \rsqb, country \lsqb i \rsqb} + \gamma_{state\lsqb i \rsqb} \rpar \cr & \gamma_i \sim Normal \lpar {0,1} \rpar}$$
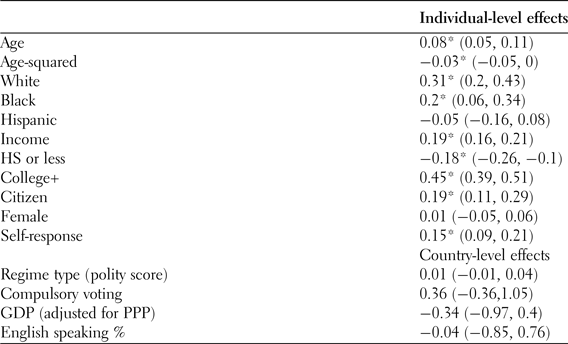
At the individual level, we control for several factors (β) known to influence political participation such as demographics and SES, similar to the baseline model. The first level also includes an effect (γ) for the individuals' state of residence, and the state effect is drawn from a normal distribution. At the second level of the model, the individuals are nested in their countries of origin. At the top level, countries are nested within cultural regions.
 $$\eqalign{\delta_j \sim Normal(A_{region\lsqb j \rsqb} \,+ \, & B_1^{\,\, \ast} Regime \lsqb j \rsqb + B_2^{\,\, \ast} CompulsoryVote \lsqb j \rsqb \cr & + B_3^{\,\,\ast} PPP \lsqb j + B_4^{\,\,\ast} English\lsqb j \rsqb \rsqb, \tau_{region\lsqb j \rsqb}) \cr &\tau_{region} \sim Gamma \lpar {10,10} \rpar} $$
The country-level effects are assumed to be drawn from a normal distribution. We include four country-level factors at this second level of the model. The first is regime type (B 1) that we measure with the polity score developed in the Polity IV project, which categorizes world regimes into autocracies (−10 to −6), closed anocracies (−5 to 0), open anocracies (1 to 5), democracies (6 to 9), and full democracies (10). We choose to use polity score as it is one of the more nuanced measures available that capture the notoriously complex notion of regime type. The effect of regime type could be multi-directional. On the one hand, coming from a repressive regime could mean a lack of political participation opportunities and therefore a lack of participation habits. On the other hand, coming from a repressive regime could motivate immigrants to seize the opportunities to participate in politics in the United States, as such opportunities were previously unavailable.
The second factor is whether or not the country instituted and enforced compulsory voting (B 2), a dummy variable where countries with enforced compulsory voting were coded as “1” and otherwise “0”. We expect the compulsory voting variable to have a positive effect on participation, as the literature suggests that voting is habit-forming. Immigrants from countries with enforced compulsory voting laws were more likely to have voting experience and therefore voting habits. The third is GDP per capita, adjusted for purchasing power parity (B 3), as we would like to account for the general economic conditions in the origin countries, which we expect to have a positive effect as well. The fourth variable is the proportion of the country's population that speaks English (B 4) due to the expectation that immigrants who come from countries that have a higher proportion of English speakers are likely to be better equipped to participate in politics.
The country of origin effect is allowed to vary conditional on age at immigration (α), and countries in the model are also nested within cultural regions. We do not have any region-level predictors in the model, but nesting the country-level effects within region will allow us to “borrow strength” from similar countries in the estimation of effects for countries in our data that do not have as many immigrants.
To identify the model, we constrain the δ effect for the United States, which is the effect for native-born citizens of the United States, to be equal to zero, the α effect for those who migrated after 25 to be 1, and the α for those who migrated before 25 bound between 0 and 1. By doing so, we allow those who migrated at an older age to experience the full extent of their country of origin effect, and those who migrated at a younger age a portion of that effect, as informed by the baseline analysis. Note that for the younger age groups, their α effects are estimated by the model. We use JAGS (Just Another Gibbs Sampler) 3.0 for model estimation. After a “burn-in” period of 10,000 iterations, we kept the next 10,000 samples from the Gibb's sampler. Visual inspection of the chains suggested good mixing, and formal Geweke tests of convergence suggest the Gibb's sample had converged on the approximate posterior distribution.
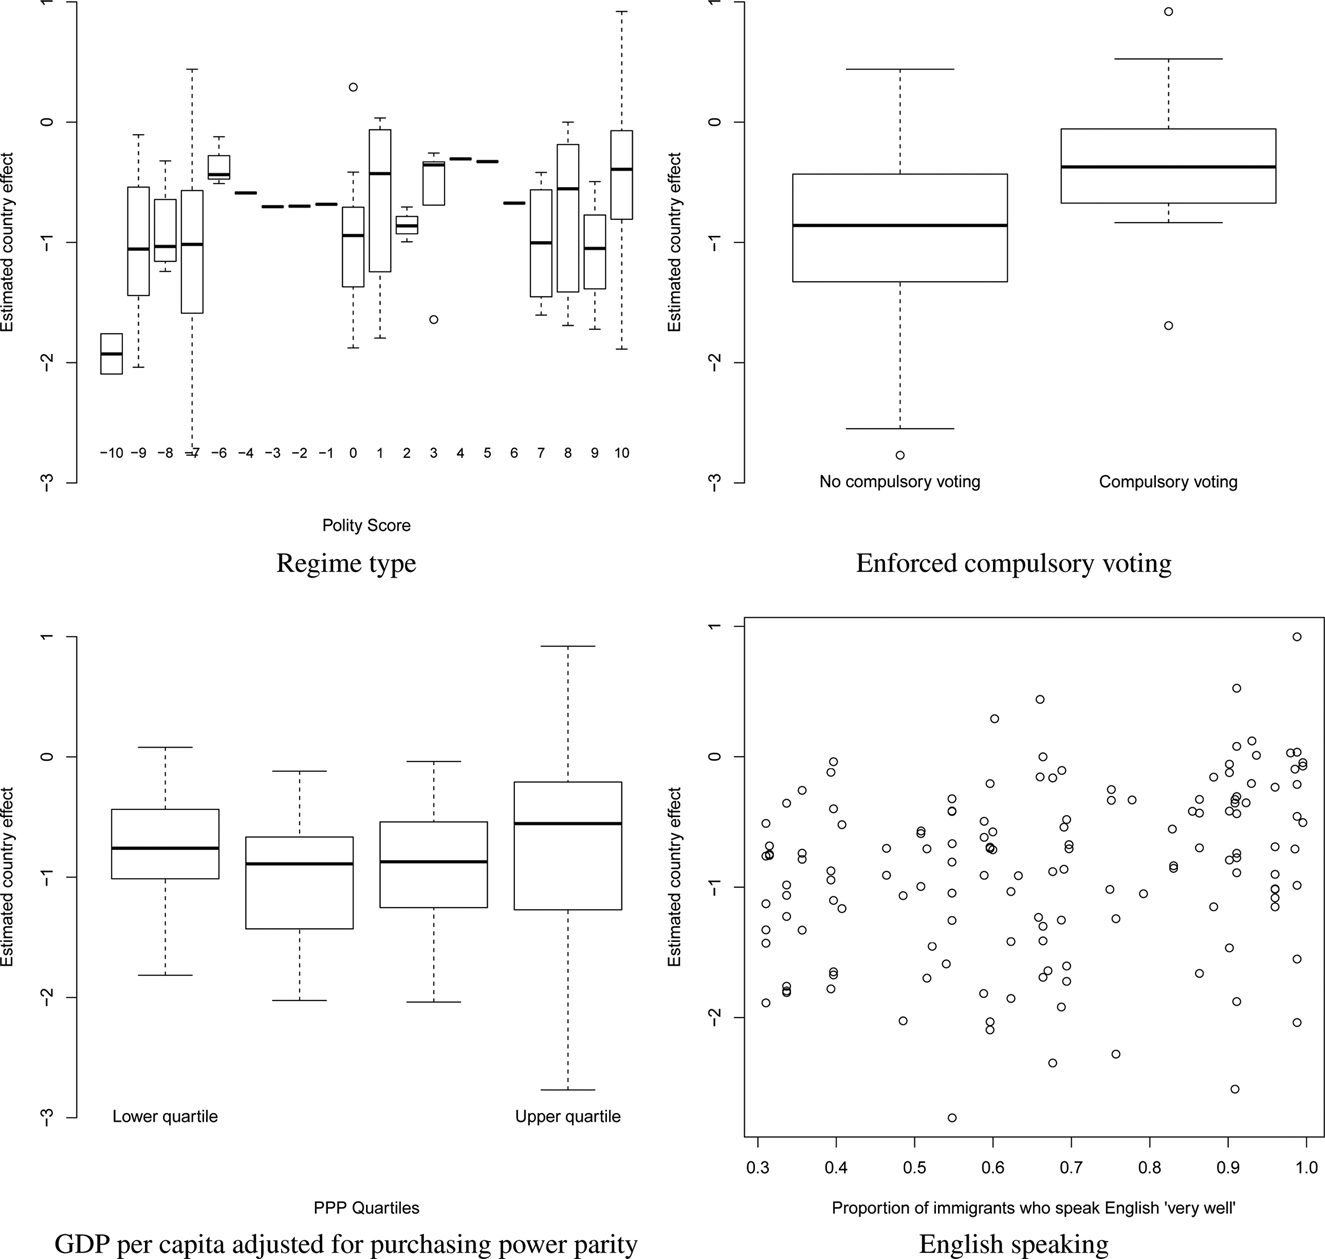
The effects of the four country-level control variables are visualized in Figure 3, which plots the value of the control variables against the estimated country-level effects.Footnote 18 Effects that are below zero indicate net negative effects on participation, and effects above zero indicate positive effects. In terms of regime type, if there is an effect, we should see a linear or curve linear relationship trending upwards as polity score increases, which would indicate that democracies and full democracies have a more positive influence on political participation than non-democracies, but it is not what the results show. The effects of different regime types largely overlap. If we focus on the most democratic regimes and compare them with the least democratic ones, we could see that the least democratic regimes have a larger negative effect. However, if we examine the whole spectrum of regime types, it would be a stretch to claim statistical evidence on an overall effect. The results are not entirely surprising in that Ramakrishnan and Espenshade (Reference Ramakrishnan and Espenshade2001) and Ramakrishnan (Reference Ramakrishnan2005) also found the origin country's regime type did not directly affect immigrants' political participation. The previous research was done at the individual level, and our analysis provides similar results at the country-level. It is possible that regime type is less important than what we previously thought, or that the effect of regime type is multi-directional and the positive ones cancel out the negative ones, or that a country's polity score is a poor proxy for the political norms and participatory habits of a country's citizenry.
Effects of country-level variables

The compulsory voting variable is similarly insignificant as the estimated effects of the two categories overlap. Should an effect exist, we would observe “compulsory voting” have a discernibly more positive effect than “no compulsory voting.” This null finding is interesting as it could indicate that the voting habits formed under compulsory voting may not be the same as the voting habits formed without compulsory voting. The literature has long demonstrated that having voted in a previous election predicts voting again in the next election (Gerber, Green and Shachar Reference Gerber, Green and Shachar2003; Plutzer Reference Plutzer2002). It is important to note, however, that the habitual voting literature used data from non-compulsory voting countries for obvious reasons. It is thus more accurate to say that having voted in a previous election voluntarily predicts voting again in the next election. Our finding suggests that having voted in a previous election if it was compelled by law, may not have the same predictive power of voting in future elections. Barring a natural experiment (e.g. a country changing its compulsory voting laws), it is difficult to compare the lasting effects of voluntary voting against legally required voting, but our analysis with immigrants affords us a peek at a possible difference.
The GDP Per capita and the English speaking variables do not have the expected effects either. There is not sufficient variance to indicate any trend between the effects of low GDP and high GDP countries or between less English-speaking and more English-speaking countries. These null findings are less surprising in that unlike regime type and compulsory voting, GDP and English speaking are not political variables. While we have reasons to expect that economical prosperity and an English-speaking environment may contribute positively to political participation, the effects would be indirect. The finding that none of the country-level variables is significant speaks to the difficulty of accounting for the political participatory norms in countries. We know that there is a country-of-origin variance in terms of immigrants' political participation in that some countries' immigrants participated more than the others. In this analysis, we tried to use these four variables to capture some of the contributing factors, and the results were weak at the best. The variance that is left unexplained is then captured by the country of origin effects.
Interpretation of the country of origin effects requires some care. It is tempting to just examine the estimates in the model and compare relative sizes, but this would be misleading. Immigrants' country of origin is highly correlated with at least one factor that is contained in our matrix of control variables: race. For example, it is impossible to separate the effect of being from Sub-Saharan Africa from any systematic effect of race. Additionally, our model decomposes the age effect into two components: years in the United States, and years out of the United States. For our native-born respondents and any immigrants who came to the United States before their first birthday, years in the United States will be equal to their age. For other immigrants, however, we have considerable variance on years inside and years outside the United States. When we are examining the effect of immigrating at a young age, we need to take this into account. It does not make sense to try to think about the effect of immigrating at a young age (the α effect) apart from the fact that these people will also have spent fewer years outside of the United States.
Consequently, in presenting the results, we present simulated quantities of interest. In the plots that follow, we show the estimated effects for an individual holding education and income at its sample mean value, race at its mean levels within each country (e.g. immigrants from Mexico will be largely classified as Hispanics, immigrants from Nigeria will be largely classified as black, etc.), at a constant age of 45. For our estimates of the effect of immigration on someone who immigrated at a younger age, we assume that the individual immigrated when she/he was 5 and has spent 40 years in the United States. For estimates of the effect of immigration on older immigrants, we assume that the individual immigrated when she/he was 25 and has spent 20 years in the United States. We also hold citizenship constant for immigrants.
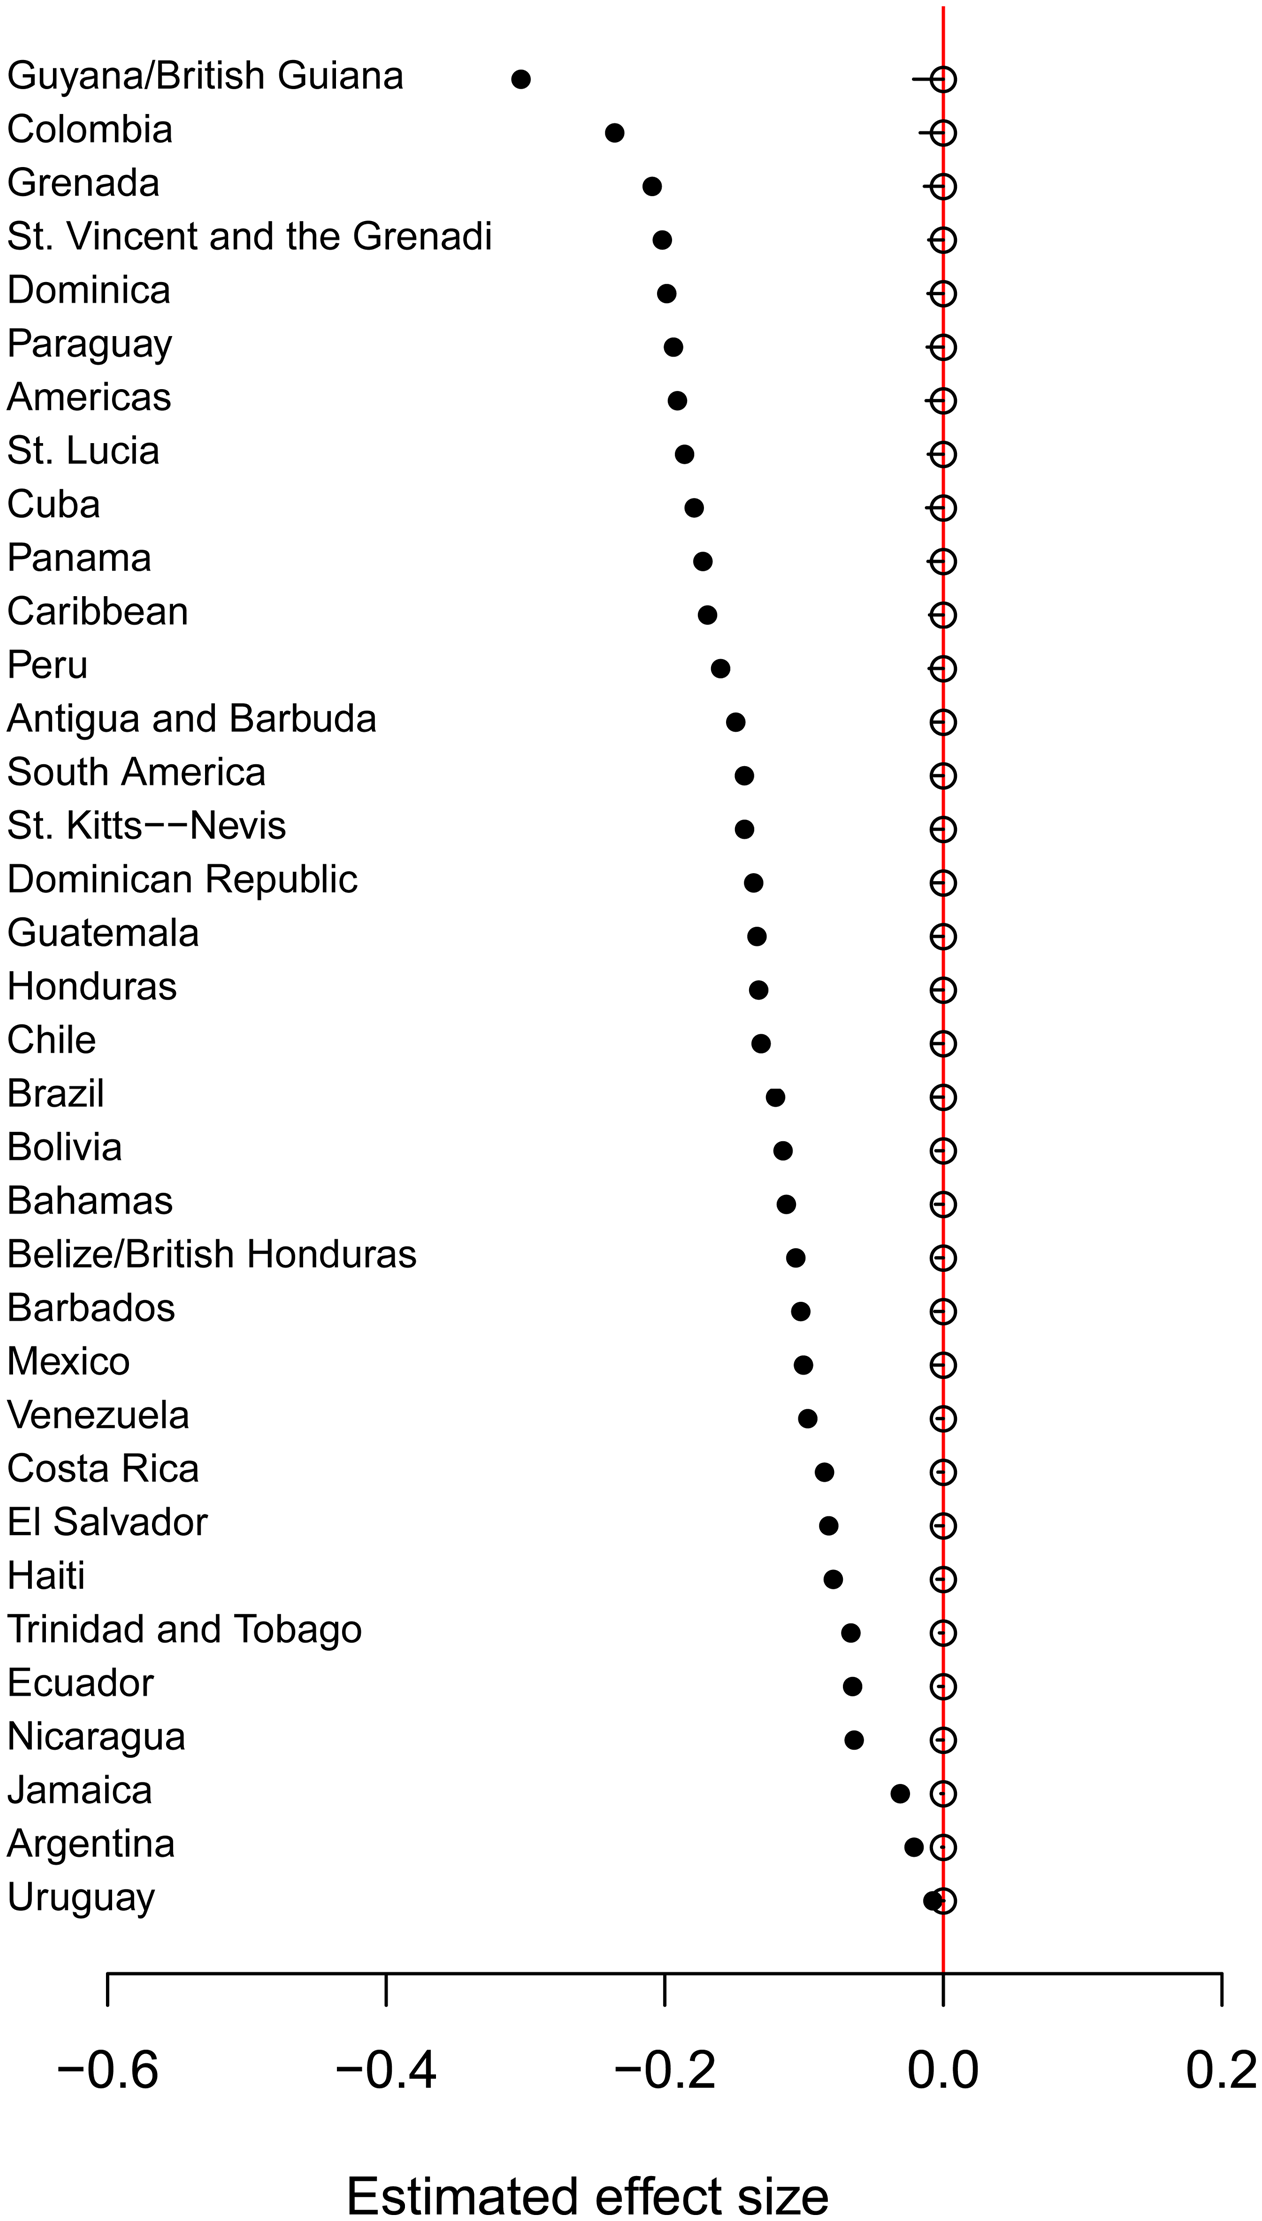
We begin by presenting Figure 4 that shows the distribution of these simulated effects. The dots show the estimated country of origin effects for immigrants who migrated at 25, the open circles effects for immigrants who migrated at 5. The lines across the circles indicate the 95% credible intervals. The countries are ordered based on the values represented by the dots. For example, migrating from Colombia at an older age means less political participation compared to the native-born population, as the effect size is further away from zero to the left. An effect size close to zero means that this particular country of origin and age at immigration dyad has a very small effect on political participation, as in the case of most who migrated at a young age, a finding consistent with our theory's prediction.
Effects of country of origin by age at immigration, Latin America/Caribbean

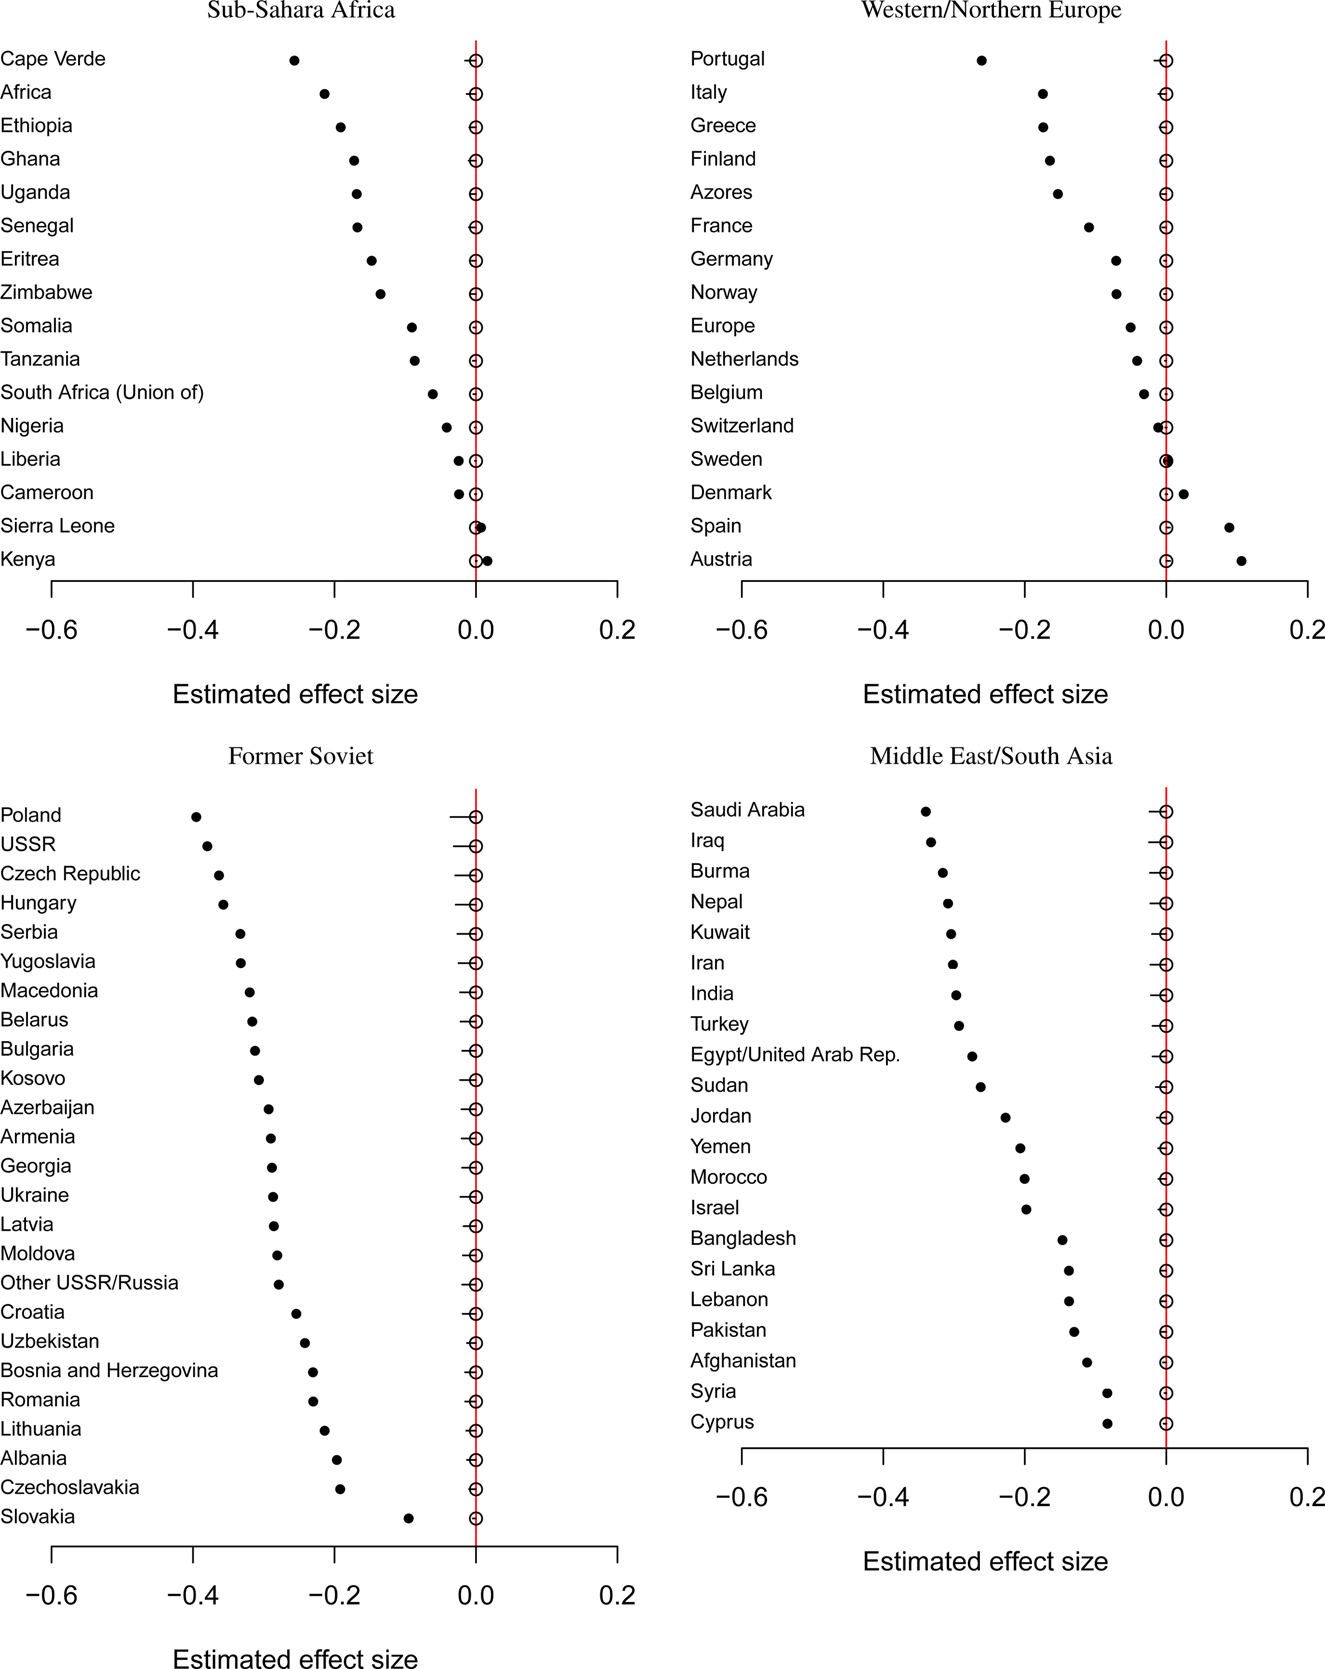
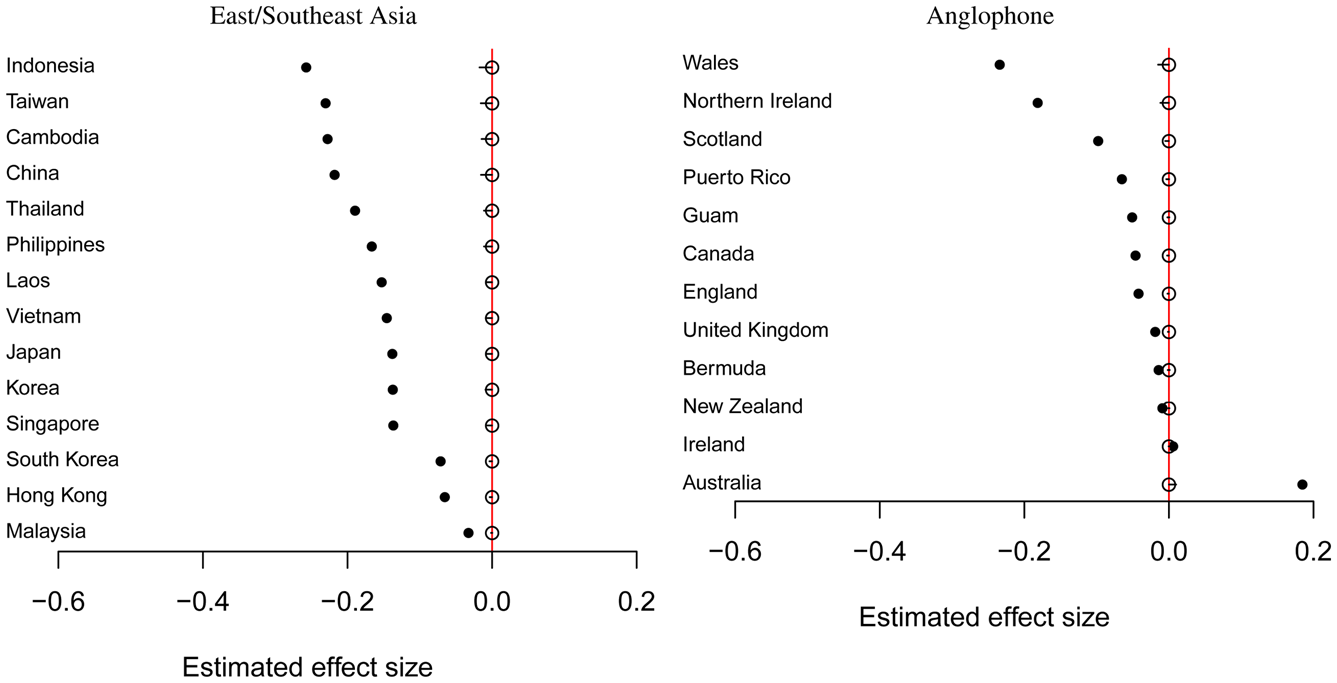
When we extend the results to the rest of the regions in our analysis, a few interesting patterns emerge (Figures 5 and 6). First, there are regional differences in terms of the country of origin effect. Not too surprisingly, those who migrated from Anglophone and western European countries such as Belgium, regardless of age at immigration, participate in politics at a rate comparable to the native-born citizens, indicated by their country effects cluster around zero. Other countries' immigrants participate in politics at a lower rate. This finding is consistent with our theoretical expectation that the country of origin effect among those who migrated at an older age captures formative years experiences from different political environments. As one might expect, an immigrant who grew up in Belgium are more likely to participate in politics compared to a similarly situated immigrant who grew up, for example, in Vietnam, even after controlling for personal characteristics such as SES and country-level variables such as regime type and economy.
Effects of country of origin by age at immigration, additional regions

Effects of country of origin by age at immigration, additional regions

This between-country difference is only noticeable, however, when we examine those who migrated at an older age. The second finding that stands out is the relative homogeneity in terms of the country of origin effect among those who moved to the United States at a young age, indicated by the open circles. The results show that almost all who migrated at a young age participate in politics at a rate indistinguishable from the native-born population, regardless of country of origin, as all the circles cluster on zero. In other words, if a Belgium and a Vietnamese immigrant both came to the United States at a young age, the Belgium immigrant participate in politics at a rate similar to that of the Vietnamese immigrant. These first two findings together lend support to the formative years theory. Formative years in essence is a time frame that corresponds to a particular life stage, and our results show that where an individual spends this time has a significant effect on their political behavior later in life, all else considered. Consequently, we stipulate that the lower level of participation among immigrants is largely driven by those who migrated at an older age, who constitute the majority of the immigrant population.
A number of previous studies reported null effects on age at immigration. For example, Wals (Reference Wals2013) finds that age at immigration was unrelated to the level of political participation for Mexican immigrants. We find that the difference between those who migrated older and those who migrated younger is indeed smaller for Mexican immigrants than that of many other Latin American countries' immigrants, as shown in Figure 4. In most cases, however, there is a significant difference between those who migrated at a younger age and those who migrated at an older age.
Last but not least, our results show that the formative years theory better accounts for immigrant behavior than the competing lifelong openness and parental socialization theories. If life-long learning and parental socialization are the main factors driving immigrants' political behavior, we would expect to see that those who migrated at a younger age, the “children” generation, indicated by the circles, are very close to those who migrated at an older age, the “parents” generation, indicated by the dots, which is not what the results show. In fact, most of the circles cluster on zero, which was the effect of the native-born citizens (constrained as part of model identification). In other words, the “children” immigrants are further from the “parents” immigrants and closer to the native-born population. This is not to say that lifelong openness theory is wrong or parental socialization does not matter, but that the formative theory better explains the patterns that we find in the results.Footnote 19
DISCUSSION
Taken together, our analyses provide insights explaining the puzzle of immigrants' low level of political participation even after controlling for SES. While SES alone cannot effectively account for immigrants' lower levels of participation, SES combined with age at immigration can better explain why immigrants appear to participate in politics less than the native-born population. We found that this low level of participation is largely driven by those who migrated to the United States at an older age, who tend to participate less in politics as a result of their different political socialization experiences during their formative years. In essence, we find that the immigrant status by itself is not necessarily a barrier to political participation. Like native-born citizens, immigrants' political behavior is shaped by their political environments. The fact that most immigrants were socialized in their countries of origin before they moved to the United States is an important reason why the immigrant population in general appears to participate in politics less compared to the native-born citizens.
An implication of our findings is the distinction between immigrant status and immigrant identity. If we define immigrant status as someone who was born outside the United States as a non citizen and is currently living in the United States (regardless of citizenship status), then age at immigration does not affect one's immigrant status. For example, a Latino who moved to the United States at the age of 5 would share the same status as a Latino who moved at the age of 25, both considered as immigrants, and are likely to experience similar societal treatments and government policies. Age at immigration, however, is likely to affect one's identity in terms of how one perceives oneself and what behavioral norms to internalize. In other words, the immigrant who moved to the United States at the age of 5 is likely to have vastly different formative experience compared to the one who moved at the age of 25, and therefore have different self-perception and behavioral habits.
This distinction between status and identity is important because status affects one's external interactions whereas identity affects both external interactions and internal perceptions. Two individuals may belong to the same status group but have different identities. Therefore, when we examine the effects of immigration enforcement, government policies, etc., it is necessary to take into consideration how individuals in the same status group may react differently. For example, we would argue that a government deportation effort would affect a Latina who moved to the United States at age 5 differently, most likely more negatively, compared to how it may affect a Latina who moved to the United States at the age of 25. Recent scholarly work has shown that government policies and police interactions have a profound political effect on minority communities (Massey and Sanchez Reference Massey and Sanchez2010; Mohamed Reference Mohamed2017). Based on our findings, we believe that these effects are likely to be conditional on one's formative experience.
An additional implication from our findings is that while our data cannot definitively identify any single age category as the “formative years,” we do find some suggestive evidence as for what age periods that seem to be more important. The formative years can start as early as 4 or 5 and end as late as the 20s. We contend that the age between 5 and 25 is the most important age period in terms of having a lasting effect on political participation later in life. Immigrants who moved to the United States before (or at) the age of 5 look exactly like their native-born peers and seem to have adapted to the American way of political participation very well. Those who migrated after 25 exhibits decreased participatory patterns later in their lives. Note that we are not suggesting a clear, absolute age cut-point for the formative years. For one thing, the construction of the age groups is a function of the data rather than the theory, for another, there is much variance around age 25; however, we do observe a significant difference before 5 and after 25, which is consistent with findings from previous literature.
Last but not least, our findings have a direct implication for the understanding of the recent immigration debate. The young immigrants' voice that we heard in the debate is a reflection of the fact that these young people, many of whom “dreamers,” are just as politically active as the native-born citizens. These “dreamers” are doing well in terms of getting an education and contributing to society; they also seem to do well politically by advocating for their rights as actively as native-born Americans.
ACKNOWLEDGMENTS
The authors would like to thank Leticia Bode, Barry Burden, and participants at the Political Behavior Research Group at the University of Wisconsin–Madison and the anonymous reviewers at the Journal of Race, Ethnicity, and Politics for comments and suggestions.
SUPPLEMENTARY MATERIALS
The supplementary material for this article, please visit https://doi.org/10.1017/rep.2019.22
Appendix
Hierarchical model results