


INTRODUCTION
The transition from seed to established seedling is the stage in the life cycle of tree species when mortality is highest (Comita et al. Reference COMITA, AGUILAR, PÉREZ, LAO and HUBBELL2007, Dalling et al. Reference DALLING, HUBBELL and SILVERA1998a, Herrera et al. Reference HERRERA, JORDANO, LÓPEZ-SORIA and AMAT1994). After primary dispersal from adult trees, seeds land on the forest floor and are susceptible to attack from natural enemies such as seed predators and soil fungi (Dalling Reference DALLING, Forget, Lambert, Hulme and Vander2005, Vander Wall & Longland Reference VANDER WALL, LONGLAND, Forget, Lambert, Hulme and Vander Wall2005), and to movement due to physical agents such as rainfall (Lal Reference LAL1987, Leigh Reference LEIGH and Leigh1999, Loch Reference LOCH1994). Shorter-range secondary dispersal and burial may minimize the impacts of these attacks and, thereby, enhance the likelihood that seeds arrive in a safe site for germination and establishment (Howe & Smallwood Reference HOWE and SMALLWOOD1982, Nathan & Muller-Landau Reference NATHAN and MULLER-LANDAU2000). Pioneer tree species, which colonize canopy gaps, often have small seeds that are particularly susceptible to natural enemies and physical processes (Dalling & Hubbell Reference DALLING and HUBBELL2002). Understanding the secondary dispersal of pioneers is essential to improve understanding of gap dynamics and tropical forest regeneration.
Secondary dispersal of large seeds (generally >1 g) has been studied extensively using seed-labelling and tagging methods (reviewed in Forget & Wenny Reference FORGET, WENNY, Forget, Lambert, Hulme and Vander Wall2005). However, these approaches are impractical for investigating pioneer seeds, which are mostly much smaller (50% of pioneer tree species on Barro Colorado Island, Panama, have seeds < 10 mg, T. Marthews unpubl. data). In contrast to large seeds, the dominant predators and dispersers of small seeds are not vertebrates (Howe Reference HOWE1989, Schupp et al. Reference SCHUPP, MILLERON, RUSSO, Levey, Silva and Galetti2002), but smaller organisms such as ants and beetles (Dalling Reference DALLING, Forget, Lambert, Hulme and Vander2005, Lal Reference LAL1987). Small seeds are also affected by the same processes that cause soil erosion because they are of similar mass and size to erodible soil particles (Marshall et al. Reference MARSHALL, HOLMES and ROSE1996, Morgan Reference MORGAN1986). These processes can cause not only lateral displacement but also burial within the soil, both of which impose potential survival benefits and costs. For example, seeds may be displaced to a more favourable site away from other dispersed seeds (Schupp et al. Reference SCHUPP, MILLERON, RUSSO, Levey, Silva and Galetti2002) or buried beyond the reach of soil surface fungi (Gallery et al. Reference GALLERY, DALLING and ARNOLD2007). Alternatively, seeds may be buried too deeply to receive dormancy-breaking signals (Pearson et al. Reference PEARSON, BURSLEM, MULLINS and DALLING2003) or to be able to germinate and emerge (Dalling et al. Reference DALLING, SWAINE and GARWOOD1994, Pearson et al. Reference PEARSON, BURSLEM, MULLINS and DALLING2002). Both biological and physical processes of secondary dispersal are affected by site-specific variables such as soil type and litter density (Dalling & Hubbell Reference DALLING and HUBBELL2002, Harms & Dalling Reference HARMS and DALLING1997) and variation in incident rainfall (e.g. in gaps), so differential responses to these processes may be one of the mechanisms through which pioneer species partition gaps ecologically (Brokaw & Busing Reference BROKAW and BUSING2000, Dalling et al. Reference DALLING, HUBBELL and SILVERA1998a).
The speed at which different secondary dispersal processes operate and whether they cause displacement, burial or both determines their relative importance in particular forests. Biological processes are known to affect seeds on the scale of days (e.g. ants, Alvarez-Buylla & Martínez-Ramos Reference ALVAREZ-BUYLLA and MARTÍNEZ-RAMOS1990, Dalling et al. Reference DALLING, SWAINE and GARWOOD1998b, Fornara & Dalling Reference FORNARA and DALLING2005) and longer (e.g. bioturbation – soil movement as a result of biological processes such as root growth and the activity of soil fauna – Dalling Reference DALLING, Forget, Lambert, Hulme and Vander2005, Darwin Reference DARWIN1881). Physical processes affect soil on both long (e.g. soil erosion, Morgan Reference MORGAN1986) and short time-scales (e.g. during heavy rainfall, Loch Reference LOCH1994), but their effects on seeds under field conditions are less well known. The presence of faecal matter may modify both biological and physical processes during secondary dispersal, but to what extent is likewise little known.
In this study, seeds of three pioneer tree species and five types of artificial seed substitute were sown in understorey sites and small and large gaps in a tropical forest in Panama. A census was then made of seeds buried in situ and displaced from each sample area over the subsequent month. The following questions were addressed: (1) What percentages of seeds were displaced (horizontally) and buried (vertically)? (2) How important were physical processes during seed displacement and burial? and (3) How important were biological processes?
METHODS
Study area
Barro Colorado Island (BCI, 9°09′N 79°51′W) is a 15.6-km2 island in the Canal Zone of Panama. BCI supports a Tropical Moist Forest (Holdridge et al. Reference HOLDRIDGE, GRENKE, HATHEWAY, LIANG and TOSI1971), approximately half of which has been undisturbed since at least c. 1600 (Foster & Brokaw Reference FOSTER, BROKAW, Leigh, Rand and Windsor1982). Annual rainfall is 2644 ± 443 mm (mean ± 1 SD, 1925–2005 data, http://striweb.si.edu/esp/physical_monitoring/download_bci.htm). There are two seasons, a dry season (21 December–4 May, mean dates 1954–2005), when rainfall averages 2.1 mm d−1, and a wet season, with rainfall 10.1 mm d−1 (1925–2005 data).
Site and species selection
In July 2005, in the wet season, six study sites were chosen in undisturbed forest on the central plateau of BCI. Two understorey sites, two small natural gaps formed by single treefalls (gap sizes 10 and 35 m2, Brokaw Reference BROKAW1982) and two larger gaps (210 and 565 m2) were selected because of their relatively flat local relief, freely draining soil and absence of gullies and streams. All sites were > 10 m from trails (within 350 m of the junction of Zetek and Conrad) and shared the same soil (Ava red light clay, http://biogeodb.stri.si.edu/bioinformatics/bci_soil_map) and parent material (andesite, Johnsson & Stallard Reference JOHNSSON and STALLARD1989).
Three pioneer species, Cecropia insignis, Trema micrantha and Apeiba aspera (Table 1), and five types of artificial seed were selected to investigate a wide range of seed sizes (0.18–5.00 mm) and masses (0.3–14.8 mg). Cecropia insignis produces infructescences containing many single-seeded achenes (here called seeds) in catkin-like perianths (Croat Reference CROAT1978, Lobova et al. Reference LOBOVA, MORI, BLANCHARD, PECKHAM and CHARLES-DOMINIQUE2003) dispersed, on BCI, by bats, birds and primates (Dalling et al. Reference DALLING, SWAINE and GARWOOD1998b, Gallery et al. Reference GALLERY, DALLING and ARNOLD2007). Trema micrantha produces fleshy single-seeded fruits dispersed by birds (Croat Reference CROAT1978). Apeiba aspera produces hard, spine-covered, many-seeded fruits that are opened by monkeys in the canopy or by rodents on the ground (Croat Reference CROAT1978).
Natural and artificial seeds. Size ranges were estimated, except for the polystyrene beads and the magnetite which were graded. Densities were calculated from the volume (measured using water displacement in a pipette tube, or calculated in the case of the spherical polystyrene beads). Trema micrantha seeds were of the large-seeded morphotype which has seeds with a black, sculpted endocarp (Silvera et al. Reference SILVERA, SKILLMAN and DALLING2003, Yesson et al. Reference YESSON, RUSSELL, PARRISH, DALLING and GARWOOD2004). Cecropia insignis seeds were elongated ellipsoids, hence their smaller mass compared to the spherical Trema micrantha seeds. Beads were entire except the haberdashery beads, which were cylindrical with a coaxial threading hole 0.5 mm in diameter. Nomenclature follows Croat (Reference CROAT1978).
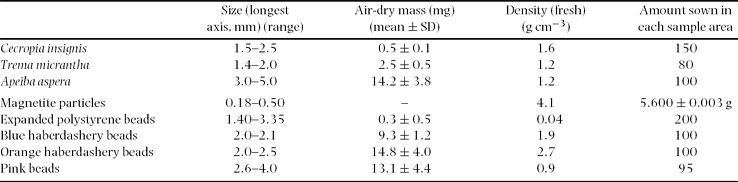
Sufficient fresh Cecropia insignis seeds could not be obtained in 2005 so air-dry seeds collected on BCI in 2003 and stored in an air-conditioned laboratory were used. Trema micrantha seeds were wet- and dry-sieved out of 19 kg soil (< 30 mm deep; seed age unknown) collected under two separate trees on BCI in June 2005 (1.4-mm sieve; soil pressed gently through to avoid scarification). Apeiba aspera seeds were collected from fallen fruit under five separate trees on BCI in June 2005. All seeds were cleaned within 24 h of collection and air-dried in a dark room. Artificial seeds (Table 1) consisted of: magnetite particles crushed and graded to 180 –500 μm in size, expanded polystyrene beads (Sundolitt Ltd., Montrose, UK) graded to 1.40–3.35 mm, blue haberdashery beads (The Bead Shop, Haddington, UK), orange haberdashery beads (562.10417 Gütermann Rocailles 9/o, John Lewis Ltd., Aberdeen, UK) and pink beads (Magic Scraps Bitty Beads, Dorrie Doodle Ltd., Aberdeen, UK). Colour was assumed not to affect dynamics on the forest floor.
Seeds were rejected as unviable if they floated on water or were obviously damaged or discoloured. Amount sown (Table 1) corresponded to the estimated number of viable seeds in an average fruit (Apeiba aspera) or according to availability. Seed lots were well-mixed and not handled after washing to avoid transferring human scent. Seeds used in each experimental replicate were mixed together and stored in a dark room until sown.
Experimental design
Four treatments (with and without litter, excavated after 15 or 24–26 d) were replicated three times in each of the six sites. On 8 July 2005 (a rainless day), seed lots were sown in 12 circular sample areas in each study site (10 cm diameter; > 20 cm apart). Sample areas avoided tree stems, fallen branches and above-ground roots and, in gaps, were placed in the open zone (sensu Uhl et al. Reference UHL, CLARK, DEZZEO and MAQUIRINO1988) close to the centre of the canopy opening. Surface litter, including coarse and foliar debris, was carefully removed and weighed from six randomly selected sample areas per site before sowing (snapping twigs and cutting leaves that crossed the sample edge). Additional litter within 10 cm of the sample area was cleared but not retained. Seeds were sown by scattering them within a 5-cm-diameter circle at the centre of each sample area. No adult Trema micrantha was close to any of the study sites, and the two other species were not in fruit (Foster Reference FOSTER, Leigh, Rand and Windsor1982), so background seed rain was negligible.
During the night of 17–18 July (after a day of 0.25 mm rain), volumetric soil water content was measured (mean over 0–120-mm depth) using a Time Domain Reflectometer (Field Scout TDR 100 #6440FS with 12-cm rods, Spectrum Technologies Inc., IL, USA) at three points within 12 cm of the edge of every litter-removal replicate. Mean values for each replicate were converted to water contents using a calibration based on 52 samples taken at eight sites with the same soil type. Readings were taken between 23h00 and 03h00 to minimize temporal variation in soil water content.
Excavation
Half the sample areas were randomly chosen within each combination of site and litter treatment and excavated after 15 d (23 July), the rest after 24–26 d (1–3 August – heavy rain prevented excavation on one day). Emergents of the study species within each sample area were recorded and discarded (emergents of other species were considered litter), so the only seedlings that were missed were those few that may have germinated after sowing but did not emerge, or emerged and died before excavation. Excavation involved coring the soil of the sample area with a 10-cm-diameter sharpened steel ring (2-mm wall thickness) and removing slices at depths of 0–5, 5–10, 10–20 and 20–50 mm in pre-labelled bags. Any litter that had accumulated in the sample area since sowing was removed and weighed as before.
The ring was pressed vertically into the soil using an 80-cm handle and soil from the first three depths removed using a craft knife and scoop, taking care to prevent seeds or loose soil falling deeper into the core. Some sample areas had a microrelief up to ±10 mm so depth slices were separated by following these undulations, if > 20 mm wide, rather than horizontally. For 15 (21%) of the 20–50-mm slices the ring could not be pressed to 50-mm depth and was hammered into the soil (shallower slices excavated without hammering) and it was assumed that soil density at 50-mm depth was sufficient to stop seeds falling below that level. The 20–50-mm-depth was extracted by sliding a palette knife horizontally underneath the steel ring, lifting out the ring and removing the contents.
On 3 August two background soil cores were taken from each site (avoiding previous excavation locations) and divided in the same way as the other excavations. Although large stones within 50 mm of the surface or roots > 10 mm thick prevented excavation in some sample areas, 329 of 336 depth slices (98%) were retrieved successfully. All sample bags were stored in a dark room to minimize germination of seeds.
Recovery
Any natural or artificial seeds found in the litter samples were carefully brushed off and added to the 0–5-mm-depth slice from the same sample area. Because surface microtopography limited the accuracy to which the surface could be defined, items within the 0–5-mm slice were not considered as buried items. The dry mass of all litter samples was measured and all soil samples were wet-sieved to remove particles < 180 μm (clay, silt and most fine sand) and roots and stones larger than 3.35 mm. Samples were then air-dried and transported to the University of Aberdeen, UK.
Each soil sample was dry-sieved for 2 min into fractions > 500 μm and 180–500 μm, which were processed in turn in the same way. A cylindrical magnet (35-mm-diameter Eclipse Alcomax III Pot #834, Newman Tools Inc., Montréal, Canada) was suspended 8 mm above a sheet of glazed paper (BenchGuard, Bibby Sterilin Ltd., Stone, UK), the maximum distance at which 100% of magnetite particles were consistently picked up. Fractions were spread in a layer < 2 mm thick on the glazed paper to allow removal of visible beads and seeds, and then passed slowly twice underneath the magnet with its face covered by a layer of thin plastic film (Cling Film, Wrap Film Systems Ltd., Telford, UK) to allow removal of any magnetic particles for weighing. Background soil cores were processed similarly and the mean of their contents in each site subtracted from the results from all sample areas.
Analysis
From the exposure time between sowing and excavation (accurate to the nearest 15 min), total rainfall received was calculated using rainfall records (http://striweb.si.edu/esp/physical_monitoring/download_bci.htm, accurate to the nearest 5 min) from which the above-canopy rainfall rate could be calculated. Gap sizes were measured in the field using the method of Brokaw (Reference BROKAW1982). Litter present just after sowing was either zero in the litter-removal sample areas or estimated as the mean of litter taken from the litter-removal sample areas at the same site. Net (input minus decay) litter accumulation rate was calculated from the mass of litter removed at excavation. Volumetric soil water content (θ) was either the value measured in the litter-removal areas, or estimated as the mean of the values from the litter-removal areas at the same site.
None of time, gap size, starting litter, litter accumulation and θ was pairwise correlated during the experiment (10 correlation analyses, r 2 < 0.19; rainfall rate variable excluded since rainfall was greater in the second half of the experiment, producing a correlation with exposure time, r 2 = 0.67), so they could be used as fixed predictors in a generalized linear model (GLM) analysis with no interaction terms. The five response variables chosen were B (% seeds buried below 5 mm), D (% seeds displaced outside the sample area), B ad (number buried as % of undisplaced seeds; subscript = ‘after displacement’), D ab (number displaced as % of unburied seeds) and (mean depth of buried seeds), where displaced meant all seeds not accounted for in the recovery (excluding emergents) and burial was assumed not to have occurred below 50 mm. Errors were normally distributed for burial depth and quasi-binomial for all other response variables (all fits with binomial errors were overdispersed) and the corresponding link functions applied (Crawley Reference CRAWLEY2002, Reference CRAWLEY2005). Each maximal GLM with five predictors was reduced to a minimum adequate GLM using the step procedure of R, which chooses between fits by minimizing the Akaike Information Criterion (Crawley Reference CRAWLEY2005). Since it is currently not possible to use step with quasi-binomial errors, binomial errors were used and the minimum adequate GLM reanalysed with quasi-binomial errors to give the reported results.
RESULTS
During the experiment, 5.6 ± 1.7 mm d−1 (mean ± SE, n = 27 d) of rain was received on BCI (mean for July = 8.9 mm d−1, 1929–2004 data). However, rainfall was sporadic with 97% of all 5-min intervals rainless. Volumetric soil water content was 0.315 ± 0.006 cm3 cm−3 at night (mean ± SE, n = 36 litter-removal areas) and differed significantly between sites (one-way ANOVA, n = 36, P < 0.01), however just one wetter site (U2, 0.363 ± 0.004 cm3 cm−3) accounted for this difference (Tukey test, n = 6, df = 30, P < 0.05). Dry mass of litter present at sowing was 618 ± 55 g m−2 (mean ± SE, n = 36) and differed significantly between sites (one-way ANOVA, n = 36, P < 0.05), however just one site with more litter (S2, 1015 ± 427 g m−2) accounted for this difference (Tukey test, n = 6, df = 30, P < 0.05). Litter accumulation rate was 11.0 ± 1.3 g m−2 d−1 (mean ± SE, n = 36) and differed significantly across sites (one-way ANOVA, n = 36, P < 0.05), with slightly increased litter input in one site (U1, 18.6 ± 7.4 g m−2 d−1) and reduced input in another (L1, 6.2 ± 5.2 g m−2 d−1) accounting for this difference (Tukey test, n = 6, df = 30, P < 0.05).
Displacement and burial
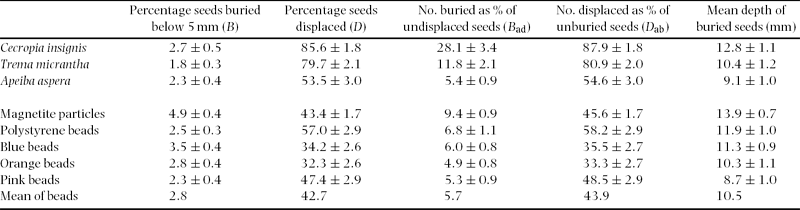
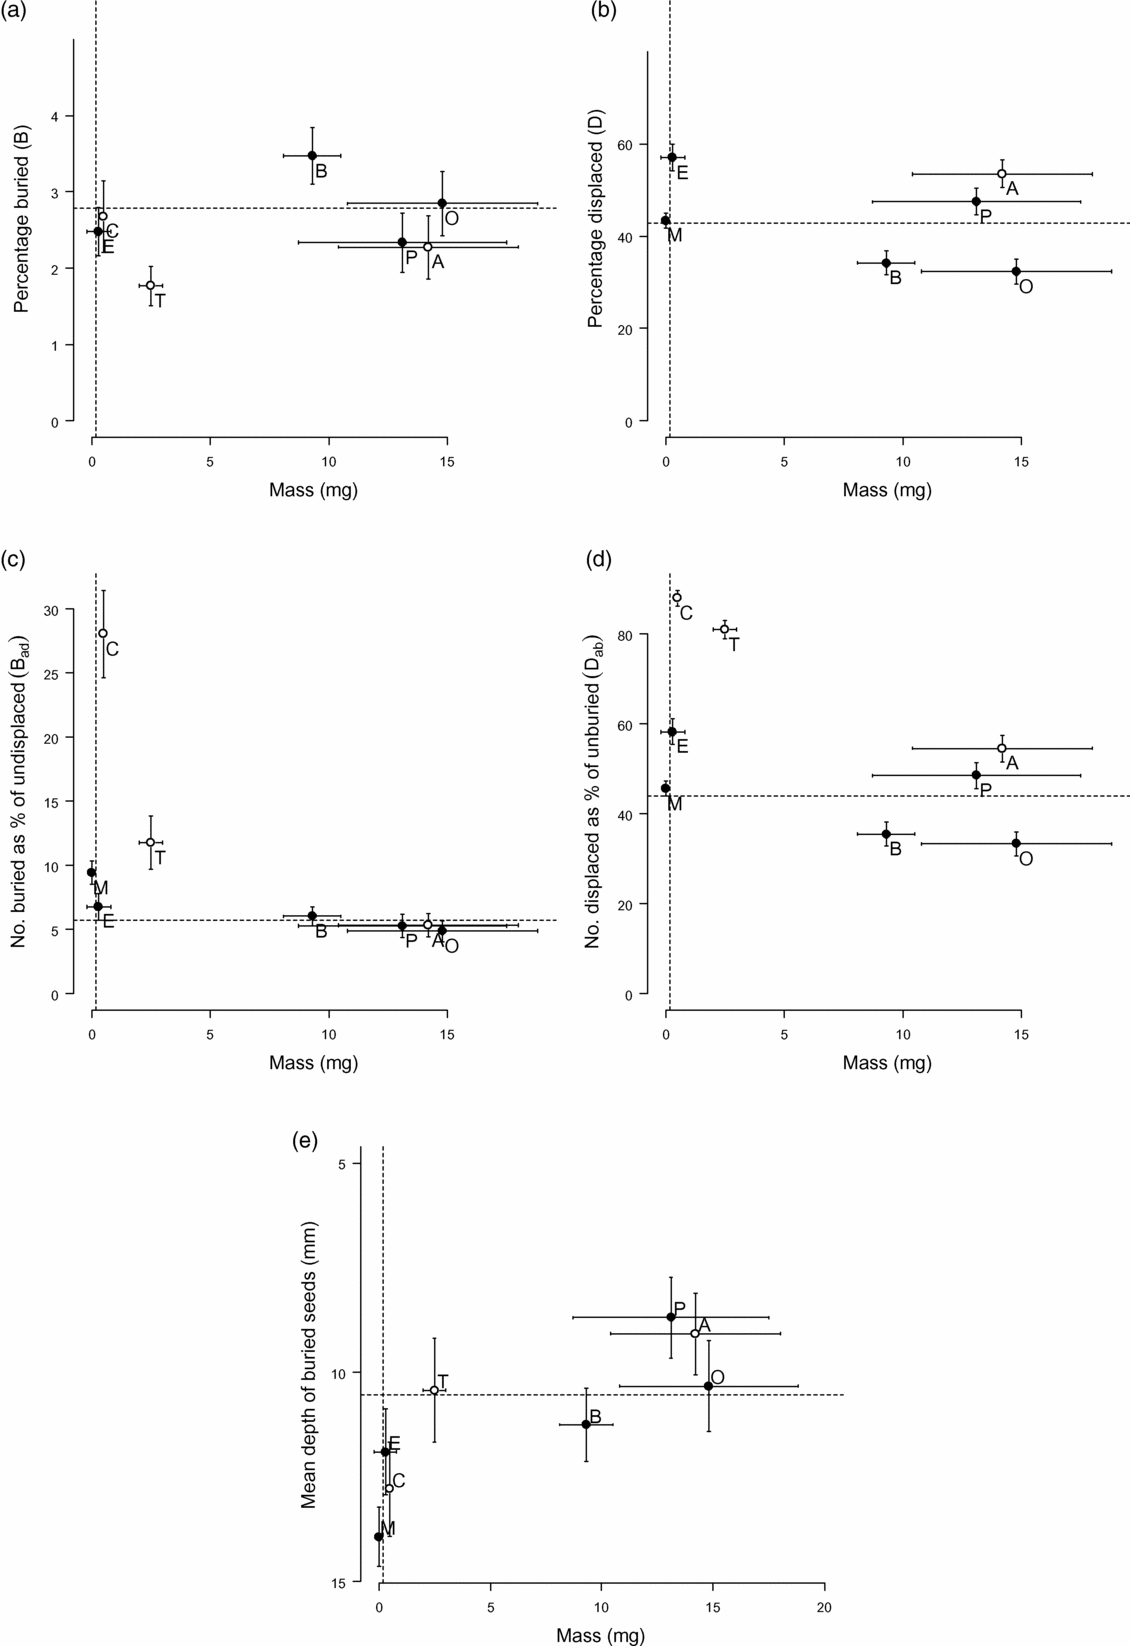
The displacement and burial percentages of natural and artificial seeds over all excavation dates and litter treatments showed a clear divide between the behaviour of Cecropia insignis and Trema micrantha seeds and all other seeds (Table 2, Figure 1), which was clearest when plotted with seed mass, rather than size or density, as the independent variable. Although magnetite particles were most likely to be buried in terms of direct percentage (B), when the number of seeds displaced during the experiment was subtracted from the total sown (B ad) then Cecropia insignis seeds were significantly more likely to be buried than any other seed (two one-way ANOVAs, eight samples of 72 each, P < 0.001 and Tukey test, n = 8, df = 568, P < 0.05). Similarly in terms of percentage displaced (D) or number displaced as a percentage of unburied seeds (D ab), significantly more seeds of Cecropia insignis and Trema micrantha were displaced than all other seeds (two one-way ANOVAs, eight samples of 72 each, P < 0.001 and Tukey test, n = 8, df = 568, P < 0.05). Apart from magnetite, which was buried slightly more deeply, there was no significant difference in burial depth between seed types (one-way ANOVA, eight samples of 72 each, P < 0.001 and Tukey test, n = 8, df = 568, P < 0.05) and the mean depth at which buried beads were found was 10.5 mm (Table 2, Figure 1).
Fates of sown seeds over all treatments, expressed in terms of displacement and burial (mean ± SE, n = 72 sample areas). Undisplaced and unburied seeds were recovered from the soil surface at < 5 mm depth. Background densities of seeds from cores taken in all sites have been subtracted.
Burial (a, c, e) and displacement (b, d) in relation to seed mass (C = Cecropia insignis, T = Trema micrantha, A = Apeiba aspera, M = magnetite particles, E = polystyrene beads, B = blue beads, O = orange beads, P = pink beads). Horizontal bars show the mean ± SD masses of seeds (Table 1) and vertical bars mean ± SE (Table 2). The vertical line denotes for reference the estimated mass of a 0.5-mm-diameter spherical soil particle (0.2 mg) and the horizontal line the mean of beads (Table 2). Note the inverted scale in (e).
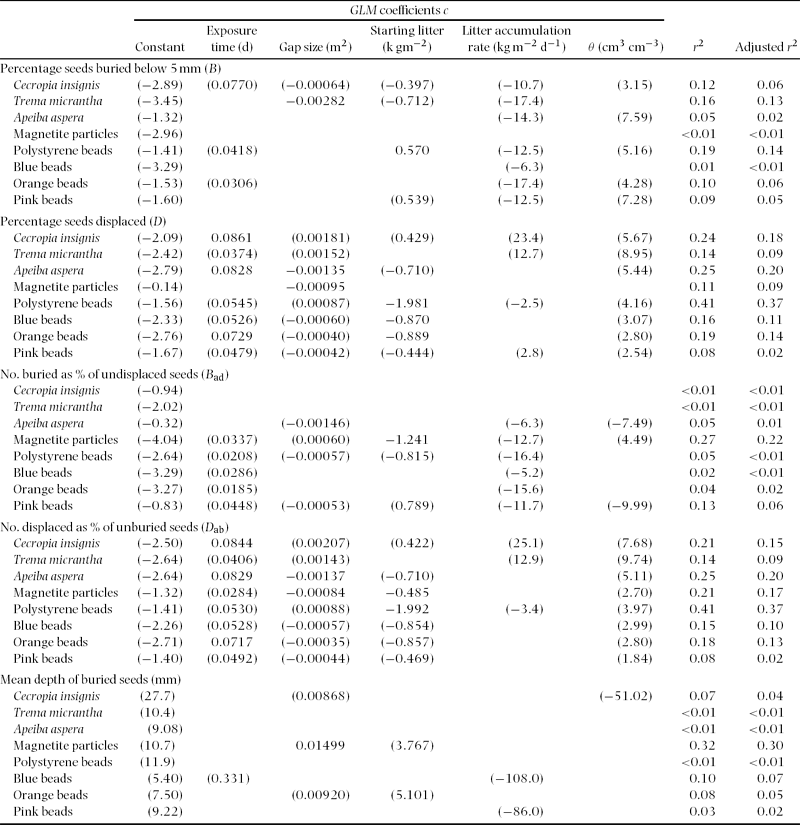
Burial (B, B ad) of Trema micrantha seeds was slightly lower in larger gaps and burial of magnetite and polystyrene beads was slightly affected by litter, but for most seeds (natural or artificial) litter and gap size had no effect on burial, and site soil water content did not affect burial for any seed type (scaled deviances ≥ 5% only, Appendix 1). Displacement (D, D ab) of magnetite and polystyrene, blue and orange beads was affected negatively by starting litter, and decreased with gap size for Apeiba aspera seeds and magnetite, but was unaffected by litter accumulation rate or site soil water content (Appendix 1). Burial was not dependent on exposure time for any seed, unlike displacement for Cecropia insignis, Apeiba aspera and orange beads (Appendix 1).
Generalized linear models. Predictors were Exposure time (between sowing and excavation), Gap size, Starting litter (present just after sowing), Litter accumulation rate (net) and θ (volumetric soil water content). Each row is a model fit, with link functions: (estimate) = η mm for (burial depth) and (estimate) = 100 × exp(η)/(1 + exp(η)) % for all other response variables, where η = (c 0 + c 1×time + . . . + c 5×θ). Values in parentheses were significant, but explained < 5% of the variation (scaled deviance) in the response variable.
No seedlings emerged in the understorey, and emergence percentages in the gaps were 0.3%, 3.0% and 1.5% of all seeds for Cecropia insignis, Trema micrantha and Apeiba aspera, respectively (209 emergents in total). Although some beads were displaced by ground fauna (e.g. Ectatomma ruidum ants removed some pink beads and probed and rejected them elsewhere), this would have affected a negligible proportion of the artificial seeds. Background seed density was low (0.044, 0.004 and 0.002 seeds cm−2 in the top 50 mm of soil for Cecropia insignis, Trema micrantha and Apeiba aspera, mean of n = 12 cores). Although surrounding litter was not exhaustively searched during excavation, most displaced seeds remained within 15 cm of the circumference of the ring and further displacement was exceptional: one pink bead was observed 33 cm from the sample area boundary, one polystyrene bead was found 63 cm away and one orange bead reached 84 cm. Emergents were displaced less far (one Apeiba aspera seed 10 cm away was the maximum observed). All seeds or beads > 15 cm from the circumference were encountered in isolation, except one sample area where > 100 polystyrene beads were found 38 cm away down a slight incline.
DISCUSSION
Excluding the results for magnetite, an average of 2.8% of small artificial seeds present in a small area on the forest floor of BCI were buried to a mean depth of 10.5 mm below the soil surface, and 43.9% of unburied seeds were displaced laterally > 5 cm. These values provide an estimate of the impacts of unassisted physical processes on burial and displacement of small seeds during the wet season. Since seeds displaced during this experiment may have been subsequently buried, and sites vulnerable to overland flow and soil erosion were avoided, these results represent minimum estimates of burial and displacement on BCI.
Cecropia insignis and Trema micrantha seeds were displaced significantly more (80.9% and 87.9%, respectively) than artificial seeds of similar size, mass and density. The dynamics of secondary dispersal may change if faecal matter is present, however for clean seeds we propose two (non-exclusive) possibilities: either these seeds have morphologies that exploit physical effects (physical mechanisms), or properties that attract or use ground fauna in some way (biological mechanisms).
Physical mechanisms
The main physical cause of displacement and burial is rainfall. Raindrops impact the surface at up to 9.5 m s−1 (Marshall et al. Reference MARSHALL, HOLMES and ROSE1996) and exert an impact stress of up to 6 MPa (Ghadiri & Payne Reference GHADIRI and PAYNE1981), whether falling as direct rainfall or as throughfall from trees (Lal Reference LAL1987, Leigh Reference LEIGH and Leigh1999). On bare soil, this impact is sufficient to detach and move soil particles up to at least 0.5 mm in diameter (Morgan Reference MORGAN1986) either laterally (splash, Cornelis et al. Reference CORNELIS, OLTENFREITER, GABRIELS and HARTMANN2004, Poesen Reference POESEN1985) or into soil pores (jetting, Loch Reference LOCH1994), even in the absence of overland flow (e.g. small litter fragments can be splashed by rain up to 35 cm high on screens set out in the forest on BCI, T. Marthews pers. obs.). A 0.5-mm-diameter spherical soil particle has a mass of 0.2 mg (assuming a density of ρ s = 2.65 g cm−3, Marshall et al. Reference MARSHALL, HOLMES and ROSE1996). Hence we expect that seeds up to at least this mass, and probably slightly more, can be similarly splashed by raindrop impacts, especially since they are less firmly attached than the particles on the outside of a soil aggregate. Larger soil particles up to at least 3 mm in diameter are rolled to the circumference of raindrop impact areas (C. Mullins pers. obs.). Hence, Apeiba aspera seeds, which are of a similar mass, would be pushed to the side of impact areas, and may also be moved where there is localized overland flow.
If a large enough pore is available, seeds may be jetted into the soil (Loch Reference LOCH1994). The number of raindrops impacting on each point of the soil surface during a rainfall event can be calculated from the volume of incident water divided by the mean volume per drop (assumed spherical). For example, during the most intense rainfall observed during this experiment, 2.08 mm min−1 over 5 min, a mean of 7.4 raindrops would have impacted on each point of the surface, assuming a mean drop diameter of 2.1 mm (Hudson Reference HUDSON1971, cf. Leigh Reference LEIGH and Leigh1999). Even in the understorey where 85% or less of above-canopy rainfall reaches the ground as throughfall (Bruijnzeel Reference BRUIJNZEEL and Proctor1989, Leigh Reference LEIGH and Leigh1999), up to 6.3 raindrops would have impacted every point. Therefore, on a bare soil surface, rainfall may redistribute unaggregated soil particles and seeds up to the mass of Trema micrantha seeds in 5 min, and seed percolation may not be as slow a process as is generally believed (Dalling et al. Reference DALLING, SWAINE and GARWOOD1998b).
The capacity for rainfall to jet seeds into the soil may be estimated from soil properties and raindrop size. The mean total porosity of the soil at the study site was θsat = 0.69 cm3 cm−3 (dry bulk density ρ b = 0.83 g cm−3 at < 70-mm depth, Sayer et al. Reference SAYER, TANNER and CHEESEMAN2006, and θsat = 1-(ρ b/ρ s), Marshall et al. Reference MARSHALL, HOLMES and ROSE1996). For surface soil with measured volumetric water content of 0.32 cm3 cm−3, the air-filled porosity n am (i.e. the pores that are empty of water) was therefore (θsat – 0.32) = 0.37 cm3 cm−3 before rainfall. After primary dispersal and movement by raindrops, a proportion of small seeds will be lying above air-filled soil pores (Daws et al. Reference DAWS, BALLARD, MULLINS, GARWOOD, MURRAY, PEARSON and BURSLEM2007). The mean depth to which a subsequent raindrop will then jet seeds into the pores may be estimated from the volume of the raindrop divided by the cross-sectional area of the soil pore space (n am × drop cross-sectional area), which is 3.8 mm. Subsequent drops may increase this depth by an amount dependent on the shape and connectedness of soil pores. Seeds are also likely to be positioned initially in surface depressions, therefore a burial depth of 10.5 mm is attributable to rainfall.
Therefore, raindrop impacts are likely to affect the displacement and burial of Cecropia insignis seeds (0.5 mg, Table 1) and probably also Trema micrantha seeds (2.5 mg), but not heavier seeds such as Apeiba aspera (14.2 mg). Consequently the difference between Apeiba aspera and the other two study species occurs because its seeds are too heavy to be moved significantly by raindrops, and probably also because they are too large to fit down most soil pores (Daws et al. Reference DAWS, BALLARD, MULLINS, GARWOOD, MURRAY, PEARSON and BURSLEM2007). Additionally, in contrast to the smooth surface and ellipsoidal shape of Cecropia insignis seeds (Lobova et al. Reference LOBOVA, MORI, BLANCHARD, PECKHAM and CHARLES-DOMINIQUE2003), which would aid movement and penetration into soil pores, Apeiba aspera seeds have surfaces with flat faces that adhere easily to each other when wetted (T. Marthews pers. obs.), so seeds generally occur in clumps rather than singly, further preventing detachment and burial. Fruits of Apeiba aspera also contain an oily mesocarp (Croat Reference CROAT1978) which may aid adhesion. Seeds may also be buried as a consequence of shrink-swell effects, solifluction, rilling and root growth through the soil (Marshall et al. Reference MARSHALL, HOLMES and ROSE1996), but such processes are too slow to have been measurable over the 26 d of this experiment.
Biological mechanisms
Ants are responsible for the majority of biological displacements and burials of small-seeded pioneer tree species (Dalling Reference DALLING, Forget, Lambert, Hulme and Vander2005, Levings & Franks Reference LEVINGS and FRANKS1982, Vander Wall & Longland Reference VANDER WALL, LONGLAND, Forget, Lambert, Hulme and Vander Wall2005), while earthworms (bioturbation, Dalling Reference DALLING, Forget, Lambert, Hulme and Vander2005, Darwin Reference DARWIN1881) and dung beetles (Andresen & Feer Reference ANDRESEN, FEER, Forget, Lambert, Hulme and Vander Wall2005, Vander Wall & Longland Reference VANDER WALL, LONGLAND, Forget, Lambert, Hulme and Vander Wall2005) also play minor roles. Seed burial due to bioturbation occurred at a rate of 3.7 mm y−1 in semi-deciduous forest in Nigeria (Lal Reference LAL1987), but would not have been measurable over the 26 d of this experiment. Also, seeds were not sown in faeces so dung beetle activity would have been minimal. Therefore, we are concerned with rapid seed dispersal by ants.
Over only 3 d in October–November 2000, 56%, 80% and 96% of Cecropia peltata, Trema micrantha (small-seeded morphotype, q.v. Table 1) and Apeiba aspera seeds, respectively, were removed from upturned Petri dishes placed under plastic tents (that excluded rainfall) compared to 0%, 2% and 1%, respectively, when small invertebrates were excluded (Fornara & Dalling Reference FORNARA and DALLING2005, D. Fornara pers. comm.). These rates are suggestive of a dominant role for seed predation and removal in secondary dispersal for the three species used in our study.
The seed predation percentages measured by Fornara & Dalling (Reference FORNARA and DALLING2005) are comparable to the displacement percentages (D ab) observed in the litter-free, understorey treatments of this study (88.8%, 88.2% and 74.1% for Cecropia insignis, Trema micrantha and Apeiba aspera, respectively, over 15–26 d), but represent an average daily removal percentage 3.3, 5.8 and 18.3 times higher (assuming daily physical displacement at the mean bead rate). However, these seeds were placed in a dry, exposed setting where there was no opportunity for seeds to adhere to, or be hidden within, the soil surface and visibility to seed predators would have been enhanced through loss of camouflage and capacity for rapid burial. Moreover, once located by ants, the entire seed cache would have been readily accessible. This test was very different from this study, where seeds were sown directly on the surface, and the contrast in outcome between the two studies provides a tentative estimate of the magnitude of protection provided by camouflage and burial (tempered by additional displacement due to rain splash). Our results suggest that directly scattered seeds of these species are only 31%, 17% and 5%, respectively, as displaceable (either by rain splash or ants) as seeds exposed in the manner of Fornara & Dalling (Reference FORNARA and DALLING2005).
Burial of most natural and artificial seeds was unaffected by the presence of litter, suggesting that burial occurred by jetting through small gaps in the litter layer combined with local channelling of surface water (e.g. over leaf surfaces) so that some seeds were washed into pores. Litter reduced displacement for most artificial seeds (probably because they rolled easily between leaves or became lodged in the litter), but otherwise had no effect on displacement, indicating that seeds were equally exposed and accessible whether or not litter was present. Reductions in seedling recruitment on BCI due to litter (Dalling & Hubbell Reference DALLING and HUBBELL2002) therefore occur because of events after secondary dispersal (e.g. the covering of seeds and emerging seedlings by fresh litter, Daws et al. Reference DAWS, BALLARD, MULLINS, GARWOOD, MURRAY, PEARSON and BURSLEM2007).
Burial and emergence on BCI
Increased depth of burial reduces the emergence of small-seeded pioneers (e.g. emergence of Cecropia insignis seeds covered by 10 mm of sieved soil was less than half that of uncovered seeds, while emergence of Apeiba aspera seeds was unaffected, Pearson et al. Reference PEARSON, BURSLEM, MULLINS and DALLING2002). However, under forest conditions, shallow burial can improve germination and seedling survival by reducing the effects of surface soil drying (Daws et al. Reference DAWS, BALLARD, MULLINS, GARWOOD, MURRAY, PEARSON and BURSLEM2007) as well as reducing predation and fungal infection (Dalling Reference DALLING, Forget, Lambert, Hulme and Vander2005, Gallery et al. Reference GALLERY, DALLING and ARNOLD2007). In addition, unlike seeds covered by sieved soil, seeds buried by jetting down soil pores retain access to light and a ready pathway for shoot emergence (Pearson et al. Reference PEARSON, BURSLEM, MULLINS and DALLING2003). Consequently, shallow burial of small-seeded pioneer species is likely to be beneficial even though burial at greater depth can prevent emergence completely (Pearson et al. Reference PEARSON, BURSLEM, MULLINS and DALLING2002).
In conclusion, the responses of seeds to physical processes such as rainfall may be of greater importance, for seed survival, than adaptations to biological secondary dispersal. This alternative perspective on the mechanics of seed displacement to favourable surface sites (Schupp et al. Reference SCHUPP, MILLERON, RUSSO, Levey, Silva and Galetti2002) requires more investigation. The implications are far-reaching: a clearer characterisation of the spatial dynamics of pioneer seeds during the secondary dispersal stage – particularly in gaps – will lead to an improved understanding of the mechanistic basis of tree regeneration and the maintenance of species-rich assemblages in tropical forests.
ACKNOWLEDGEMENTS
This research was supported by the Natural Environment Research Council (studentship to TRM and grant to DFRPB). In the UK, we thank I. Perzia and the staff of the School of Biological Sciences, Department of Geology & Petroleum Geology and the Marischal Museum, University of Aberdeen. In Panama, we thank the Smithsonian Tropical Research Institute staff and fellow researchers on Barro Colorado Island for all their support, especially O. Acevedo, B. Jiménez, M. Ruiz, E. Sayer, R. Gallery, E. Sánchez, J. Watkins and J. Shik. We are grateful to J. Chave for his comments on an earlier draft of this manuscript and to A. Hector.



