Surgical site infections (SSIs) are a common complication, adding significantly to the morbidity and mortality of patients and costs of treatment.Reference Whitehouse, Friedman, Kirkland, Richardson and Sexton 1 , Reference Partanen, Syrjala, Vahanikkila and Jalovaara 2 Feedback on SSI rates can inform efforts to reduce SSIs,Reference Brandt, Sohr, Behnke, Daschner, Ruden and Gastmeier 3 – Reference Løwer, Eriksen, Aavitsland and Skjeldestad 7 therefore, the data presented should be simple, timely, and clear.Reference Brummer, Brandt, Sohr and Gastmeier 8
The overall crude rates for both superficial and deep SSIs are widely used when the national surveillance networks provide feedback to participating hospitals. However, extra caution must be taken when comparing hospitals because the differences may be related to varying patient populations (ie, case mix) and/or varying surveillance methods in hospitals, sensitivity of case finding, type of medical procedures undertaken, and so on.Reference Sax and Pittet 9 – Reference Huotari 11 A fair comparison of SSI rates is important when providing feedback to hospitals as well as for public reporting, which might initiate quality competition among hospitals.Reference Martin, Zingg, Hansen, Gastmeier, Wu, Pittet and Dettenkofer 12
Since 1999, surgical procedures and SSIs have been recorded in the Finnish Hospital Infection Program (SIRO), where orthopedic procedures represent most of the surveillance data. The hypothesis behind this study was that both the deep and deep-adjusted SSI rates could provide a more realistic hospital comparison because deep SSI rates usually lead to readmission to the operating hospital and adjusted deep SSI rates consider patient and hospital characteristics. Thus, we sought to determine whether hospital comparison by deep or adjusted deep SSI rates could provide a better basis for feedback to Finnish hospitals and for future public reporting than overall SSI rates.
METHODS
The SIRO comprises hospitals distributed across Finland, including 5 university hospitals. Participation of hospitals in SIRO is voluntary, and results are handled confidentially.Reference Huotari 11 In-hospital and postdischarge surveillance is performed by trained infection control nurses using definitions established by the Centers for Disease Control and Prevention (CDC).Reference Horan, Gaynes, Martone, Jarvis and Emori 13 After discharge, all hospitals systematically identify SSIs on readmission and during follow-up visits.Reference Huotari and Lyytikäinen 14 In addition, most hospitals conduct postdischarge surveillance using a questionnaire, which is given to each patient at discharge. The questionnaire is filled out by a nurse or physician when the patient contacts the healthcare system because of an SSI.
We analyzed surveillance data for 73,227 hip arthroplasties (HPROs) in 17 hospitals and for 56,860 knee arthroplasties (KPROs) in 18 hospitals participating in SIRO during 1999–2014. Participation increased from 3 hospitals in 1999 and 2000 to an average of 11 hospitals during 2001–2014. Altogether, the participating hospitals performed HPRO and KPRO surveillance for 155 and 154 total surveillance years, respectively. We defined deep SSIs as a combination of deep SSIs and organ/space SSIs. HPRO and KPRO procedure groups included both primary operations and reoperations.
Statistical Analyses
For each hospital, we first calculated the overall and deep SSI rates for HPRO and KPRO by dividing the number of SSIs by the number of operations (ie, the observed SSI rate). We mapped the hospital-specific observed rates with a 95% control limit (2 standard deviations) and a 99.8% control limit (3 standard deviations) around the mean overall SSI rate, and we calculated the mean deep SSI rate in funnel plots to identify possible outliers.Reference Spiegelhalter 15 Second, we calculated the expected overall and deep SSI rates with 95% confidence intervals (CIs).Reference Austin 16 Third, we calculated the adjusted deep SSI rates.Reference Austin 16 , Reference Normand, Glickrnan and Gatsonis 17 For adjustments, we chose a subset of patient-level variables that have previously been shown to be important risk factors for SSI (eg, age, sex, ASA-score, wound class, duration of operation, total/partial operation and reoperation) and had a significance level <25% in univariate logistic regression analysis, separately for HPRO and KPRO.Reference Hosmer, Lemeshow and Sturdivant 18 The patient-level variables that were significant at 5% in multivariate logistic regression analyses constituted the first level in the hierarchical logistic regression model and the second level comprised the hospital-level variables (ie, number of operations and academic status).Reference Normand, Glickrnan and Gatsonis 17 The model was fitted to data in a Bayesian framework using Markov Chain Monte Carlo (MCMC) simulation.Reference Goldstein and Spiegelhalter 19 The correlations between the hospital median expected rank in overall versus deep SSI rate and in deep SSI versus adjusted deep SSI rate were investigated using Spearman’s correlation coefficient (ρ). The standardized morbidity ratio rank method was used to compare hospital rank, and Bayesian 95% CIs were constructed for each hospital rank.Reference Austin 16 A hospital was classified as an outlier if the 95% CI for the hospital rank occurred entirely in the top or bottom quartile of ranks.Reference Austin 16 All analyses were performed using STATA statistical software, version 14 (StataCorp, College Station, TX) and Winbugs version 1.4.3 (MRC Biostatistics Unit, Cambridge, UK).
RESULTS
Overall, 1,819 of 73,227 SSIs following HPRO (2.48%) and 1,126 of 56,860 SSIs following KPRO (1.98%) were identified; 1,200 of 1,819 (66%) and 996 of 1,126 (88%) were detected by postdischarge surveillance, respectively. For all SSIs, 725 of 1,819 deep SSIs following HPRO (40%) and 528 of 1,126 deep SSIs following KPRO (47%) were identified; 558 of 725 (77%) and 431 of 528 (82%) were detected on readmission, respectively.
We microbiologically confirmed 1,524 of 1,891 SSIs among HPROs overall (84%) and 808 of 1,126 SSIs (72%) among KPROs overall. For the deep SSIs, we confirmed 636 of 725 SSIs (88%) among HPROs and 461 of 528 SSIs (87%) among KPROs. The most common microbes identified were Staphylococcus aureus (range by procedure type, 28%–46%) and coagulase-negative staphylococci (19%–32%).
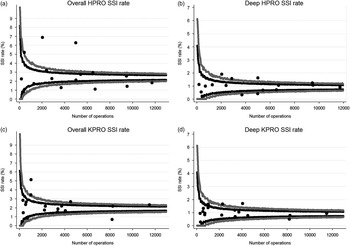
For HPRO, the overall hospital-specific SSI rates ranged from 0.82 to 6.88, and deep SSI rates ranged from 0.33 to 1.90. For KPRO, the overall SSI rates ranged from 0.71 to 5.14 and deep SSI rates ranged from 0.29 to 1.62 (Figure 1). Only few outlier hospitals were identified; however, more outliers occurred when the overall SSI rates were considered. Almost all hospitals fit inside or very close to the control limits, and no clear differences were detected between hospitals when the deep SSI rates were compared.
Funnel plots of observed overall and deep surgical-site infection (SSI) rates in hip arthroplasties (HPROs) at 17 hospitals and in knee arthroplasties (KPROs) at 18 Finnish hospitals during 1999–2014. Every dot represents the SSI rate at 1 hospital.

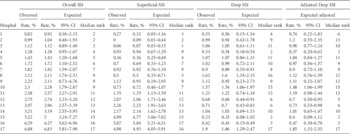
Among HPROs, the SSI rates ranged from 0.92 to 6.83 overall, from 0.34 to 1.86 for deep SSIs, and from 0.37 to 1.85 for adjusted deep hospital-specific SSIs (Table 1). Among KPROs, the SSI rates ranged from 0.71 to 5.03 overall, from 0.42 to 1.60 for deep SSIs, and from 0.56 to 1.55 for adjusted deep hospital-specific SSIs (Online Supplemental Table). The 95% CIs of the overall, deep, and adjusted deep SSI rates mostly overlapped between hospitals.
Overall, Superficial, Deep, and Adjusted Deep Surgical Site Infection (SSI) Rates With 95% Confidence Intervals (CI) in Hip Arthroplasties (HPRO) and Hospital Median Rank at 17 Finnish Hospitals During 1999–2014

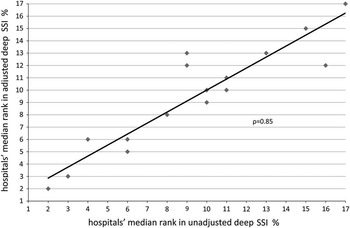
For almost all hospitals, the rank position changed when overall versus deep SSI rates were evaluated. For example, for HPRO, 4 hospitals changed rank <3 positions and 11 hospitals changed several positions, up to maximum of 13 rank positions in 1 hospital (Table 1). The hospital rank did not correlate between overall and deep SSI rates (HPRO, ρ=0.03; KPRO, ρ=0.40). In contrast, hospital rank did not change drastically when evaluating unadjusted deep versus adjusted deep SSI rates. For HPRO, 10 hospitals did not change positions, 4 hospitals changed <3 ranks, and 3 hospitals changed a few positions up to maximum of 4 rank positions in 2 hospitals (Table 1), and a correlation among these changes was observed in HPRO, ρ=0.85 (Figure 2) and in KPRO, ρ=0.94) (Online Supplemental Figure).
Correlation of hospital median rank between deep and adjusted deep surgical site infection (SSI) rates in hip arthroplasties (HPROs) at 17 Finnish hospitals during 1999–2014.

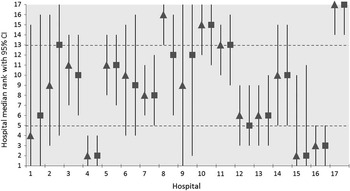
Hospital rank had large 95% CIs in all 3 rates of HPRO and KPRO (see HPRO, Figure 3). Only 2 outliers (hospitals 4 and 17) were identified, and 1 was borderline (hospital 16).
Hospital median rank with 95% confidence intervals (CIs) by deep surgical site infection (SSI) rate (triangle marker) and adjusted deep SSI rated (square marker) in hip arthroplasties (HPROs) at 17 Finnish hospitals during 1999–2014.

DISCUSSION
Our study, based on the surveillance data of 130,087 orthopedic procedures, showed that the hospital rank changed when the deep SSI rate was considered instead of the overall SSI rate. However, hospital rank did not change remarkably when we compared the crude deep SSI rates with the adjusted ones.
A couple of hospitals were identified as outliers by funnel plots when we compared hospitals by the overall SSI rates in HPRO and KPRO. The outliers with high overall rates might be due to true problems in infection control or to more comprehensive surveillance. In addition, the outliers with low overall rates might reflect good infection control or underreporting because less resources are allocated to surveillanceReference Huotari 11 , Reference Koek, Wille, Isken, Voss and van Benthem 20 or because some patients with SSI are not readmitted to the same hospital where they underwent surgery.Reference Yokoe, Avery, Platt and Huang 21 However, when we compared deep SSI rates, the same hospitals were not identified as outliers. Because the deep SSIs often lead to readmissions, the differences between the overall and deep SSI rates are likely due to differences in postdischarge surveillance of superficial SSIs outside hospital. The overall SSI rates we detected in HPRO (2.5%) were higher than the rates reported in Germany (1.0%) and the United Kingdom (0.7%) but lower than in Norway (3.7%) and Spain (3.2%) during 2010–2011. However, the range in overall SSI rates between our hospitals was large (0.7%–5.1%), similar to the ranges of European countries (0.4%–11.4%). 22
Apart from using the ordinary observed SSI rates for the interhospital comparisons, we also calculated the expected SSI rates to obtain 95% CIs and to separate systematic differences from random ones (Table 1). The expected rates based on the data-generating mechanism are more stable in time than the observed rates.Reference Goldstein and Spiegelhalter 19 By using 95% CIs, we avoided unfair and unwarranted conclusions in hospital comparisons.Reference Goldstein and Spiegelhalter 19 The 95% CIs of hospital rank in our study were large and largely overlapped (Figure 3). This finding was expected because the ranking methods we used have previously been shown to be conservative.Reference Austin 16 However, providing the expected median ranks in feedback might be confusing because the ranks may not always match the observed ranks, and several hospitals may have the same rank.
We did not detect a correlation in hospital rank between the overall and deep SSI rates in HPROs or in KPROs, but we did detect a correlation between crude and adjusted deep SSI rates. It has previously been shown that case mix should be taken into consideration in the interhospital comparisons of healthcare-associated infections.Reference Kanerva, Ollgren and Lyytikainen 23 Our statistical approach to adjustment was based on a hierarchical regression model that permits the use of both patient- and hospital-level data. This method helps explain the variation among hospitals of different sizes and treatment practices.Reference Normand, Glickrnan and Gatsonis 17 However, contrary to what we expected, our results suggest that SSI risk was similar among all operated patients and hospitals. Brummer et alReference Brummer, Brandt, Sohr and Gastmeier 8 also ranked hospitals, although they used a different methodology. Their study covered 12 procedures, including HPRO and KPRO. They compared the crude infection rate (CIR) with the risk-adjusted standardized infection ratio (SIR) using the National Nosocomial Infection Surveillance (NNIS) risk index. The NNIS risk index is based on the American Society of Anesthesiologists (ASA) score, wound contamination class, and duration of the operation; all were among the variables for adjustment also used in our study. They ranked departments using the 2 rates and examined the correlation between the 2 ranks. Similar to our finding, they found a strong correlation between the CIR and SIR and no change in department rank when SIR was taken into account.
Our study has several limitations. We only included orthopedic arthroplasties; thus, the results may not apply to other surgical procedures. The surveillance data were provided on voluntary basis by SIRO hospitals, which may not represent all hospitals performing orthopedic surgeries in Finland. However, in 2013, SIRO hospitals participating in orthopedic surveillance together performed more than half of all HPROs and KPROs in Finland.Reference Rainio, Perälä and Pelanteri 24 We did not have complete data on use and timing of perioperative prophylaxis nor data on type of prostheses, both of which could contribute to variations in SSI rates between hospitals. We included data for 16 years, mainly because a shorter period would have led to very wide 95% CIs. The patient population may have changed over time. Finally, our selection of the variables for adjustment on a patient level might have been incomplete. Our selection was based on patient-related risk factors for SSIs in KPRO and HPRO by Fukuda and Kuroki,Reference Fukuda and Kuroki 25 and it included 2 additional factors, total or partial operation, and reoperation. We might have missed some factors, such as length of hospital stay, medical insurance status and comorbidity, for which adjustment resulted in substantial shifts in hospital rankings in infection-related readmissions in a study by Gohil et al.Reference Gohil, Datta and Cao 26 However, adding factors in adjustment would have made the 95% CIs of hospital ranks even larger.
A question remains: Should we use the overall SSI rates with less overlapping of the 95% CIs for feedback or should we use the deep SSI rates, but with significant overlapping of 95% CIs among hospitals? Although the use of unstandardized approaches by hospitals for case finding result in differences in hospital-specific SSI rates,Reference Rusk, Bush and Brandt 27 we can assume that deep SSI rates are based on more standardized methods among hospitals. Hence, to provide useful feedback and a fair comparison between hospitals, we have 2 options. First, to be able to compare overall rates, more effort should be made to standardize case-finding methods for superficial SSIs. Second, we should restrict our comparisons to deep SSI rates and should systematically utilize readmission data from the existing electronic hospital information systems for identifying cases of deep SSIs, as previously recommended.Reference Rusk, Bush and Brandt 27 , Reference Calderwood, Kleinman, Murphy, Platt and Huang 28 There is a risk of missing SSIs due to incomplete automated data harvesting or because the patient was readmitted to another hospital.Reference Huotari 11 , Reference Yokoe, Avery, Platt and Huang 21 However, without sacrificing sensitivity,Reference Rusk, Bush and Brandt 27 , Reference Lower, Dale, Eriksen, Aavitsland and Skjeldestad 29 identification of potential readmitted deep SSIs can provide a more consistent and less resource-demanding method of case finding among hospitalsReference Rusk, Bush and Brandt 27 than various methods used to detect superficial SSIs.Reference Koek, Wille, Isken, Voss and van Benthem 20 Moreover, orthopedic surgeons are more interested in deep SSIs because they are severe and require revision surgery.
Deep SSI rates may be a better tool for interhospital comparison than overall SSI rates; however, small numbers of SSIs could pose a problem in providing timely feedback. The adjustment could lead to fairer hospital ranking, but it is not always necessary. To prevent incorrect conclusions in interhospital comparisons, further work is needed to improve surveillance methods, especially in detecting SSIs on readmission. This improvement is crucial if the hospital-specific SSI rates are to be publicly available.
ACKNOWLEDGMENTS
The authors would like to thank Dr Alicia Barrasa Blanco, EPIET Scientific Coordinator, for reviewing the manuscript and Ms Liisa Palonen for proofreading the manuscript.
Financial support: No financial support was provided relevant to this article.
Potential conflicts of interest: All authors report no conflicts of interest relevant to this article.
SUPPLEMENTARY MATERIAL
To view supplementary material for this article, please visit https://doi.org/10.1017/ice.2016.333