




No CrossRef data available.
Article contents
An event-related potential study of the processing of affective facial expressions in young children who experienced maltreatment during the first year of life
Published online by Cambridge University Press: 01 November 2005
Abstract
This investigation examined the effects of maltreatment during the first year of life on the neural correlates of processing facial expressions of emotion at 30 months of age. Event-related potentials (ERPs) in response to children passively viewing standardized pictures of female models posing angry, happy, and neutral facial expressions were examined. Four ERP waveform components were derived: early negative (N150), early positive (P260), negative central (Nc), and positive slow wave (PSW). Differences in these waveforms between a group of 35 maltreated and 24 nonmaltreated children were reported. The groups did not differ on the early perceptual negative component (N150), whereas the maltreated children had greater P260 amplitude at frontal leads compared to the nonmaltreated children in response to viewing angry facial expressions. For the Nc component, the nonmaltreated comparison children exhibited greater amplitude while viewing pictures of happy faces compared to angry and neutral faces, whereas the maltreated children showed greater Nc amplitude at central sites while viewing angry faces. For the PSW, the nonmaltreated group showed a greater area score in the right hemisphere in response to viewing angry facial expressions compared to the maltreated group. The results are discussed in terms of brain development and function, as well as their implications for the design and evaluation of preventive interventions.
This research was supported by grants from the National Institute of Mental Health (MH067792-02) and the Spunk Fund, Inc. to Dante Cicchetti. We gratefully acknowledge the technical assistance of Rafael Klorman, PhD, and Karen La Due in setting up the ERP laboratory at Mt. Hope Family Center, which was used to carry out this study. Moreover, we appreciate the support and advice provided by Drs. Sheree L. Toth and Fred A. Rogosch. In addition, we are grateful to Karen La Due, Steve Perino, and Shannon O'Hara, as well as other staff at Mt. Hope Family Center, for their assistance in data collection. Finally, we are eternally grateful to those families who participated in this research.
Information
- Type
- Research Article
- Information
- Copyright
- © 2005 Cambridge University Press
The ability to recognize basic emotion expressions from facial affect displays is critical for the development of adaptive functioning (Izard & Harris, 1995; Izard, Youngstrom, Fine, Mostow, & Trentacosta, in press; Sroufe, 1996). The accurate identification of emotions from both facial and contextual cues is normatively mastered by the preschool years (Izard & Harris, 1995; Walden & Field, 1982). The incorrect processing and recognition of discrete affects can exert a deleterious impact on numerous areas of socioemotional functioning, including parent–child attachment relationships, emotion regulatory skills and self-regulation abilities, and peer relations (Cassidy, 1994; Cicchetti, Ackerman, & Izard, 1995; Cicchetti & Izard, 1995; Cole, Martin, & Dennis, 2004; Dodge, Pettit, & Bates, 1990; Sroufe, 1996). Moreover, abnormalities in the recognition of facial expression have been discovered in a variety of childhood and adult mental disorders and high-risk conditions (American Psychiatric Association, 1994; Cicchetti & Schneider–Rosen, 1984; Hesse & Cicchetti, 1982; Izard et al., in press; Izard & Harris, 1995).
Developmentally, early limitations in the capacity for information processing require children to focus their attention on only the most salient aspects of the environment (Bjorklund, 1997). This ontogenetically normal aspect of selective attention suggests that irrespective of the individual state of the organism, emotional development is likely to be contingent on the nature of the impact or experiences made available to the child (Pollak, Cicchetti, Hornung, & Reed, 2000; Sroufe, 1996).
Nonetheless, it is extremely difficult to parse the relative contributions that experience and leaning versus internal predispositions make to the development of emotion recognition (Gauthier & Nelson, 2001; Nelson, 1987). Typically, children raised in low-risk environments are exposed to a rich and complex array of similar emotional experiences from birth (Pollak et al., 2000). Consequently, the predominant emotional environment experienced by the vast majority of youngsters is likely to be so invariant that influences emanating from the environment may be masked (Pollak et al., 2000).
The investigation of “experiments of nature,” such as children who have resided in an institutional environment or children who have been maltreated, provides scientists with an important entree into unraveling the relative importance of innate and experiential contributions to the recognition and processing of emotion. When there is a clear perturbation in a component system within a group of high-risk individuals or individuals with a mental disorder, examination of how that atypicality relates to the organization of other component systems can reveal important information regarding the interdependence of components not apparent under normal conditions (Cicchetti, 1990, 2003; Lenneberg, 1967; O'Connor, 2003; Sroufe, 1990; Weiss, 1961).
In this regard, two groups of investigators have utilized event-related potentials (ERPs) to compare the patterns of neural processing evoked by facial expressions in children raised in atypical emotional environments. ERPs are an index of central nervous system functioning thought to reflect the underlying processing of discrete stimuli (Hillyard & Picton, 1987). ERPs are scalp-derived changes in brain electrical activity over time, obtained by averaging time-locked segments of the electroencephalogram (EEG) that are synchronized to the presentation of a stimulus (Donchin, Karis, Bashore, Coles, & Gratton, 1986).
The first group of investigators, Parker, Nelson, and their colleagues in The Bucharest Early Intervention Project Core Group (2005a, 2005b), have conducted two ERP studies with Romanian youngsters who either were institutionalized or who had never experienced institutional care. In the first study, Parker et al. (2005b) examined the ERPs of institutionalized Romanian infants between the ages of 7 and 32 months evoked by facial expressions of fearful, angry, happy, and sad to ascertain whether these youngsters' deficits in processing emotional and social cues in behavioral interactions had their origins in difficulties in the recognition of basic human facial expressions of emotion (see, e.g., O'Connor, Bredenkamp, & Rutter, 1999; O'Connor, Rutter, Beckett, Keaveney, & Kreppner, 2000; Rutter, Andersen–Wood, Beckett, Bredenkamp, Castle, Groothues, Kreppner, Keaveney, Lord, & O'Connor, 1999). Parker et al. (2005b) theorized that early institutional rearing, through its disruption of normal social interactions, may deprive the amygdalar circuitry of vital experiences through which social and emotional stimuli are associated with internal states of pleasure and displeasure, thereby eventuating in deficits in the recognition of facial expressions of emotion. Parker et al. (2005b) found that, compared to Romanian youngsters who had never resided in an institutional environment, children who were institutionalized manifested different patterns of responding in early latency components of the ERP. Specifically, at both midline and lateral electrode sites, the never institutionalized infants exhibited greater N170 amplitudes to the sad expression; in contrast, the institutionalized youngsters displayed greater N170 amplitudes to the fear expression. At the midline electrode site, never institutionalized and institutionalized children manifested greater P250 amplitudes in response to the sad and fear expressions, respectively.
In addition, Parker et al. (2005b) found that there were dramatic group differences in amplitude across all of the ERP components examined in their investigation: the two early precognitive response components, N170 and P250; the negative central component (Nc, thought to reflect allocation of attention; Courchesne, Ganz, & Norcia, 1981); and the positive slow wave component (PSW), believed to reflect updating of memory for a partially encoded stimulus (de Haan & Nelson, 1997). Relative to the institutionalized groups of children, the never institutionalized comparison groups of youngsters displayed greater amplitudes of the N170, Nc, and PSW ERP components across all emotion conditions; whereas, relative to the never institutionalized group of children, the institutionalized group exhibited a larger P250 amplitude.
In an investigation of the EEGs of the same sample of Romanian children, Marshall and Fox (2004) found that, compared to the never institutionalized group, the institutionalized youngsters exhibited a pattern of increased low-frequency (theta) power in posterior scalp regions and decreased high-frequency (alpha and beta) power, particularly in the frontal and temporal electrode regions. These findings are interpreted as evidence for cortical hypoactivation in the institutionalized Romanian children. Furthermore, Chugani, Behen, Muzik, Juhász, Nagy, and Chugani (2001) utilized positron emission tomography (PET) on a sample of children who had been adopted from Romanian institutions approximately 6 years previously. Chugani and colleagues (2001) found that these children exhibited significantly decreased metabolic activity in multiple brain regions, suggesting that the effects of early institutional care may persist through childhood.
Taken together, the group differences in ERP amplitude in the Parker et al. (2005b) investigation, the Marshall and Fox (2004) findings of decreased EEG power, and the significantly decreased metabolic activity across multiple brain regions discovered by Chugani et al. (2001) in their PET study provide corroborative support for the hypothesis that an early institutional upbringing may contribute to a long-lasting development of cortical hypoactivation, as well as dysfunction in emotion processing and brain function.
In a related investigation, utilizing the same sample of Romanian youngsters, Parker et al. (2005a) recorded the ERPs of institutionalized and never institutionalized children to brief images of caregivers' and strangers' faces. As in their prior study (Parker et al., 2005b), prominent amplitude differences were obtained in all of the ERP components examined (i.e., N170, P250, Nc, and PSW). With the exception of the P250 component, the amplitude of the other waveforms studied were larger in both face conditions in the never institutionalized group. The group of institutionalized children exhibited a larger amplitude of the P250. Moreover, consistent with prior literature (e.g., Carver, Dawson, Panagiotides, Meltzoff, McPartland, Gray, & Munson, 2003; Dawson, Carver, Meltzoff, Panagiotides, McPartland, & Webb, 2002; de Haan & Nelson, 1997, 1999; Nelson & Collins, 1991), the amplitude of the Nc was greater to strangers' faces than to those of caregivers for both the institutionalized and never institutionalized groups of children. In contrast, the institutionalized groups of youngsters displayed a greater PSW in response to the caregiver's face, relative to the face of the stranger. Because previous research has led to the conclusion that the PSW represents the updating of the memory of stimuli that are not fully encoded (see de Haan & Nelson, 1997; Nelson & Monk, 2001), the PSW findings in the Parker et al. (2005a) investigation suggest that the faces of primary caregivers in institutionalized environments may not be fully encoded by the children assigned to their care.
The second investigative team that has utilized a “natural experiment” to examine ERPs in response to emotion stimuli has been that of Pollak and colleagues in their studies of children who have experienced child abuse and neglect (Pollak, Cicchetti, & Klorman, 1998; Pollak, Cicchetti, Klorman, & Brumaghim, 1997; Pollak, Klorman, Thatcher, & Cicchetti, 2001; Pollak & Tolley–Schell, 2003). This research has focused on elucidating the potential mechanisms through which the chronic stress experienced by children who have been maltreated could eventuate in problems in the processing of emotion (Pollak et al., 1998).
Attachment systems have been theorized to be constructed to permit flexible responses to environmental circumstances, influence, and be influenced by emotion regulatory abilities, and function through internal working models that children hold of themselves and of their relationships with others (Bowlby, 1969/1982; Bretherton, 1990; Cassidy, 1994; Sroufe, 1996). In these experiments, Pollak and colleagues have strived to ascertain whether the activation of these mental representations may be reflected through physiological activity as well as behavior. Pollak and colleagues reasoned that the P3b ERP component, which is believed to reflect neural processes involved in the updating of mental representations in working memory and varies as a function of task relevance and stimulus probability, may be useful in illuminating the cognitive processes that accompany the encoding of salient emotional stimuli.
In the first investigation, Pollak et al. (1997) compared the ERPs of school-aged maltreated children to those of a group of nonmaltreated children of comparable socioeconomic background and cognitive maturity. Across a variety of experimental conditions, children attended to different facial expressions of emotion (e.g., happy, angry, neutral), and the probability of occurrence (rare or frequent) and task relevance (target or nontarget) were manipulated. Children were instructed to respond to either an angry or a happy face, both of which appeared less frequently than the nontarget neutral face. The amplitude of the P3b ERP waveform of the nonmaltreated children was equivalent in both the happy and angry target conditions. In contrast, the P3b of the maltreated children was larger in the angry than in the happy target conditions. These findings suggested that angry and happy targets activated affective representations differently for maltreated versus nonmaltreated children and that the ERP response of the maltreated children reflected more efficient cognitive organization in the anger condition than in the happy condition.
In a subsequent study, conducted to determine the specificity of the relation between the ERP response of maltreated children and the nature of the elicited stimuli, Pollak et al. (2001) examined and compared the ERP response of maltreated and nonmaltreated children to prototypic happy, angry, and fear facial expressions. As was the case in their prior study, it was discovered that nonmaltreated children exhibited equivalent P3b amplitude in response to all of the target facial expressions of affect (e.g., anger, happy, fear). However, the amplitude of the P3b waveform of the maltreated children exceeded that of the nonmaltreated children only in response to the angry target (Pollak et al., 2001). These findings suggest that there was specificity in maltreated children's differential processing of the emotional information and that maltreated children are uniquely sensitive to detecting anger over other facial expressions of emotion.
In a further examination of maltreated children's hypersensitivity to anger, Pollak and Tolley–Schell (2003) posited that early experience of physical abuse may alter the development of perceptual systems by decreasing the minimum amount of threat-related stimulation needed to engage focused attention upon the threat inducing stimuli; they reasoned that if physically abused children respond more quickly and/or strongly to signals of threat, then problems disengaging attention away from anger may emerge. Pollak and Tolley–Schell (2003) employed a selective attention paradigm with an affective component and examined physiological and behavioral measures to assess children's orienting reaction and response time during valid trials, and children's disengagement reaction and response time during invalid trials. Physically abused children demonstrated a selective increase in ERP response on invalid angry trials as indexed by the P3b. These findings provide evidence that increased attentional resources were required to disengage from previously cued angry faces only. The physically abused children also demonstrated faster reaction times in the valid angry condition, consistent with the notion that abused children orient rapidly to cues primed by anger. There were no differences, however, in physically abused children's ERP responses, or reaction times, to happy trials, providing further support for a specific or differential deficit involving attentional processing of anger.
The results of the Pollak et al. (1997, 2001) and the Pollak and Tolley–Schell (2003) studies suggest that that the nature of experiences encountered by maltreated children during their lives have caused particular emotion stimuli to become more salient based, perhaps in part, upon the stored mental representations that have been associated with the stimulus over time. Consequently, the prior experience of maltreated children is thought to be reflected in these children's psychophysiological response.
In addition, Pollak and colleagues also have investigated the emotion recognition abilities of maltreated youngsters utilizing behavioral techniques (see, e.g., Pollak et al., 2000; Pollak & Kistler, 2002). Pollak and colleagues' research on emotion recognition was informed by earlier work in which maltreated children were found to demonstrate less accurate recognition of emotions than nonmaltreated children, above and beyond the effects of cognitive ability (Camras, Grow, & Ribordy, 1983; Camras, Ribordy, Hill, Martino, Spaccarelli, & Stefani, 1988). Further investigation by Camras, Ribordy, Hill, Martino, Sachs, Spaccarelli, and Stefani (1990) has revealed that despite overall deficits in emotion recognition performance, analysis of maltreated children's processing errors suggested that maltreated children have a selective bias, or hypersensitivity, toward the detection of anger (Camras et al., 1990; see also Rieder & Cicchetti, 1989).
For physically abused children, displays of anger, often experienced as the most salient feature of their environment, may be the greatest predictor of threat. Consequently, Pollak and colleagues (2000) hypothesized that physically abused preschool children would exhibit an increased sensitivity to anger-related cues, perhaps also resulting in decreased attention to other emotional cues. Pollak et al. (2000) discovered that when physically abused children were exposed to a perceptual scaling task, they perceived angry faces as highly salient and more distinctive relative to other emotion categories. In addition, when instructed to match facial expressions to an emotional situation, physically abused children revealed a response bias for anger such that when they were uncertain which facial expression to choose, they showed a lower threshold for selecting anger. Moreover, physically abused children also have been shown to display more broad perceptual category boundaries for perceiving anger than nonmaltreated children (Pollak & Kistler, 2002) and to require less visual information to detect the presence of angry facial expressions (Pollak & Sinha, 2002).
Thus, taken in tandem, it appears that physically abused children do not have emotion recognition or affective information processing deficits in a global manner; rather, differential processing of emotion appears to be specific to anger. Neglected children, in contrast, were found to have more difficulty in accurately discriminating emotional expressions than were physically abused or nonmaltreated children (Pollak et al., 2000). Signal detection analyses revealed that neglected children employed a more liberal bias in selecting sad faces. Furthermore, when instructed to rate the similarity of facial expressions, neglected children made fewer distinctions between emotions. In contrast, the nonmaltreated children did not display any selection biases in their emotion processing, and, moreover, nonmaltreated children viewed discrete emotions as dissimilar on the perceptual scaling task. Taken together, the results of these investigations suggest that to the extent that children's experiences with the world varies, so, too, will their interpretation and understanding of emotional signals.
In the current study we investigated maltreated toddlers' ERP responses to angry, happy, and neutral facial expressions stimuli to extend the prior findings of Pollak and colleagues to an earlier developmental period. We focused on toddlerhood because it is a period when critical aspects of synaptogenesis, driven in large part by experience in the environment, as well as continued myelination, are occurring (Cicchetti & Curtis, in press; Huttenlocher, 2002; Thompson & Nelson, 2001). Moreover, development of higher cognitive functions primarily mediated by the prefrontal cortex, such as speech production and language, as well as advances in self-development and representational/symbolic processes, are taking place during the toddlerhood period (Cicchetti, 1990; Thompson & Nelson, 2001).
We had four major hypotheses that guided this work, based on four ERP waveforms that emerged from our data, which were very similar to the waveforms reported by Parker et al. (2005a, 2005b) in a group of Romanian toddlers of approximately the same age as the children in our sample. We did not undertake type of maltreatment analyses because of the high co-occurrence of maltreatment subtypes in the present sample and because of the limited sample size. The hypotheses are delineated below:
- N150: Because N150 appears to be a relatively early perceptual component of the ERP, we did not expect to find differences between the ERP amplitudes of maltreated and nonmaltreated youngsters.
- Early positive component: Based on prior research with institutionalized toddlers reviewed herein, we hypothesized that maltreated and nonmaltreated children would differ in the later, precognitive perceptual processes most likely reflected by this early positive component (identified as P250 by Parker et al., 2005a, 2005b). Specifically, we expected to find that maltreated toddlers would show larger amplitude of this early positive component while viewing angry facial expressions than their nonmaltreated counterparts.
- Nc: Because the Nc waveform is thought to reflect a child's allocation of attention to salient/relevant stimuli, we expected to find that the amplitude of Nc would be greater in maltreated children in response to viewing angry stimuli. In contrast, we expected that the amplitude of Nc would be larger in nonmaltreated toddlers when they were looking at happy stimuli.
- PSW: The PSW is believed to represent the updating of working memory. Accordingly, we hypothesized that maltreated toddlers would exhibit a greater PSW amplitude (area score) in response to viewing happy versus angry facial expressions, because the happy stimulus is likely less familiar than the anger stimulus to these youngsters. In addition, because anger may be a less familiar stimulus to nonmaltreated toddlers, we expected to find an increased PSW while viewing angry stimuli in nonmaltreated youngsters.
Research Design and Methods
Participants
A total of 66 low socioeconomic status (SES) children from maltreating families and nonmaltreating families, all of whom lived at home with their biological mothers, participated in the ERP data collection. Data from 59 of these were retained for analyses, and the final sample consisted of 35 children (19 female, 16 male) from maltreating families and 24 children (9 female, 15 male) from nonmaltreating families. The mean age of these children was 31.3 and 30.1 months, from the maltreating and nonmaltreating families, respectively. The entire sample ranged in age from 28.8 to 36.1 months. Detailed demographic characteristics of the sample will be described in a subsequent section, and are presented in Table 1.
Demographic characteristics

Prior to data collection, mothers of all children participating in the study received complete information concerning the study procedures, and provided informed consent for their child's participation, as well as consent for examination of all Department of Human and Health Services (DHHS) records involving the family.
Participant recruitment
Maltreating families were recruited from the DHHS and were representative of families receiving services from the Monroe County DHHS. Specifically, all families identified as having a child with a documented history of maltreatment in the first 12 months of life were contacted by a DHHS liaison, who requested permission from families to be contacted by project staff to be recruited for possible participation in this study. Determination of maltreatment status was based upon examination of Child Protective Service (CPS) and Preventive Services records at DHHS. All existing records for each family were coded by trained raters utilizing the Barnett, Manly, and Cicchetti (1993) nosological classification system for child maltreatment.
To maximize demographic comparability to the maltreatment sample, low- SES nonmaltreated families were recruited from families receiving public assistance in the form of Temporary Assistance to Needy Families. Nonmaltreatment status was confirmed by an absence of CPS or Preventive Services records for the family, as well as by maternal interview.
Demographic characteristics
Maltreating and nonmaltreating families were similar on most key demographic variables, summarized in Table 1. Males comprised 45.7% of the maltreating group, whereas 62.5% of the nonmaltreating group was male, with no statistically significant difference in gender composition between the maltreating and nonmaltreating groups. However, the children in the maltreating sample were slightly older than those in the nonmaltreating sample, 31.3 versus 30.1 months, t (2, 57) = 2.74, p < .01. Although different at the level of statistical significance, the actual mean age difference was less than 2 months and reflects minimal (if any) developmentally mediated differences in brain functioning. In addition, the mean maternal age of the maltreating sample was higher than that in the nonmaltreating sample, 29.4 versus 25.8 years, t (2, 57) = 2.27, p < .05. There were no statistically significant differences between the two groups on maternal marital status and maternal ethnicity. Both groups in the sample had low scores on Hollingshead's (1975) Four-Factor Index of Social Status, with 80.0% of the families in the maltreating group and 75.0% of the families in the nonmaltreating group falling in the two lowest social strata.
During participant recruitment for the ERP study, 38 families were approached concerning participation in the study but declined to take part. However, there were no statistically significant demographic differences between this group and those who participated in the ERP data collection. In addition, 4 of the 66 infants (6.1%) who came to the laboratory for EEG data collection yielded no data or incomplete data due to fussiness of the child and/or technical problems, and were thus not included in the final analyses. Data from an additional three infants who completed the ERP experiment were not included because of too few artifact free trials, yielding a final sample of 59 children.
Maltreatment characteristics: Inclusion and exclusion criteria
Utilizing the Maltreatment Classification System (Barnett et al., 1993), the presence or absence of three subtypes of maltreatment was determined at the family level. Subtype grouping was based upon family level maltreatment reports, in addition to CPS reports on individual children, to enable us to most comprehensively account for the type of maltreating environment in which the children were immersed. Within the final sample, 77.1% of the maltreating families demonstrated physical neglect, 14.3% physical abuse, and 8.6% sexual abuse. Comorbidity of subtypes of maltreatment is common and has been well documented (Barnett et al., 1993; Cicchetti & Barnett, 1991); in the present study subtype comorbidity occurred for 65% of the sample.
For all maltreating families, mothers were named as a perpetrator of maltreatment, although additional perpetrators may have been present. In addition, the maltreatment sample in this study consisted of families where the biological mother has remained the primary caregiver. Infants placed in foster care and HIV positive infants were not recruited for the current sample. Infants who had been placed in foster care were excluded because we were, in part, interested in the impact on brain functioning of the caregiving environment provided by the biological mother throughout the first 2.5 years of life. Because of the developmental and medical complications associated with HIV, these infants were not included in our study. In addition, infants born more than 4 weeks prematurely, and/or with severe perinatal medical complications, were not included in the final sample.
EEG recording
The EEG was recorded from midline (Fz, Pz, Oz) and lateral scalp locations (F3, F4, F7, F8, C3, C4, T3, T4, T5, T6, P3, P4, O1, O2) using a Lycra Electro-Cap (Electro-Cap International, Eaton, OH) fitted with Ag–AgCl disk electrodes sown into the cap, arrayed according to the International 10/20 system (Jasper, 1958). EEGs were also recorded from left and right mastoids, as well as the reference site at the vertex (Cz). An anterior midline site (AFz) served as the ground electrode. Following cap placement, a small amount of Electro-Gel was placed into each of the scalp and mastoid electrodes. After pressing the gel into the electrode and creating good contact between the scalp and electrode, a small quantity of electrolytic conducting gel was inserted into each electrode. The electrooculogram (EOG) was recorded from electrodes placed vertically above and below the right eye bisecting the midline, and horizontally at the right and left canthus. The EOG electrodes were held in place with small adhesive collars, and a small amount of conducting gel was placed inside the electrode prior to placement on the face. The capping procedure was considered complete when impedances were at or below 5 kΩ for scalp electrodes and 10 kΩ for eye electrodes.
Signals from all EEG and EOG channels were recorded using a SYNAMPS 32-channel EEG amplifier manufactured by Neuroscan, Inc. (El Paso, TX) and the Acquire module of Scan 4.1 EEG software (Neuroscan, Inc.). EEG gain was set to 500, and gain for the EOG channels was set to 150. All data were sampled at 2-ms intervals (500 Hz), and signals from all channels were digitized onto the hard drive of a PC using a 12-bit A/D converter after being filtered through a bandpass filter from 0.1 to 30 Hz, as well as a 60-Hz notch filter. Prior to recording EEG data in each experimental session, a 400-mV 20-Hz calibration signal was input into each of the channels.
All participants viewed a total of 133 images. Angry and happy facial expressions were each presented across 20 trials (each comprising 15% of the total number of trials), whereas the neutral stimuli were presented across 93 trials (70% of the total number of trials). Trials consisted of a 200-ms prestimulus baseline, followed by a 1000-ms stimulus presentation. Stimulus offset was followed by a blank screen for 800 ms. The intertrial interval was 1000 ms for all trials.
Continuous EEG data were monitored online throughout the experimental session, and periods with excessive artifact due to subject movement were marked. Videotapes of subjects during the EEG data collection were coded by two research assistants offline to determine whether the infant was looking at the computer monitor in the subject booth during presentation of experimental stimuli. All raters were unaware of the participants' maltreatment status. The videotape recordings were synchronized with stimulus presentation, and the coders rated whether or not the infant was looking at the stimulus presentation monitor for at least 20 out of a possible 30 video frames spanning the 1,000-ms stimulus presentation interval. All trials during which the infant failed to attend to the stimulus for fewer than 20 of the 30 video frames were not included in the calculation of individual averages. Interrater reliability for the coding system was calculated for a random subset of 20% of the subjects for whom data was used. The two raters achieved 86% agreement for looking, with no statistically significant differences on interrater agreement across the three stimulus types.
Stimuli
Participants viewed black and white images of the face of one of three adult Caucasian females posing angry, happy, and neutral facial expressions selected from a standardized set of stimuli developed by Ekman (1976; slide numbers 21, 23, 24, 51, 53, 54, 66, 68, and 69).
Each subject viewed the same face during the experiment, chosen randomly from the three models prior to the experimental visit. The ordering of angry, happy, and neutral trials was different across each of the three image sets. The ordering was randomly determined based on probability of stimulus presentation. No stimulus type was presented more than two times in a row. Images appeared one at a time on a computer monitor situated approximately 120 cm from the subject, and the visual angle subtended by the slides was 8.5 × 13°. The presentation of the stimuli was programmed and controlled using the STIM module of the Scan 4.1 software package (Neuroscan, Inc.).
ERP data reduction
The EEG signal was edited offline for artifacts using software algorithms. Scalp leads were referenced to an inactive mastoid electrode and later rereferenced to linked ears offline. Trials were excluded from further processing if the EEG signal exceeded ±250 μV in any 50-ms window. To correct for the influence of eye movement or blinks on the EEG, a software algorithm based on procedures described by Gratton, Coles, and Donchin (1983) was applied, where EEG data were adjusted for their regression on the EOG for vertical (eye blinks, etc.) and horizontal movements separately.
Following artifact rejection and EOG correction procedures, individual participant averages were computed for each stimulus type (angry, happy, neutral). An individual participant's data were used if there was a minimum of seven artifact-free trials for each stimulus type during which they attended to the stimulus. There is no “hard” standard in the electrophysiology literature for an acceptable minimum number of artifact-free trials in ERP studies. However, in ERP research with infants and young children, the minimum number of trials comprising an average is generally lower than in adult studies due to the increased likelihood of younger participants to be restless, nonattentive, sleepy, and/or irritable during data collection. A sampling of published ERP studies of infants and young children from a number of labs indicated a fairly narrow range of minimum acceptable artifact-free trials, from 5 (e.g., deRegnier, Georgieff, & Nelson, 1997, in a study of 4-month-olds) to 15 (e.g., de Haan, Belsky, Reid, Volein, & Johnson, 2004), with many other studies falling somewhere in between these numbers. Careful inspection of our data, in particular averages for those children consisting of 5–10 trials, indicated that the signal to noise (S/N) ratio was adequate for those averages containing seven or more trials, whereas the S/N ratio of those with fewer than seven trials was too low. Subsequently, a grand average for each condition and group was computed (see Figures 1, 2, and 3).

Grand means of ERPs exhibited by the maltreated group (black line) and the nonmaltreated group (grey line) while viewing angry faces. The y axis represents amplitude (μV) and the x axis represents latency (ms).

Grand means of ERPs exhibited by the maltreated group (black line) and the nonmaltreated group (grey line) while viewing happy faces. The y axis represents amplitude (μV) and the x axis represents latency (ms).

Grand means of ERPs exhibited by the maltreated group (black line) and the nonmaltreated group (grey line) while viewing neutral faces. The y axis represents amplitude (μV) and the x axis represents latency (ms).
Across all participants with complete data, there were an average of 14.6 (SD = 3.0, range = 7–20) trials included in the averages for the angry condition, 13.8 (SD = 3.0, range = 8–20) trials in the averages for the happy condition, and 64.3 (SD = 14.1, range = 26–88) for the neutral condition. There were no statistically significant differences between the maltreating and nonmaltreating groups on the number of trials included in the averages within each condition.
Based on inspection of individual subjects' averages for each of the three conditions as well as the grand averages, we identified four ERP components. The first of these was an early negative component within a time window of 90–200 ms. This waveform had its maximum amplitude at frontal and central electrode sites with a peak latency of approximately 150 ms, and thus is referred to as N150. The second waveform, identified within a time window of 200–400 ms, was a relatively early positive component with maximum amplitude occurring generally at central electrode sites with a peak latency of approximately 260 ms, thus is referred to as P260. The third waveform was identified within a time window of 400–600 ms. This was a prominent negative component with maximum amplitude at central electrode sites and a peak latency of approximately 450 ms, and it is believed to be the ubiquitous Nc waveform commonly observed in ERP studies of facial recognition in infants and children. Finally, a relatively long latency, positive component (PSW) was identified between 900 and 1750 ms.
Peak amplitude relative to the 200-ms baseline and latency to peaks were determined using an automated computer algorithm within the first three time windows. Area scores relative to baseline (rectified) were computed for the PSW within the fourth time window, using an algorithm that estimates area by computing the product of the sampling interval and the sum of all points in the interval (except the two endpoints, which are given one-half weight). Individual averages for each scalp electrode were hand edited after peak amplitude and latency were determined for the N150, P260, and Nc waveforms to ensure that none of the automatically detected peaks occurred on the edge of the waveforms.
Assessment of infant development
The Mental Scale of The Bayley Scales of Infant Development, 2nd edition (BSID-II; Bayley, 1993) was administered to all participants in the current study prior to the ERP lab visit to assess current level of cognitive, language, and personal–social development. The Mental Scale of the BSID-II provides a global measure of intellectual development, and measures cognitive functions such as memory, learning, problem-solving ability, as well as verbal communication skills. A score on the Mental Development Index (MDI) for each participant was derived from this measure, and employed as a statistical covariate in the analyses of the ERP data. Although there was not a statistically significant difference between the maltreated and nonmaltreated groups on this index, there was a very wide range of scores within both groups (see Table 1). Even small individual differences in mental age (as indexed by the MDI) could potentially be correlated with individual differences in latency and/or amplitude of ERP waveforms; thus, MDI scores were employed as a covariate to ensure precise matching of cognitive development and mental age between the two groups.
Procedure
All children were determined to be in good health and free of any medications at the time of the EEG laboratory visit. After all electrodes were put in place and impedances were determined to be acceptable, all infants were seated on their mother's lap in a darkened, sound attenuated room. During data collection, a research assistant observed the child's behavior on a video monitor in the control room, and experimental stimuli were presented whenever the child was deemed to be paying attention to the monitor in the subject booth. If the child was not attending, then the mother was instructed, over an intercom system, to attempt to direct the child's attention to the computer monitor in the booth. During periods when the child was not attending to stimuli, a white box was presented on the monitor. Occasionally, a bulls eye pattern was presented on the computer monitor in conjunction with a rattle sound if the observer thought the child's attention could be redirected back to the screen without enlisting the assistance of the mother. Each of these experimenter initiated events was marked on the continuous EEG recording as they occurred. If the infant became distracted or fussy to the extent that they were not able to pay attention to the stimuli, then the experimental session was terminated. Parents were reimbursed for travel expenses and their time, and children were given a small toy after the experimental session.
Results
For the N150, P260, and Nc ERP components, repeated-measures analyses of variance (ANOVAs) were computed, one using peak amplitude as the dependent variable and the other employing peak latency as the dependent variable. For the PSW component, repeated-measures ANOVA also was employed, using the rectified area scores under the waveform. All statistical analyses were computed using the Statistical Package for the Social Sciences for Windows, Version 12. Following from Vasey and Thayer (1987), all p values were corrected for sphericity using the Greenhouse–Geisser procedure when epsilon was less than 0.90. Chronological age and individuals' scores on the Bayley MDI (Bayley, 1993) were employed as covariates in all analyses.
Two sets of ANOVAs were computed for N150, P260, and Nc average peak amplitudes and latencies and PSW average area scores, as dependent variables. The first was for the midline electrode sites (Fz, Cz, and Pz), with midline region (frontal, central, parietal) and emotion (angry, happy, neutral) as within-subjects factors and group (maltreating, nonmaltreating) as a between-subjects factor. The second set of ANOVAs was computed for lateral electrode sites, with region (frontal, central, parietal, and temporal), hemisphere (left, right), and emotion (angry, happy, neutral) as within-subjects factors, and group (maltreating, nonmaltreating) as a between-groups factor. Frontal and temporal lateral regions each consisted of two electrodes per hemisphere (e.g., left frontal included F7 and F3, right temporal included T4 and T6), which were averaged together to yield a mean regional amplitude and latency, whereas each hemisphere of central and parietal regions consisted of one electrode. Because occipital electrode sites typically do not exhibit evidence of emotion discrimination, data from these leads were not included in the analyses.
N150
Midline electrode sites
Amplitude
There were no statistically significant between- or within-subjects effects across the midline electrode sites for the amplitude of the N150.
Latency
There was a statistically significant Region × Emotion interaction of N150 latency for the midline electrode sites, F (4, 55) = 2.74, p < .05, ηp2 = 0.048. Across both hemispheres and groups, there were shorter latencies for neutral faces at Cz than at either Fz or Pz, and longer latencies for angry faces at Pz than at either Fz or Cz.
Lateral electrode sites
Amplitude
There was a main effect for Emotion that approached statistical significance, F (2, 57) = 2.60, p < .10, ηp2 = 0.045, with amplitude of the N150 greater while viewing angry faces than neutral. This effect was qualified by a Region × Emotion interaction that also approached statistical significance, F (6, 53) = 2.00, p < .10, ηp2 = 0.035, which indicated that the greater amplitude to angry faces was most pronounced in the frontal region.
Latency
There were no statistically significant between- or within-subjects effects across the midline electrode sites for latency of the N150.
P260
Midline electrode sites
Amplitude
There was a main effect of Emotion for the P260 amplitude of midline electrodes, F (2, 57) = 4.95, p < .05, ηp2 = 0.083. Post hoc paired comparisons indicated that, across all regions and both groups combined, the amplitude of the P260 was greater in response to viewing angry, t (1, 58) = 3.68, p < .01, and happy, t (1, 58) = 4.15, p < .001, faces relative to neutral. This effect was qualified by a statistically significant interaction of Region × Emotion × Group, F (4, 55) = 3.41, p < .05, ηp2 = 0.058 (see Figure 4). Selected post hoc comparisons indicated that P260 amplitude while viewing angry faces was greater at frontal electrode sites for children in the maltreated group than for those in the nonmaltreated group, F (1, 58) = 4.62, p < .05, ηp2 = 0.077. However, post hoc comparisons did not reveal any statistically significant within group differences for region or emotion.

Plots illustrating the Region × Emotion × Group interaction of the P260 component amplitude at midline electrode sites in the (a) maltreated group and (b) nonmaltreated group. For both plots, the mean amplitude (μV) is shown with the amplitude collapsed across hemispheres.
Latency
For latency of the P260 on midline electrodes, there also was a main effect of Emotion, F (2, 57) = 3.41, p < .05, ηp2 = 0.058. Post hoc comparisons indicated that, across both groups and all regions, latency of the P260 while viewing angry faces was longer than latencies for viewing happy and neutral faces, F (1, 58) = 4.62, p < .05, ηp2 = 0.067.
Lateral electrode sites
Amplitude
For the lateral electrode sites, there was a statistically significant main effect of Emotion, F (2, 57) = 4.19, p < .05, ηp2 = 0.071. Post hoc comparisons indicated that, across all regions and both groups, amplitude of the P260 was greater in response to viewing angry, t (1, 58) = 3.42, p < .01, and happy, t (1, 58) = 4.59, p < .001, faces relative to neutral. The main effect of Emotion was qualified by a statistically significant interaction of Region × Emotion × Group, F (4, 55) = 3.07, p < .05, ηp2 = 0.053, as illustrated in Figure 5. Selected post hoc comparisons indicated that P260 amplitude while viewing angry faces was greater at frontal electrode sites for children in the maltreated group than for those in the nonmaltreated group, F (1, 58) = 5.22, p < .05, ηp2 = 0.087. In addition, post hoc comparisons within groups revealed that for the comparison group, P260 amplitude at frontal sites was greater for happy than for angry, t (1, 23) = 2.41, p < .05, as well as greater for happy compared to neutral, t (1, 23) = 2.14, p < .05. However, within the maltreated group, there was no difference in P260 amplitude between happy and angry at frontal electrode sites. The topographical map for P260 amplitude shown in Figure 6 also illustrates the between and within group differences across the three emotion conditions.

Plots illustrating the Region × Emotion × Group interaction of the P260 component amplitude at lateral electrode sites in the (a) maltreated group and (b) nonmaltreated group. For both plots, the mean amplitude (μV) is shown with the amplitude collapsed across hemispheres.

The topography of the P260 ERP component across the three emotion conditions for the maltreated and nonmaltreated groups. Each map is constructed based on the latency of the P260 peak at Fz (where P260 was maximal) from the grand average of that group and condition. Because of amplitude variations between groups and across emotions, the scales were adjusted separately for each condition to best illustrate the P260 component.
Latency
There was a main effect of Emotion that approached statistical significance, F (2, 57) = 2.69, p < .10, ηp2 = 0.047, indicating that across both groups and all regions, the latency of the P260 while viewing angry faces was longer than latencies while viewing happy and neutral faces.
Nc
Midline electrode sites
Amplitude
There was a main effect of Emotion for amplitude of the Nc at midline electrode sites that approached statistical significance, F (2, 57) = 2.35, p < .10, ηp2 = 0.041, indicating that, across all regions and both groups, the amplitude of the Nc was greater in response to viewing happy faces relative to neutral. This effect was qualified by a statistically significant interaction of Region × Emotion × Group, F (4, 55) = 3.06, p < .05, ηp2 = 0.053 (see Figure 7). Selected post hoc comparisons showed that within the maltreated group, while viewing angry faces, Nc amplitude was greater at Cz than at Fz, t (1, 34) = 2.73, p < .05, and Pz, t (1, 34) = 3.16, p < .01. However, within the comparison group, there were no differences in Nc amplitude across electrode sites while viewing angry faces.

Plots illustrating the Region × Emotion × Group interaction of the Nc component amplitude at midline electrode sites in the (a) maltreated group and (b) nonmaltreated group. For both plots, the mean amplitude (absolute value, μV) is shown with the amplitude collapsed across hemispheres.
Latency
There were no statistically significant between- or within-subjects effects across the midline electrode sites for latency of the Nc.
Lateral electrode sites
Amplitude
For the lateral electrode sites, there was also a statistically significant interaction of Region × Emotion × Group, F (6, 53) = 2.69, p < .05, ηp2 = 0.047, illustrated in Figure 8. Post hoc comparisons did not show statistically significant differences between groups for this interaction on Nc amplitude. However, selected post hoc comparisons within the comparison group showed that at parietal sites, Nc amplitude while viewing happy faces was greater than that for angry, t (1, 23) = 2.21, p < .05, and neutral, t (1, 23) = 2.12, p < .05, faces. Similarly, at temporal sites, Nc amplitude while viewing happy faces was greater than that while viewing neutral faces, t (1, 23) = 2.48, p < .05. In contrast, within the maltreated group there were no emotion linked Nc amplitude differences between happy and angry at any electrode sites. The topographical map in Figure 9 further illustrates the increased Nc amplitude in the nonmaltreated group while viewing happy faces, and the lack of Nc amplitude differentiation between emotion conditions in the maltreated group.

Plots illustrating the Region × Emotion × Group interaction of the Nc component amplitude at lateral electrode sites in the (a) maltreated group and (b) nonmaltreated group. For both plots, the mean amplitude (absolute value, μV) is shown with the amplitude collapsed across hemispheres.

The topography of the Nc ERP component across the three emotion conditions for the maltreated and nonmaltreated groups. Each map is constructed based on the latency of the Nc peak at Cz (where Nc was maximal) from the grand average of that group and condition. Because of amplitude variations between groups and across emotions, the scales were adjusted separately for each condition to best illustrate the Nc component.
Latency
There were no statistically significant between- or within-subjects effects across the lateral electrode sites for latency of the Nc.
PSW
Midline electrode sites
For the midline electrodes, there was a statistically significant main effect of Region, F (2, 57) = 8.32, p < .01, ηp2 = 0.131, for the PSW area score. Post hoc analyses indicated that the area score for the PSW, across both groups and all emotions, was greater at Fz and Cz than at Pz, F (1, 58) = 9.64, p < .01.
Lateral electrode sites
For the lateral electrode sites, there was a statistically significant main effect of Region, F (3, 56) = 3.86, p < .05, ηp2 = 0.049. Post hoc analyses revealed that there were greater area scores for frontal and central electrode sites than for parietal and temporal sites, across both groups and all emotions. Post hoc analyses indicated that the area score for the PSW, across both groups and all emotions, was greater at Fz and Cz than at Pz, F (1, 58) = 4.76, p < .05. There was also a main effect for Emotion that approached statistical significance, F (2, 57) = 2.66, p < .10, ηp2 = 0.046. This effect indicated that, across groups and regions, the PSW area score was greater in response to viewing angry and happy faces relative to that elicited by neutral faces. Further, there was a statistically significant interaction of Hemisphere × Emotion × Group, F (2, 57) = 3.77, p < .05, ηp2 = 0.064, shown in Figure 10. Post hoc analyses indicated, approaching the level of statistical significance, that the nonmaltreated group exhibited greater PSW area scores in the right hemisphere while viewing angry faces relative to the maltreated group, F (1, 58) = 3.34, p < .10, ηp2 = 0.057. However, further post hoc analyses did not reveal any statistically significant differences between or within the groups.

Plots illustrating the Hemisphere × Emotion × Group interaction of the PSW at lateral electrode sites in the (a) maltreated group and (b) nonmaltreated group. The mean area score is plotted in standard units, with the area score collapsed across electrode sites.
Discussion
The present investigation was conducted to examine the effect of early childhood maltreatment on the neural correlates of processing emotion stimuli. This study represents the first investigation of the impact of child maltreatment occurring in the first year of life on the neural correlates of facial emotion recognition in toddlerhood.
Consistent with our expectations, no between-group differences were obtained in either the latency or amplitude of the N150 ERP component. However, the specific functional correlates of this waveform in 30-month-olds is unclear. Parker et al. (2005a, 2005b) in a sample of youngsters 7–32 months of age, report an early negative ERP waveform (N170) with a very similar morphology and latency to the one observed in the current study. It is quite likely that their N170 is equivalent to the N150 waveform obtained in the present investigation, in particular, because the early negative component from Parker et al. (2005b) appears to be more prominent in the older group of children in their sample who ranged in age from 23.7 to 31.6 months. The mean age of our sample is slightly older than the mean age of Parker et al.'s (2005b) older group of children (approximately 31 vs. 27 months); this age difference may account for the slightly earlier peak latency found in the current sample.
Parker et al. (2005b) reported fairly substantial between-group differences on the N170 waveform, with the group of institutionalized children showing lower overall amplitude. This was interpreted as part of a pattern of results reflecting an overall maturational lag in nervous system development in the institutionalized children (Parker et al., 2005b). In contrast, however, there were no statistically significant between group differences on the amplitude of the N150 in the current study.
The functional significance of the N170 is reasonably well established in adults, and is believed to reflect processing related to the structural encoding of faces that occurs prior to face recognition, independent of familiarity and emotional expression (Bentin, Allison, Pruce, Perez, & McCarthy, 1996; Eimer, 2000a, 2000b; Eimer & Holmes, 2002). However, it is unclear what processes may be reflected in this early negative waveform seen in the current study and the Parker et al. (2005b) investigation. It appears unlikely that this component corresponds to the N170 seen in adult ERPs, given the strong experimental evidence indicating that the adult N170 does not reach the typical pattern until early adolescence (see Taylor, Batty, & Itier, 2004 for review). de Haan and colleagues (e.g., de Haan, Johnson, & Halit, 2003; de Haan, Pascalis, & Johnson, 2002) have discussed potential developmental precursors of the adult N170 in infant ERPs, in particular, focusing on the N290 waveform seen in their studies of infants between 3 and 12 months of age. However, there is currently little or no ERP data on face processing in children between 12 and 48 months of age indicating the specific developmental trajectory of this waveform, with one study of 4-year-olds showing an N170-like component at a mean latency of 270 ms (Taylor, McCarthy, Saliba, & Degiovanni, 1999). However, the peak latency of the N150 waveform found in the current study was far earlier, thus making it unlikely to correspond with the waveform found by Taylor et al. (1999).
Regardless of the specific functional significance of this early negativity in young children, this early negative component occurs so soon after the presentation of the stimulus that it most likely reflects early perceptual processing of a stimulus, and thus is unlikely to represent processing of facial affect. Thus, the current findings suggest that there are no differential early perceptual processing effects for face stimuli between maltreated and nonmaltreated youngsters. It is therefore conceivable to infer that early maltreatment may not have an impact on perceptual processes occurring in toddlerhood. However, it remains unclear as to why there would be substantial group differences in this waveform in the Parker et al. (2005b) Romanian study and no group differences between maltreated and nonmaltreated toddlers examined in the current investigation. One plausible explanation is that the adversity experienced by the maltreated toddlers in the current sample was not as extensive as that experienced by the institutionalized Romanian children in the Parker et al. (2005b) study. Even Parker and Nelson did not specify the exact phenomenology of the deprivation experienced by the Romanian institutionalized children, it is likely that the deprivation experienced by these children was far greater than that encountered in the current maltreated sample. Despite the fact that it appears that the experience of maltreatment in the current sample did not alter basic early perceptual processes in recognition of facial affect, the severe and pervasive deprivation experienced by institutionalized Romanian children appears to have impacted these processes.
Although there were no between-group differences in latency, at both the middle and lateral regions at frontal electrode sites, the maltreated toddlers exhibited a greater P260 amplitude while viewing angry faces than did the nonmaltreated comparison children. Few, if any studies of facial affect recognition report this relatively early positive ERP component. In a study of 7-month-olds' processing of facial expressions of emotion, Nelson and de Haan (1996) report an early positive component with peak amplitude occurring over parietal and central regions with a mean peak latency of approximately 275 ms over midline leads. In particular, this component was found to be sensitive to facial affect, and had larger peak amplitude in response to infants' viewing of a happy face compared to viewing a fearful face. However, in the same study, this early positive component did not distinguish between infants' viewing of two negative emotions, anger and fear. In addition, in their ERP studies of facial affect and maltreatment in a sample of school age children, Pollak and colleagues (Pollak et al., 1997, 2001) reported finding an early positive component at a mean latency of approximately 200 ms. However, these investigators did not advance any specific hypotheses concerning this waveform, and thus did not analyze its potential relation to processing of facial affect and maltreatment.
Although it is impossible to determine whether the early positive components found by Nelson and de Haan (1996) or by Pollak et al. (1997, 2001) are analogous to the P260 observed in the current study, it is of particular interest that the relatively early positive component observed by Nelson and de Haan (1996) was sensitive to facial expression of emotion. However, the relative lack of findings concerning this waveform in the ERP literature has precluded a definitive interpretation concerning its functional significance. Nonetheless, this was a prominent feature in the ERP data in the current study, as well as in the waveforms obtained by Parker et al. (2005a, 2005b) in their study of Romanian youngsters of approximately the same age (these authors reported a wave they termed P250, which was highly similar in amplitude, morphology, and latency, although with a peak latency 10 ms earlier than found in the present study). Given this early processing component's apparent sensitivity to facial affect, the P260 may represent a later perceptual process that includes recognition of the affective component of a face.
The results concerning the P260 waveform from the current study are to some extent consistent with our hypotheses. For the P260, there was a main effect of emotion, indicating an overall greater P260 amplitude in response to viewing the angry and happy emotion faces relative to neutral. This finding suggests that the P260 may reflect discrimination of faces with expressions of emotion from those with no emotional expression.
However, the primary finding concerning the P260 involved an interaction of region, emotion, and group. Figure 6 illustrates this finding, indicating very similar topographical distribution of this waveform for both groups in response to viewing both happy and neutral facial expressions. In response to viewing angry facial expressions, the P260 attains maximum amplitude at frontal electrode sites for the maltreated children, but has maximum amplitude at more central electrode sites for the nonmaltreated comparison children. Figure 11 further illustrates the difference in the scalp distribution of this waveform between the two groups, and shows the regional difference in the topography of the P260 during 100 ms that the P260 was most prominent while viewing faces with an angry expression.

The topography of the P260 ERP component in response to the viewing angry facial affect across 100 ms for the maltreated and nonmaltreated groups. The maps are at 20-ms intervals from 210 to 310 ms, 50 ms before and after the peak latency of the waveform, based on the peak at Fz (where P260 was maximal) from the grand average of that group.
It is difficult to definitively interpret this result given the lack of information concerning the specific functional significance of this particular waveform. Parker et al. (2005b) reported that the P250 from their ERP study distinguished not only younger from older children, but also reported main effects for both region and group, as well as an interaction between region, emotion, and group. Their results indicated that, for midline electrode sites, the never institutionalized children had greater P250 amplitude in response to fearful versus sad facial expressions in the frontal region, whereas the institutionalized group had greater P250 amplitude in response to viewing happy and sad facial expressions relative to the anger expression, as well as in the frontal region. However, Parker et al. (2005b) concluded that the emotion-based group differences in the P250 in their study were a residual effect of differences found in the preceding N170 waveform.
In the current study, given that there were virtually no effects related to the N150, the effects found for the P260 could be interpreted as reflecting actual underlying neurofunctional processes. However, the difference in topographical distribution of the P260 between the maltreated and nonmaltreated groups, without an overall difference in amplitude, adds some difficulty in interpreting the finding. Consistent with the hypothesis that the P260 represents a relatively late perceptual process that includes the basic identification of facial expressions of emotion, the findings from the current study may be indicative of the impact of maltreatment on neurofunctional processes underlying the detection of facial expressions of emotion, in particular, the identification of anger in the maltreated children. For maltreated children, detecting anger in the face of a caregiver would be of particular relevance, and may be associated with threat. In addition, maltreated children may either have a greater familiarity with angry faces, and/or anger in a facial expression may certainly be of increased relevance or salience. The current findings may reflect that maltreated children are as familiar with angry facial expressions as they are with happy or neutral expressions, whereas the shifting of the P260 in the nonmaltreated children may reflect a response to the angry facial expression as though it were more novel, threatening, and/or unfamiliar.
Although the overall amplitude of the P260 is equivalent between the maltreated and nonmaltreated groups, the topography of the waveform in response to viewing angry facial expressions is the critical feature distinguishing these two groups. As can be seen in Figure 6, the scalp distribution of the P260 of the maltreated children at the frontal electrodes in the angry condition is similar to the distribution of this waveform in response to viewing both happy and neutral faces in both groups. However, the scalp topography of the P260 over more central and parietal regions in the nonmaltreated comparison children while viewing angry facial expressions is the critical between group difference (see Figure 6). This may argue for the P260 underlying the detection of more novel (or less frequently experienced) facial expressions (i.e., angry faces for the nonmaltreated children). However, the functional role of this shifting of the P260 to more central regions, as well as the mechanisms by which this topographical difference may be induced by the experience of maltreatment, are unclear.
The finding of an increased amplitude to angry stimuli follows a similar pattern to that obtained by Pollak and colleagues in their ERP investigations of school-age maltreated children (Pollak et al., 1997, 2001). These investigators found that maltreated children had a larger amplitude of a P300-like waveform in response to angry faces compared to happy faces. Although it is unlikely that the P260 waveform found in the current study is functionally or morphologically related to the later positive waveforms reported by Pollak et al. (1997, 2001), it is interesting to note the similarity, if only for frontal electrodes (Pollak and colleagues did not find any regional effects), of the hyperresponsiveness to angry facial expressions by the maltreated compared to the nonmaltreated toddlers. This may reflect a general hyperactivation elicited by angry facial expressions in children who have experienced maltreatment, reflecting an increased familiarity with this particular affect.
In addition to the between-group effects found for the P260, for lateral electrode sites, within the nonmaltreated group, P260 amplitude was larger in response to viewing happy faces compared to both angry and neutral faces. Within the maltreated group, however, the P260 amplitude was comparable for angry and happy faces at the lateral electrode sites. This within-group difference in P260 amplitude may suggest that happy faces are either more familiar and/or more relevant/salient for nonmaltreated toddlers. Furthermore, because there were no differences in the ERP amplitude of maltreated youngsters to angry and happy faces at lateral sites, it is conceivable that the experience of maltreatment might diminish the ability of these youngsters to differentiate emotion.
There were no statistically significant between-group differences in latency or amplitude of the Nc ERP component. However, within the maltreated group at the midline electrodes, the Nc amplitude was greater at Cz than at Fz or Pz when children were looking at angry faces compared to viewing happy or neutral facial expressions. There were no within-group differences at the middle electrodes within the nonmaltreated comparison group. These results may indicate that maltreated children were allocating more attention to angry faces.
In addition, at the lateral electrode sites, within the nonmaltreated group, a greater Nc amplitude was exhibited to happy than to angry faces at parietal electrode sites. In contrast, no differences were found in Nc amplitude in response to viewing happy versus angry faces in the maltreated group. As was the case with maltreated children's lack of a differential ERP amplitude at P260 to happy versus angry faces at lateral sites, the absence of an ERP amplitude difference at Nc to these emotional stimuli at the lateral sites may suggest that maltreatment experiences impair these youngsters' ability to recognize emotion.
The Nc is one of the most well-studied ERP components in infants and children, and appears to be ubiquitous in its appearance in ERPs elicited by a variety of paradigms. Because of its sensitivity to stimulus probability, whereby it is of larger amplitude to infrequent compared to frequent events in oddball paradigms, its putative neurofunctional significance in infants and young children is believed to be a reflection of the allocation of attention to, or hyperarousal elicited by, a novel stimulus (Nelson, 1994; Richards, 2002). In addition, the Nc appears to reflect some aspects of recognition independent of stimulus probability, with greater amplitude of the Nc observed in response to familiar stimuli, which may reflect greater allocation of attention to the familiar (de Haan et al., 2003). For example, at 6 months of age, Nc is larger in response to viewing the mother's face than a stranger's face (e.g., de Haan & Nelson, 1997, 1999). Thus, there appears to be a fundamental contradiction concerning the functional significance of the Nc, with some paradigms (e.g., the oddball) eliciting greater Nc amplitude for novel stimuli, whereas other types of paradigms appear to elicit greater Nc amplitude in response to familiar stimuli. Carver et al. (2003) have recently demonstrated that this phenomenon may be dependent on aspects of brain development in concert with experience, with children younger than 24 months of age showing a larger Nc in response to mother's face compared to stranger's face, whereas children older than 45 months show the reverse pattern.
To be able to interpret the findings of the current study, it is necessary to clearly understand the functional nature of the Nc waveform. Unfortunately, the mean age of the children in our sample, 31 months, is in between the ages of the two groups studied by Carver et al. (2003), thus making it difficult to extrapolate from those findings. In addition, of course, the stimuli used in the current study were not mother–stranger faces, but were rather faces of unfamiliar models exhibiting emotion expressions. There were no statistically significant findings concerning the amplitude of Nc related to facial affect in the Parker et al. (2005b) study of Romanian children. Thus, it is difficult to compare the current findings with their results. However, it is likely that the pattern of results found for the Nc in the current investigation may reflect increased allocation of attention to a more familiar happy facial expression in the nonmaltreated group.
Finally, the nonmaltreated children exhibited an increased area of the PSW in the right hemisphere when looking at angry stimuli. Given that the PSW is thought to reflect memory updating of stimuli that are not completely encoded (e.g., Nelson & Monk, 2001), the current findings suggest that anger may be a less familiar stimulus for the nonmaltreated youngsters, and, as such, it requires more effort to be updated in memory. Because experience-dependent processes continue to operate during periods of exposure to trauma and aberrant emotional environments, children who incorporate pathological experiences may add neuropathological connections into their developing brains instead of functional neuronal connections (Black, Jones, Nelson, & Greenough, 1998; Courchesne, Chisum, & Townsend, 1994). Such early developmental abnormalities may lead to the development of aberrant neural circuitry and often compound themselves in relatively enduring forms of psychopathology (Cicchetti & Cannon, 1999).
A variety of theoretical constructs, such as schemas and working models, have been invoked as potential mechanisms by which individuals integrate relevant information with extant knowledge structures (Bowlby, 1969/1982; Bretherton, 1990). In concert with the prior findings of Pollak et al. (1997, 2001), the psychophysiological findings in the current investigation provide corroborative evidence for such developmental processes. The existence of representations that are activated by emotional stimuli provides additional support for the cognitive mechanisms thought to place maltreated youngsters at risk for developing insecure attachment relationships with their caregivers (Cicchetti, Toth, & Lynch, 1995; Cicchetti, Toth, & Rogosch, 2005; Crittenden, 1988).
There are some caveats that need to be considered when comparing the findings from the current study to those of other studies. In comparing the maltreated children in the current sample with the children from the Parker et al. (2005a, 2005b) studies, it is important to bear in mind the probable qualitative difference in the deprivation experienced by these two samples. It is most likely that the institutionalized children in the Romanian studies have experienced more pervasive deprivation in comparison to the maltreated children in the current sample.
In addition, there is a paucity of normative ERP studies on recognition of facial affect on children in the age range between 12 and 48 months. The bulk of the literature from Nelson and colleagues, and more recently de Haan and colleagues, has typically utilized infants from ages 4 to 12 months. Relatively little is known about the neural correlates of face processing in toddlers. The Parker et al. (2005a, 2005b) studies are among the few, in addition to the current investigation, to examine children in the toddler age range.
To more fully understand the developmental sequence of the neural correlates of facial expressions of emotion, it is imperative that normative longitudinal ERP studies be carried out beginning in early infancy and continuing through toddlerhood and early childhood. Such normative data would yield a wealth of understanding, and would also serve to inform studies of children who experience adversity early in life, such as maltreatment or severe deprivation. For example, without longitudinal data, it is impossible to compare the ERP waveforms found in the current study with those seen in Pollak et al. (1997, 2001). Clearly, the brain continues to develop across infancy and childhood, and may exhibit a cascade of effects in response to adverse social experience (Cicchetti & Curtis, in press; Cicchetti & Tucker, 1994; Thompson & Nelson, 2001).
Moreover, future studies of the consequences of early maltreatment on brain functioning should ideally include a larger number of children who have experienced physical abuse or sexual abuse. Of the maltreated group of children in the current sample, the vast majority (slightly more than 75%) had experienced neglect, whereas 14% experienced physical abuse, and approximately 9% were victims of sexual abuse. Thus, there were too few children who had experienced physical or sexual abuse to analyze these groups separately. In research with a maltreated population, it is difficult to access infants and toddlers who have experienced these more severe forms of maltreatment because such youngsters are typically placed in foster care. However, it would be important to be able to examine the possibly differential impact of physical and sexual abuse on brain development and functioning. It is likely that the experience of these more severe forms of maltreatment may have even more serious consequences for brain functioning than is the case with the experience of child neglect.
Furthermore, it is imperative that investigations of brain functioning in children who have experienced adversity inform prevention and intervention efforts. For example, results from the current study suggest that children who have experienced maltreatment during the first year of life, although not severe enough to be placed in foster care, still exhibit brain-based abnormalities in processing facial affect at 30 months of age. This finding argues for the importance of early preventive interventions with children who have experienced maltreatment early in life to prevent the potential cascade of effects this experience may have on brain development and functioning, as well as potential effects it may have on other biological systems.
The current results, as well as previous findings on school aged children by Pollak et al. (1997, 2001), suggest that such interventions might focus on something as basic as training in affect recognition. More intensive intervention efforts might attempt to change the salience and/or representation of emotion, with the current results pointing to the importance of anger. For example, an attachment intervention could focus on changing representations of cognitive and emotional processes, such as the intervention implemented by Toth, Maughan, Manly, Spagnola, and Cicchetti (2002). Toth et al. (2002) demonstrated that maltreated children's negative mental and emotional representations of themselves and of their caregivers could be altered through the provision of an attachment-theory informed intervention. Finally, it would be extremely interesting to include baseline and postintervention measures of ERPs to emotion stimuli in evaluations of treatment efficacy. There is growing evidence that efficacious intervention modifies not only maladaptive behavior, but also its cellular and physiological correlates (Kandel, 1999). Given that behavioral and representational changes have been shown to improve in attachment-informed interventions (Cicchetti et al., 2005; Toth et al., 2002), it is important to ascertain if ERPs, a manifestation of brain functioning, also would exhibit postintervention improvement (Cicchetti & Curtis, in press; Curtis & Cicchetti, 2003).
References
REFERENCES
American Psychiatric Association.
(1994).
Diagnostic and statistical manual of mental disorders
(4th ed.).
Washington, DC:
Author.
Barnett, A. J.
(1993).
Adult vicarious victims of child sexual abuse.
Sexual and Marital Therapy
8,
75–80.Google Scholar
Barnett, D.,
Manly, J. T., &
Cicchetti, D.
(1993).
Defining child maltreatment: The interface between policy and
research. In
D. Cicchetti &
S. L. Toth (Eds.),
Child abuse, child development and social policy (pp.
7–73).
Norwood, NJ:
Ablex.
Bayley, N.
(1993).
The Bayley scales of infant development
(2nd ed.).
San Antonio, TX:
The Psychological Corporation.
Bentin, S.,
Allison, T.,
Pruce, A.,
Perez, A., &
McCarthy, A.
(1996).
Electrophysiological studies of face perception in humans.
Journal of Cognitive Neuroscience
8,
551–565.Google Scholar
Bjorklund, D. F.
(1997).
The role of immaturity in human development.
Psychological Bulletin
122,
153–169.Google Scholar
Black, J.,
Jones, T. A.,
Nelson, C. A., &
Greenough, W. T.
(1998).
Neuronal plasticity and the developing brain. In
N. E. Alessi,
J. T. Coyle,
S. I. Harrison, &
S. Eth (Eds.),
Handbook of child and adolescent psychiatry (pp.
31–53).
New York:
Wiley.
Bowlby, J.
(1969/1982).
Attachment and loss
(Vol. 1).
New York:
Basic Books.
Bretherton, I.
(1990).
Open communication and internal working models: Their role in the
development of attachment relationships. In
R. Thompson (Ed.),
Nebraska symposium on motivation: Socioeconomic development
(Vol. 36, pp.
57–113).
Lincoln, NE:
University of Nebraska Press.
Camras, L. A.,
Grow, J. G., &
Ribordy, S.
(1983).
Recognition of emotional expression by abused children.
Journal of Clinical Child Psychology
12,
325–328.Google Scholar
Camras, L. A.,
Ribordy, S.,
Hill, J.,
Martino, S.,
Sachs, V.,
Spaccarelli, S., &
Stefani, R.
(1990).
Maternal facial behavior and the recognition and production of
emotional expression by maltreated and nonmaltreated children.
Developmental Psychology
26,
304–312.Google Scholar
Camras, L. A.,
Ribordy, S.,
Hill, J.,
Martino, S.,
Spaccarelli, S., &
Stefani, R.
(1988).
Recognition and posing of emotional expressions by abused children
and their mothers.
Developmental Psychology
24,
776–781.Google Scholar
Carver, L. J.,
Dawson, G.,
Panagiotides, H.,
Meltzoff, A. N.,
McPartland, J.,
Gray, J., &
Munson, J.
(2003).
Age-related differences in neural correlates of face recognition
during the toddler and preschool years.
Developmental Psychobiology
42,
148–159.Google Scholar
Cassidy, J.
(1994).
Emotion regulation: Influences of attachment relationships.
Monographs of the Society for Research in Child Development
59,
228–283.Google Scholar
Chugani, H. T.,
Behen, M. E.,
Muzik, O.,
Juhász, C.,
Nagy, F., &
Chugani, D.
(2001).
Local brain functional activity following early deprivation: A study
of postinstitutionalized Romanian orphans.
NeuroImage
14,
1290–1301.Google Scholar
Cicchetti, D.
(1990).
The organization and coherence of socioemotional, cognitive, and
representational development: Illustrations through a developmental
psychopathology perspective on Down syndrome and child
maltreatment. In
R. Thompson (Ed.),
Nebraska Symposium on Motivation: Socioemotional development
(Vol. 36, pp.
259–366).
Lincoln, NE:
University of Nebraska Press.
Cicchetti, D.
(2003).
Editorial: Experiments of nature: Contributions to developmental
theory.
Development and Psychopathology
15,
833–835.Google Scholar
Cicchetti, D.,
Ackerman, B., &
Izard, C.
(1995).
Emotions and emotion regulation in developmental
psychopathology.
Development and Psychopathology
7,
1–10.Google Scholar
Cicchetti, D., &
Barnett, D.
(1991).
Attachment organization in pre-school-aged maltreated
children.
Development and Psychopathology
3,
397–411.Google Scholar
Cicchetti, D., &
Cannon, T. D.
(1999).
Neurodevelopmental processes in the ontogenesis and epigenesis of
psychopathology.
Development and Psychopathology
11,
375–393.Google Scholar
Cicchetti, D., &
Curtis, W. J.
(in press).
The developing brain and neural plasticity: Implications for
normality, psychopathology, and resilience. In
D. Cicchetti &
D. Cohen (Eds.),
Developmental psychopathology: Developmental neuroscience
(2nd ed.,
Vol. 2).
New York:
Wiley.
Cicchetti, D., &
Izard, C. (Eds.).
(1995).
Emotions in developmental psychopathology.
Development and Psychopathology
7,
1–226.Google Scholar
Cicchetti, D., &
Schneider–Rosen, K.
(1984).
Theoretical and empirical considerations in the investigation of
the relationship between affect and cognition in atypical populations of
infants: Contributions to the formulation of an integrative theory of
development. In
C. Izard,
J. Kagan, &
R. Zajonc (Eds.),
Emotions, cognition, and behavior (pp.
366–406).
New York:
Cambridge University Press.
Cicchetti, D.,
Toth, S. L., &
Lynch, M.
(1995).
Bowlby's dream comes full circle: The application of attachment
theory to risk and psychopathology.
Advances in Clinical Child Psychology
17,
1–75.Google Scholar
Cicchetti, D.,
Toth, S. L., &
Rogosch, F. A.
(2005).
The efficacy of interventions for maltreated infants in fostering
secure attachment.
Unpublished manuscript.
Cicchetti, D., &
Tucker, D.
(1994).
Development and self-regulatory structures of the mind.
Development and Psychopathology
6,
533–549.Google Scholar
Cole, P. M.,
Martin, S. E., &
Dennis, T. A.
(2004).
Emotion regulation as a scientific construct: Methodological
challenges and directions for child development research.
Child Development
72,
317–333.Google Scholar
Courchesne, E.,
Chisum, H., &
Townsend, J.
(1994).
Neural activity-dependent brain changes in development: Implications
for psychopathology.
Development and Psychopathology
6,
697–722.Google Scholar
Courchesne, E.,
Ganz, L., &
Norcia, A. M.
(1981).
Event-related brain potentials to human faces in infants.
Child Development
52,
804–811.Google Scholar
Crittenden, P. M.
(1988).
Relationships at risk. In
J. Belsky &
T. Nezworski (Eds.),
Clinical implications of attachment theory (pp.
136–174).
Hillsdale, NJ:
Erlbaum.
Curtis, W. J., &
Cicchetti, D.
(2003).
Moving research on resilience into the 21st century: Theoretical and
methodological considerations in examining the biological contributors to
resilience.
Development and Psychopathology
15,
773–810.Google Scholar
Dawson, G.,
Carver, L.,
Meltzoff, A. N.,
Panagiotides, H.,
McPartland, J., &
Webb, S.
(2002).
Neural correlates of face and object recognition in young children
with autism spectrum disorder, developmental delay, and typical
development.
Child Development
73,
700–717.Google Scholar
de Haan, M.,
Belsky, J.,
Reid, V.,
Volein, A., &
Johnson, M. H.
(2004).
Maternal personality and infants' neural and visual
responsivity to facial expressions of emotion.
Journal of Child Psychology & Psychiatry
45,
1209–1218.Google Scholar
de Haan, M.,
Johnson, M. H., &
Halit, H.
(2003).
Development of face-sensitive event-related potentials during
infancy: A review.
International Journal of Psychophysiology
51,
45–58.Google Scholar
de Haan, M., &
Nelson, C. A.
(1997).
Recognition of the mother's face by six-month-old infants: A
neurobehavioral study.
Child Development
68,
187–210.Google Scholar
de Haan, M., &
Nelson, C. A.
(1999).
Brain activity differentiates face and object processing in
6-month-old infants.
Developmental Psychology
35,
1113–1121.Google Scholar
de Haan, M.,
Pascalis, O., &
Johnson, M. H.
(2002).
Specialization of neural mechanisms underlying face recognition in
human infants.
Journal of Cognitive Neuroscience
14,
199–209.Google Scholar
deRegnier, R.-A. O.,
Georgieff, M. K., &
Nelson, C. A.
(1997).
Visual event-related brain potentials in 4-month-old infants at risk
for neurodevelopmental impairments.
Developmental Psychobiology
30,
11–28.Google Scholar
Dodge, K. A.,
Pettit, G. S., &
Bates, J. E.
(1990).
Mechanisms in the cycle of violence.
Science
250,
1678–1683.Google Scholar
Donchin, E.,
Karis, D.,
Bashore, T. R.,
Coles, M. G. H., &
Gratton, G.
(1986).
Cognitive psychophysiology and human information processing.
In
M. G. H. Coles,
E. Donchin, &
S. W. Porges (Eds.),
Psychophysiology (pp.
244–267).
New York:
Guilford Press.
Eimer, M.
(2000a).
The face-specific N170 component reflects late stages in the
structural encoding of faces.
NeuroReport
11,
2319–2324.Google Scholar
Eimer, M.
(2000b).
Event-related brain potentials distinguish processing stages
involved in face perception and recognition.
Clinical Neurophysiology
111,
694–705.Google Scholar
Eimer, M., &
Holmes, A.
(2002).
An ERP study on the time course of emotional face processing.
NeuroReport
13,
427–431.Google Scholar
Ekman, P.
(1976).
Pictures of facial affect.
Palo Alto, CA:
Consulting Psychologists Press.
Gauthier, I., &
Nelson, C. A.
(2001).
The development of face expertise.
Current Opinion in Neurobiology
11,
219–224.Google Scholar
Gratton, G.,
Coles, M. G. H., &
Donchin, E.
(1983).
A new method for off-line removal of ocular artifact.
Electroencephalography and Clinical Neurophysiology
55,
468–484.Google Scholar
Hesse, P., &
Cicchetti, D.
(1982).
Perspectives on an integrative theory of emotional
development.
New Directions for Child Development
16,
3–48.Google Scholar
Hillyard, S. A., &
Picton, T. W.
(1987).
Electrophysiology of cognition. In
V. Mountcastle (Ed.),
Handbook of physiology: Higher functions of the brain
(Vol. 5, pp.
519–583).
Bethesda, MD:
American Physiological Society.
Huttenlocher, P.
(2002).
Neural plasticity: The effects of environment on the development of
the cerebral cortex.
Cambridge, MA:
Harvard University Press.
Izard, C. E., &
Harris, P.
(1995).
Emotional development and developmental psychopathology. In
D. Cicchetti &
D. J. Cohen (Eds.),
Developmental psychopathology: Theory and methods
(Vol. 1, pp.
467–503).
New York:
Wiley.
Izard, C. E.,
Youngstrom, E. A.,
Fine, S. E.,
Mostow, A. J., &
Trentacosta, C. J.
(in press).
Emotions and developmental psychopathology. In
D. Cicchetti &
D. Cohen (Eds.),
Developmental psychopathology: Theory and methods
(2nd ed.,
Vol. 1).
New York:
Wiley.
Jasper, H. H.
(1958).
The 10–20 electrode system of the international
federation.
Electroencephalography and Clinical Neurophysiology
10,
371–375.Google Scholar
Kandel, E. R.
(1999).
Biology and the future of psychoanalysis: A new intellectual
framework for psychiatry revisited.
American Journal of Psychiatry
156,
505–524.Google Scholar
Lenneberg, E.
(1967).
Biological foundations of language.
New York:
Wiley.
Marshall, P. J., &
Fox, N. A.
(2004).
A comparison of the electroencephalogram between institutionalized
and community children in Romania.
Journal of Cognitive Neuroscience
16,
1327–1338.Google Scholar
Nelson, C. A.
(1987).
The recognition of facial expressions in the first two years of
life: Mechanisms of development.
Child Development
58,
889–909.Google Scholar
Nelson, C. A.
(1994).
Neural correlates of recognition memory in the first postnatal year
of life. In
G. Dawson &
K. Fischer (Eds.),
Human development and the developing brain (pp.
269–313).
New York:
Guilford Press.
Nelson, C. A., &
Collins, P. F.
(1991).
Event-related potential and looking-time analysis of infants'
responses to familiar and novel event: Implications for visual recognition
memory.
Developmental Psychology
27,
50–58.Google Scholar
Nelson, C. A., &
de Haan, M.
(1996).
Neural correlates of infants' visual responsiveness to facial
expressions of emotion.
Developmental Psychobiology
29,
577–595.Google Scholar
Nelson, C. A., &
Monk, C. S.
(2001).
The use of event related potentials in the study of cognitive
development. In
C. A. Nelson &
M. Luciana (Eds.),
Handbook of developmental cognitive neuroscience (pp.
125–136).
Cambridge, MA:
Massachusetts Institute of Technology.
O'Connor, T. G.
(2003).
Natural experiments to study the effects of early experience:
Progress and limitations.
Development and Psychopathology
15,
837–852.Google Scholar
O'Connor, T. G.,
Bredenkamp, D., &
Rutter, M.
(1999).
Attachment disturbances and disorders in children exposed to early
severe deprivation.
Infant Mental Health Journal
20,
10–29.Google Scholar
O'Connor, T. G.,
Rutter, M.,
Beckett, C.,
Keaveney, L., &
Kreppner, J. M.
(2000).
The effects of global severe privation on cognitive competence:
Extension and longitudinal follow-up.
Child Development
71,
376–390.Google Scholar
Parker, S. W.,
Nelson, C. A., &
The Bucharest Early Intervention Core Group.
(2005a).
An event-related potential study of the impact of institutional
rearing on face recognition.
Development and Psychopathology
17,
621–639.Google Scholar
Parker, S. W.,
Nelson, C. A., &
The Bucharest Early Intervention Core Group.
(2005b).
The impact of early institutional rearing on the ability to
discriminate facial expressions of emotion: An event-related potential
study.
Child Development
76,
54–72.Google Scholar
Pollak, S. D.,
Cicchetti, D.,
Hornung, K., &
Reed, A.
(2000).
Recognizing emotion in faces: Developmental effects of child abuse
and neglect.
Developmental Psychology
36,
679–688.Google Scholar
Pollak, S. D.,
Cicchetti, D., &
Klorman, R.
(1998).
Stress, memory, and emotion: Developmental considerations from the
study of child maltreatment.
Development and Psychopathology
10,
811–828.Google Scholar
Pollak, S. D.,
Cicchetti, D.,
Klorman, R., &
Brumaghim, J.
(1997).
Cognitive brain event-related potentials and emotion processing in
maltreated children.
Child Development
68,
773–787.Google Scholar
Pollak, S. D., &
Kistler, D.
(2002).
Early experience alters categorical representations for facial
expressions of emotion.
Proceedings of the National Academy of Sciences of the United States
of America
99,
9072–9076.Google Scholar
Pollak, S. D.,
Klorman, R.,
Thatcher, J. E., &
Cicchetti, D.
(2001).
P3b reflects maltreated children's reactions to facial displays
of emotion.
Psychophysiology
38,
267–274.Google Scholar
Pollak, S. D., &
Sinha, P.
(2002).
Effects of early experience on children's recognition of facial
displays of emotion.
Developmental Psychology
38,
784–791.Google Scholar
Pollak, S. D., &
Tolley–Schell, S. A.
(2003).
Selective attention to facial emotion in physically abused
children.
Journal of Abnormal Psychology
112,
323–338.Google Scholar
Richards, J. E.
(2002).
The development of visual attention and the brain. In
M. de Haan &
M. H. Johnson (Eds.),
The cognitive neuroscience of development (pp.
73–98).
Hove:
Psychology Press.
Rieder, C., &
Cicchetti, D.
(1989).
Organizational perspective on cognitive control functioning and
cognitive–affective balance in maltreated children.
Developmental Psychology
25,
382–393.Google Scholar
Rutter, M.,
Andersen–Wood, L.,
Beckett, C.,
Bredenkamp, D.,
Castle, J.,
Groothues, C.,
Kreppner, J.,
Keaveney, L.,
Lord, C., &
O'Connor, T. G.
(1999).
Quasi-autistic patterns following severe early global
privation.
Journal of Child Psychology and Psychiatry and Allied
Disciplines
40,
537–549.Google Scholar
Sroufe, L. A.
(1990).
Considering normal and abnormal together: The essence of
developmental psychopathology.
Development and Psychopathology
2,
335–347.Google Scholar
Sroufe, L. A.
(1996).
Emotional development: The organization of emotional life in the
early years.
New York:
Cambridge University Press.
Taylor, M. J.,
Batty, M., &
Itier, R. J.
(2004).
The faces of development: A review of early face processing over
childhood.
Journal of Cognitive Neuroscience
16,
1426–1442.Google Scholar
Taylor, M. J.,
McCarthy, G.,
Saliba, E., &
Degiovanni, E.
(1999).
ERP evidence of developmental changes in processing of faces.
Clinical Neurophysiology
110,
910–915.Google Scholar
Thompson, R. A., &
Nelson, C. A.
(2001).
Developmental science and the media: Early brain development.
American Psychologist
56,
5–15.Google Scholar
Toth, S. L.,
Maughan, A.,
Manly, J. T.,
Spagnola, M., &
Cicchetti, D.
(2002).
The relative efficacy of two interventions in altering maltreated
preschool children's representational models: Implications for
attachment theory.
Development and Psychopathology
14,
777–808.Google Scholar
Vasey, M. W., &
Thayer, J. F.
(1987).
The continuing problem of false positives in repeated measures ANOVA
in psychophysiology: A multivariate solution.
Psychophysiology
24,
479–486.Google Scholar
Walden, T. A., &
Field, T. M.
(1982).
Discrimination of facial expressions by preschool children.
Child Development
53,
1312–1319.Google Scholar
Weiss, P. A.
(1961).
Deformities as cues to understanding development of form.
Perspectives in Biology and Medicine
4,
133–151.Google Scholar
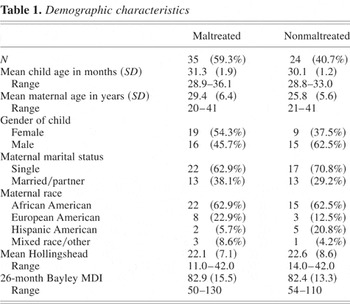
Demographic characteristics
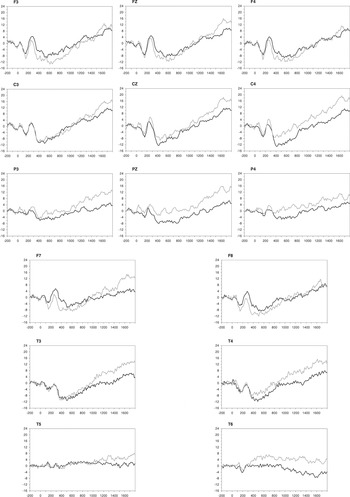
Grand means of ERPs exhibited by the maltreated group (black line) and the nonmaltreated group (grey line) while viewing angry faces. The y axis represents amplitude (μV) and the x axis represents latency (ms).
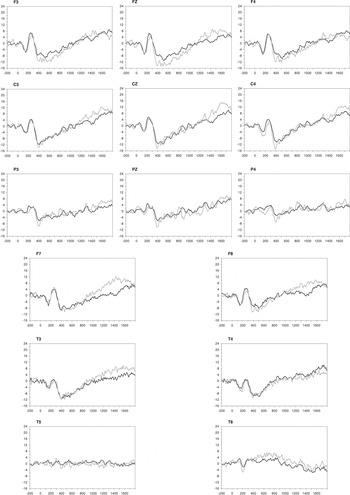
Grand means of ERPs exhibited by the maltreated group (black line) and the nonmaltreated group (grey line) while viewing happy faces. The y axis represents amplitude (μV) and the x axis represents latency (ms).
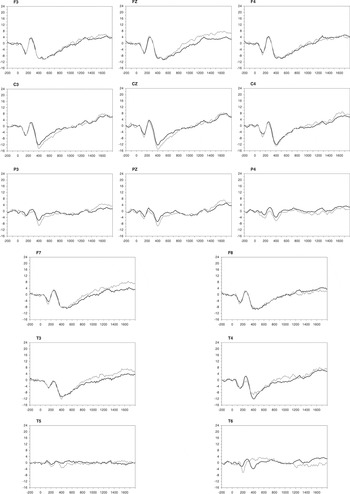
Grand means of ERPs exhibited by the maltreated group (black line) and the nonmaltreated group (grey line) while viewing neutral faces. The y axis represents amplitude (μV) and the x axis represents latency (ms).
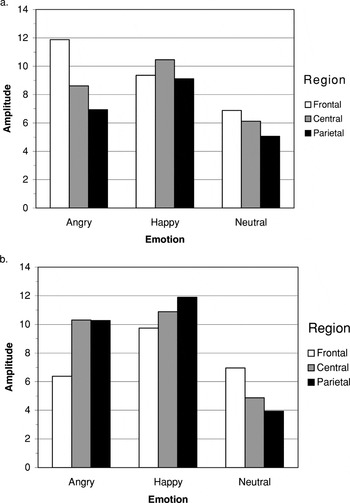
Plots illustrating the Region × Emotion × Group interaction of the P260 component amplitude at midline electrode sites in the (a) maltreated group and (b) nonmaltreated group. For both plots, the mean amplitude (μV) is shown with the amplitude collapsed across hemispheres.
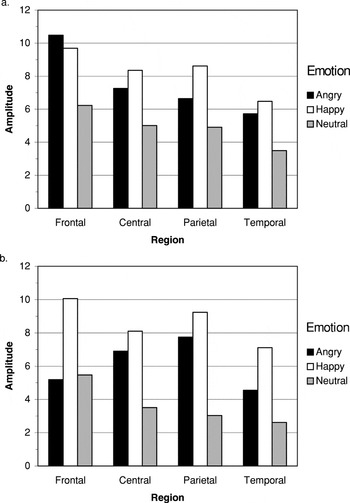
Plots illustrating the Region × Emotion × Group interaction of the P260 component amplitude at lateral electrode sites in the (a) maltreated group and (b) nonmaltreated group. For both plots, the mean amplitude (μV) is shown with the amplitude collapsed across hemispheres.
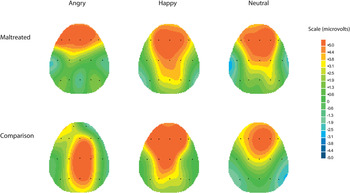
The topography of the P260 ERP component across the three emotion conditions for the maltreated and nonmaltreated groups. Each map is constructed based on the latency of the P260 peak at Fz (where P260 was maximal) from the grand average of that group and condition. Because of amplitude variations between groups and across emotions, the scales were adjusted separately for each condition to best illustrate the P260 component.
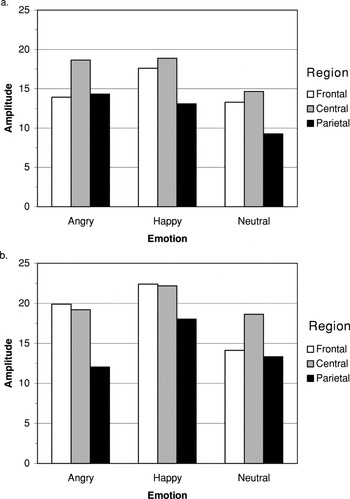
Plots illustrating the Region × Emotion × Group interaction of the Nc component amplitude at midline electrode sites in the (a) maltreated group and (b) nonmaltreated group. For both plots, the mean amplitude (absolute value, μV) is shown with the amplitude collapsed across hemispheres.
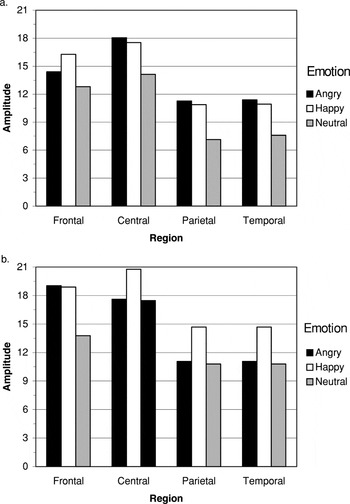
Plots illustrating the Region × Emotion × Group interaction of the Nc component amplitude at lateral electrode sites in the (a) maltreated group and (b) nonmaltreated group. For both plots, the mean amplitude (absolute value, μV) is shown with the amplitude collapsed across hemispheres.
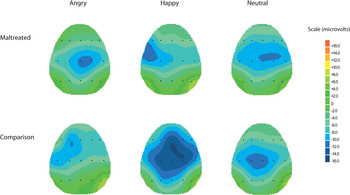
The topography of the Nc ERP component across the three emotion conditions for the maltreated and nonmaltreated groups. Each map is constructed based on the latency of the Nc peak at Cz (where Nc was maximal) from the grand average of that group and condition. Because of amplitude variations between groups and across emotions, the scales were adjusted separately for each condition to best illustrate the Nc component.
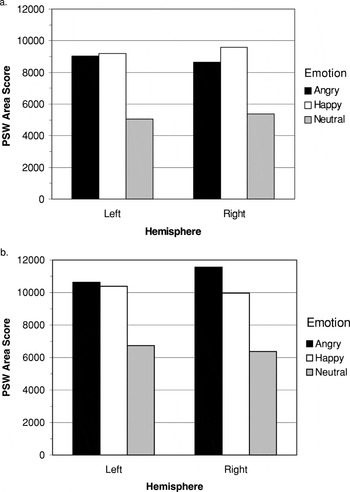
Plots illustrating the Hemisphere × Emotion × Group interaction of the PSW at lateral electrode sites in the (a) maltreated group and (b) nonmaltreated group. The mean area score is plotted in standard units, with the area score collapsed across electrode sites.
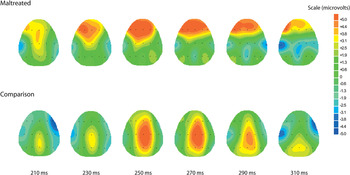
The topography of the P260 ERP component in response to the viewing angry facial affect across 100 ms for the maltreated and nonmaltreated groups. The maps are at 20-ms intervals from 210 to 310 ms, 50 ms before and after the peak latency of the waveform, based on the peak at Fz (where P260 was maximal) from the grand average of that group.
 You have
Access
- 91
- Cited by