Implications
Anthelmintic targeted selective treatment consists in treating only those animals that are the most infected or suffering the most from infections in a given group in order to leave untreated animals acting as refugia of unselected worms. We assessed a TST strategy based on below-average mid-grazing season weight gain in several groups of first grazing season dairy calves. At housing, growth as well as parasitological and clinical parameters were similar whether the treatment was applied selectively or on all the animals irrespective of the exposure/infection levels.
Introduction
Gastrointestinal nematode (GIN) infections are very common in grazing cattle in temperate regions. Among GIN species, Ostertagia ostertagi is the most pathogenic and is responsible for weight losses, or even diarrhea in naïve first grazing season cattle (FGSC) (Ploeger and Kloosterman, Reference Ploeger, Borgsteede, Sol, Mirck, Huyben, Kooyman and Eysker1993). To limit the GIN impact on FGSC growth, anthelmintic treatments are routinely administered to whole groups of calves. However, the combination of a widespread use of anthelmintics and of some grazing management measures lead to overprotective strategies in Europe (Charlier et al., Reference Charlier, Demeler, Höglund, von Samson-Himmelstjerna, Dorny and Vercruysse2010). Such reduced exposure to infective larvae may induce retardation in immunity development in calves (Ploeger et al., Reference Ploeger and Kloosterman1994) and cause subsequent decrease in milk production in young cows when they are highly exposed to GIN (Ravinet et al., Reference Ravinet, Bareille, Lehebel, Ponnau, Chartier and Chauvin2014). Moreover, increase in anthelmintic treatment number in both young and adult cattle exerts higher selection pressure on GIN populations and may result in the emergence of anthelmintic resistant worm populations (Demeler et al., Reference Demeler, Van Zeveren, Kleinschmidt, Vercruysse, Höglund, Koopman, Cabaret, Claerebout, Areskog and von Samson-Himmelstjerna2009; Geurden et al., Reference Geurden, Chartier, Fanke, di Regalbono, Traversa, von Samson-Himmelstjerna, Demeler, Vanimisetti, Bartram and Denwood2015). As far as Europe is concerned, low faecal egg count reductions following ivermectin or moxidectin treatment were seen in 10% to 60% of dairy cattle farms according to country (Germany, Italy, United Kingdom and France) (Geurden et al., Reference Geurden, Chartier, Fanke, di Regalbono, Traversa, von Samson-Himmelstjerna, Demeler, Vanimisetti, Bartram and Denwood2015). Thus, there is an urgent need to rationalize the use of anthelmintics through sustainable nematode control practices. Novel strategies developed in ruminants are based on keeping worms in refugia, that is maintaining a nematode population not exposed to anthelmintic in order to limit the selection pressure. Sources of refugia can be infective larvae on pastures when whole-group treatment (WT) is considered (targeted treatment) or worms in untreated animals when selective treatment is applied (targeted selective treatment (TST)) (Van Wyk et al., Reference Van Wyk, Hoste, Kaplan and Besier2006; Kenyon and Jackson, Reference Kenyon and Jackson2012; Charlier et al., Reference Charlier, van der Voort, Kenyon, Skuce and Vercruysse2014).
Targeted treatment is based on risk period identification when the pasture infectivity level can induce subclinical or clinical impact on FGSC. The risk period generally starts between 2 and 3 months after turnout (Ploeger et al., Reference Ploeger and Kloosterman1994; Shaw et al., Reference Shaw, Vercruysse, Claerebout, Agneessens and Dorny1997) and may extend until October in a temperate climate (Raynaud et al., Reference Raynaud, Bouchet, William, Leroy, Naudin and Brunault1976; Armour and Duncan, Reference Armour and Duncan1987). The risk depends on meteorological conditions and grazing management practices and thus is farm-specific.
Targeted selective treatment is based on the aggregated distribution of worms in the host population and its implementation relies on the ability to identify the less-resistant or the less-resilient animals to be treated (Kenyon et al., Reference Kenyon, Greer, Coles, Cringoli, Papadopoulos, Cabaret, Berrag, Varady, Van Wyk, Thomas, Vercruysse and Jackson2009). As far as FGSC are concerned, several parasitological (faecal egg count and serum pepsinogen level) and production (average daily weight gain (ADWG) and body condition score) parameters were studied as individual markers for TST (Costa et al., Reference Costa, Mejita, Martinez and Cabaret1989; Greer et al., Reference Greer, McAnulty and Gibbs2010; McAnulty et al., Reference McAnulty, Gibbs and Greer2011; Fahrenkrog, Reference Fahrenkrog2013; Höglund et al., Reference Höglund, Dahlström, Sollenberg and Hessle2013; O’Shaughnessy et al., Reference O’Shaughnessy, Earley, Mee, Doherty, Crosson, Barrett and de Waal2015). Faecal egg count could exhibit some limitation because discriminant values between animals might be observed only during a rather narrow period of time, that is 2 months after turnout (Shaw et al., Reference Shaw, Vercruysse, Claerebout and Dorny1998). The dosage of pepsinogen level suffers from standardization and reproducibility problems and interpretation at individual level is uncertain (Charlier et al., Reference Charlier, Dorny, Levecke, Demeler, von Samson-Himmerlstjerna, Höglund and Vercruysse2011). Höglund et al. (Reference Höglund, Dahlström, Sollenberg and Hessle2013) have shown that the body condition scoring does not seem sufficiently reliable to be used as a GIN infection marker. Finally, although not specific of GIN infection, variations in ADWG could represent a resilience indicator that could be conveniently assessed by farmers as a routine control in the production/reproduction management (target age for first calving). A targeted selective weight gain-based treatment for FSGC seems feasible 4 to 8 weeks after turnout because the ADWG measured at this period has been found to be a good predictor of the realized weight at housing (Höglund et al., Reference Höglund, Morrison, Charlier, Dimander and Larsson2009). As a result, ADWG can be used as a marker for treatment decision (Greer et al., Reference Greer, McAnulty and Gibbs2010; McAnulty et al., Reference McAnulty, Gibbs and Greer2011; Höglund et al., Reference Höglund, Dahlström, Sollenberg and Hessle2013). In these previous studies, a fixed or a flexible ADWG threshold taking into account several factors, such as the initial weight, age, breed or year variability was tested. Fixed thresholds may be questionable because system specific. On the other hand, the benefit of TST strategies in terms of reduction of the number of anthelmintic treatment was established in these previous surveys by comparison with regular WT. Specifically, the TST strategy was compared with highly suppressive treatment strategies (three times in the season or monthly) which are not commonly applied on the field. Consequently, the reduction in the number of anthelmintic treatments with the TST strategy was explicitly overestimated. Indeed, the actual median number of treatments administered per year to FGSC groups in Europe is one according to Charlier et al. (Reference Charlier, Demeler, Höglund, von Samson-Himmelstjerna, Dorny and Vercruysse2010). Furthermore, other limitations can be expressed from these previous works in terms of representativeness (simplified grazing management practices used as set-stocked grazing condition, limited number of groups involved) or field implementation (weekly/monthly monitoring of animals, cost of combining parasitological and production indicators).
Thus, it seems important to assess and compare the potential of TST strategies with usual control measures implemented by farmers, and in a large number of FGSC groups under different grazing management practices. In addition, the TST strategy should minimize the handling and restraining animals for the purposes of maximizing the chances of being accepted by the farmers (van Wyk et al., Reference Van Wyk, Hoste, Kaplan and Besier2006).
The objective of our study was to assess the suitability of a single pre-determined mid-season TST for GIN control, based on ADWG and using a flexible treatment threshold specific to each group of calves. The TST strategy was compared with a routine treatment strategy performed at the same time, that is a single WT. The hypothesis was that both strategies would not differ in terms of growth and parasitological parameters at the end of the grazing season.
Material and methods
Animals and treatment
The trial was conducted during the 2015 grazing season in 12 organic and 7 conventional dairy farms located in the Western, Central and Eastern regions of France. Western France is characterized by an oceanic climate and a low altitude (<300 m) above sea level, whereas Central and Eastern France are characterized by a continental climate (altitude range: 210 to 1855 m and 233 to 1363 m above sea level, respectively).
In each farm, one to two independent groups of FGSC were followed giving a total of 23 groups and 540 animals of several breeds (72% Holstein, 20% Normande, 6% Montbeliarde, 1% Jersey, 1% cross-bred). According to the groups, the age at first calving target varied from 24 to 36 months. At turnout, among groups, the mean age of FGSC varied from 5.5 to 16.3 months and the mean weights were between 148 and 308 kg.
Just before turnout, animals in each group of FGSC were weighed and allocated to one of two sub-groups balanced for age, weight and breed:
∙ one sub-group intended for a single mid-season WT; and
∙ the second one intended for a single mid-season TST based on a flexible ADWG measured for each group of calves.
Approximatively 3 months after turnout (range: 2.8 to 4.4), each animal in the WT sub-group was weighted and treated with an intramuscular injection of levamisole (Némisol®; Coophavet-Merial, Saint-Herblon, France) at a dose rate of 7.5 mg/kg. In each group of calves, the mean pre-treatment ADWG of animals in the WT sub-group was calculated and used as a flexible treatment threshold for TST sub-group. Then, animals in the TST sub-group were weighted, and the levamisole treatment was selectively administered to animals with a pre-treatment ADWG lower than the flexible treatment threshold.
WT and TST sub-groups of calves grazed together on the same pastures during the entire grazing season to ensure equal feeding resources and parasite larval challenge. On average, the grazing season lasted 7 months (range: 5 to 9 months) and the trial ended at housing from October to December depending on the groups. No other anthelmintic treatment was administered during the grazing season.
Weighing, sampling, clinical and parasitological parameters
All FGSC were weighed on three occasions: turnout, mid-season and housing. Individual clinical scoring and blood sampling were performed at housing. Breech soiling score (BSS) was visually determined and noted from 0 (no breech faecal soiling) to 1 (moderate soiled areas of faecal contamination: perineum and/or tailhead, and/or superficial gluteal region) or 2 (severe breech faecal soiling). Individual blood samples were taken in plain vacutainer tubes. Sera were collected and stored at −20°C until analysis. Individual serum pepsinogen concentrations were determined according to Kerboeuf et al. (Reference Kerboeuf, Koch, Le Dréan and Lacourt2002), and expressed as unit of tyrosine (U Tyr). Individual serum anti-O. ostertagi antibody levels were determined from sera diluted at 1/160 (J. Charlier, personal communication), following the SVANOVIR® O. ostertagi-Ab ELISA kit procedure (Svanova Biotech, Uppsala, Sweden). Results were expressed as optical density ratio (ODR) calculated as follows: ODR=(OD sample−OD negative control)/(OD positive control−OD negative control).
Evaluation of the level of exposure to gastrointestinal nematodes and of the level of abomasal damage due to Ostertagia in the 23 groups of calves
Average GIN exposure level for each group was estimated through the mean anti-O. ostertagi antibody levels (Ostertagia ODR) of untreated animals at housing. These animals were selected to assess the group exposure level because their contact with GIN was not hindered by any treatment during the grazing season. In the previous studies of Merlin et al. (Reference Merlin, Chauvin, Madouasse, Froger, Bareille and Chartier2016 and Reference Merlin, Chauvin, Madouasse, Lehebel, Brisseau, Bareille and Chartier2017), the effect of GIN infection on growth was significant in groups of calves with average Ostertagia ODR values ⩾0.7 at housing. Conversely, in groups characterized by average Ostertagia ODR values<0.7 at housing, no correlation was observed between growth and parasitism. On the basis of this threshold, the 23 groups were thus categorized into two classes, that is (i) the low exposed groups with mean Ostertagia ODR<0.7 at housing, for which the exposure was considered not high enough to induce weight losses and (ii) the high exposed groups with mean Ostertagia ODR⩾0.7 at housing, for which the exposure was considered high enough to induce weight losses.
Then, in the high exposed groups, the abomasal damages induced by Ostertagia infection were estimated through the mean pepsinogen level of untreated animals at housing (Eysker and Ploeger, Reference Eysker and Ploeger2000; Kerboeuf et al., Reference Kerboeuf, Koch, Le Dréan and Lacourt2002). Kerboeuf et al. (Reference Kerboeuf, Koch, Le Dréan and Lacourt2002) observed that groups exhibiting mean pepsinogen level ⩾2.5 U Tyr may suffer from Type I ostertagiasis. Based on this threshold, the high exposed groups were splitted into two classes, that is (i) the high exposed groups with housing mean pepsinogen level<2.5 U Tyr, and (ii) the high exposed groups with housing mean pepsinogen level ⩾2.5 U Tyr.
Statistical analysis of results
All data were analysed using R version 3.1.0 (R Core Team, 2013). α was set at 0.05.
Comparison of targeted selective treatment and whole-group treatment sub-groups within each group
Average pre- and post-treatment ADWG as well as parasitological and clinical parameters measured at housing were compared between TST and WT sub-groups in each group using a Mann–Whitney test.
Assessment of the treatment effect according to the level of exposure to gastrointestinal nematodes and to the level of abomasal damage
To validate the TST strategy taking into account the different exposure and abomasal damage classes, the evaluation of the treatment effect on post-treatment ADWG was done through a stratified analysis based on the level of exposure and on the level of abomasal damage.
For each of these levels, a linear mixed-effect model was built to investigate the effect of treatment on post-treatment ADWG according to two fixed factors at individual level: the pre-treatment ADWG (an adjustment factor divided into two classes according to treatment threshold: equal or above/under) and the variable under study, that is the treatment administration (yes/no), and the group (n=23), as a random effect.
The model had the following form:
 $$\left( {{\rm Post}{\minus}{\rm treatment}\,{\rm ADWG}} \right)_{{ij}} \,{\equals}\,\mu {\plus}X_{{ij}} \beta _{{ij}} {\plus}\alpha _{j} {\plus}{\epsilon}_{{ij}} $$
With:
 $$\alpha _{j} _{\,\sim\,} N\,\left( {0,\,\sigma ^{2} _{\alpha } } \right),\,{\epsilon}_{{ij{\rm }}}\sim\,N\,\left( {0,\,\sigma _{{\epsilon}}^{2} } \right)$$
where (post-treatment ADWG) ij is the post-treatment ADWG for heifer i, in group j; μ the average post-treatment ADWG after adjusting covariates, β ij the vector of coefficients for X ij , X ij individual variables described above and α j the group random effect. The random effect α j and the residual ε ij were assumed to be normally distributed with mean 0 and variance σ 2 α and σ 2 ε respectively.
Residuals and predicted values were plotted to evaluate their heteroscedasticity and their normality.
The P values for the fixed effects were calculated for the t-test based on Satterthwaite’s approximation for denominator degrees of freedom and the P values for the random effects were based on likelihood ratio test according to the package lmerTest of R (SAS Technical Report R-101, 1978).
Results
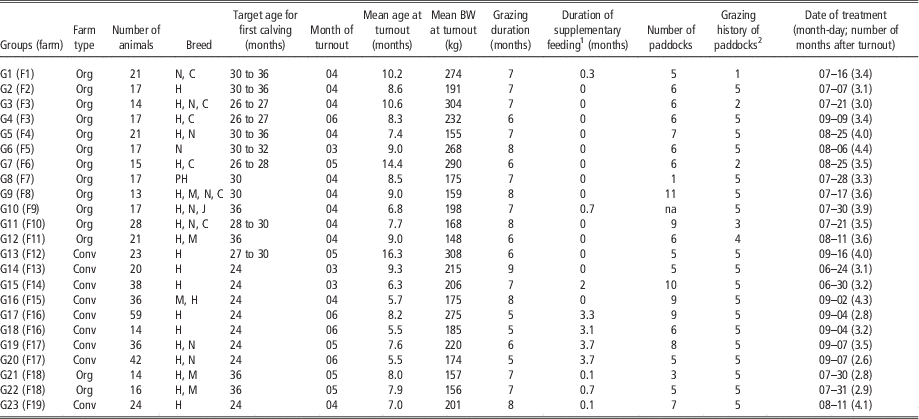
Information regarding grazing management practices and treatment for each group of FGSC are presented in Table 1.
Description of the grazing management practices in the 23 groups of first grazing season cattle involved in the field study

Org=organic; N=Normande; C=cross-bred; H=Holstein; M=Montbeliarde; J=Jersey; na=not available; Conv=conventional; FGS=first grazing season; SGS=second grazing season; DC, dairy cows.
1 When concentrate/forage>grass intake.
2 Pastured grazed by: 1 – FGS/SGS; 2 – FGS/DC; 3 – FGS/SGS/DC; 4 – FGS/SGS/Dry cows; 5 – FGS only.
Treatment threshold and percentage of animals treated in each targeted selective treatment sub-group
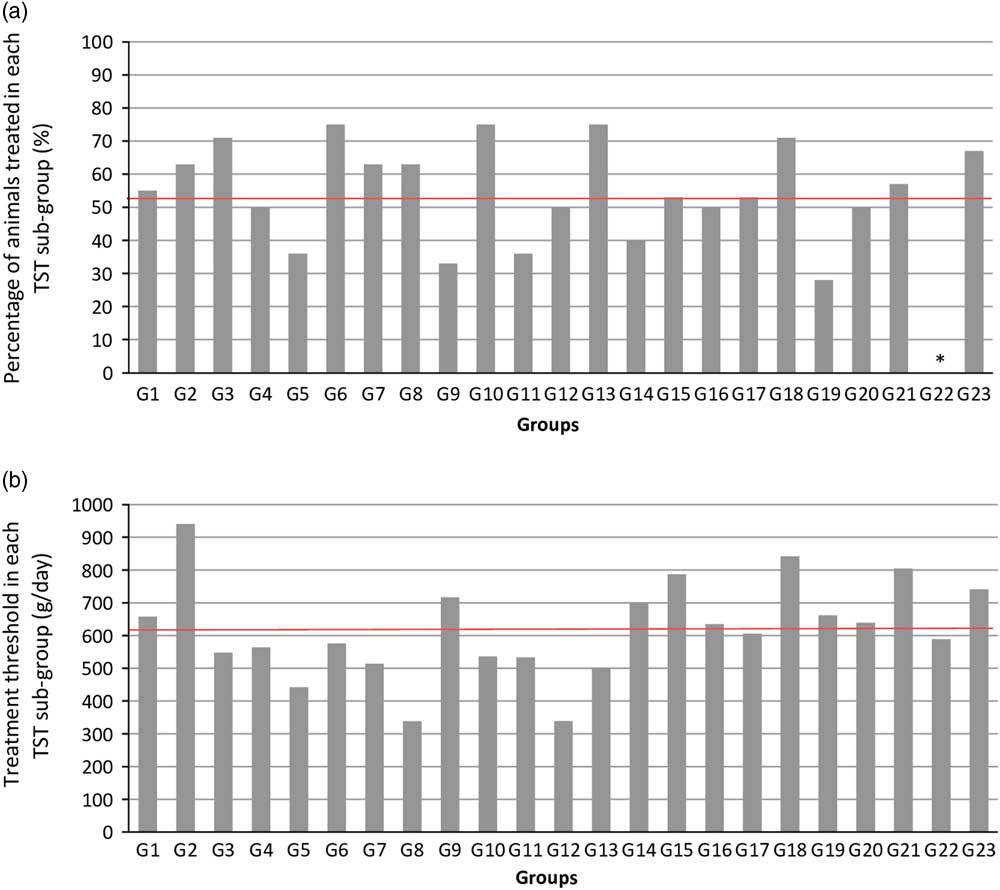
On average, 53% of animals were treated in TST sub-groups, the percentage ranging from 28% to 75% according to sub-groups (Figure 1a). For the majority of TST sub-groups (96%), the percentage of treated animals was between 25% and 75%. The ADWG thresholds for treatment varied from 338 to 941 g/day (mean: 618 g/day) according to TST sub-groups (Figure 1b). In 74% of TST sub-groups, the ADWG threshold was between 500 and 800 g/day.
Percentage of animals treated (a) and treatment threshold (b) in each targeted selective treatment (TST) sub-group for the 23 groups of calves. * This TST sub-group was characterized by a small size (n=8) and one animal was treated but died of an unknown cause. In (a), the red line corresponds to the mean percentage of animals treated for the 23 groups. In (b), the red line corresponds to the mean treatment threshold for the 23 groups.

Comparison of growth and parasitological and clinical parameters between groups and between sub-groups
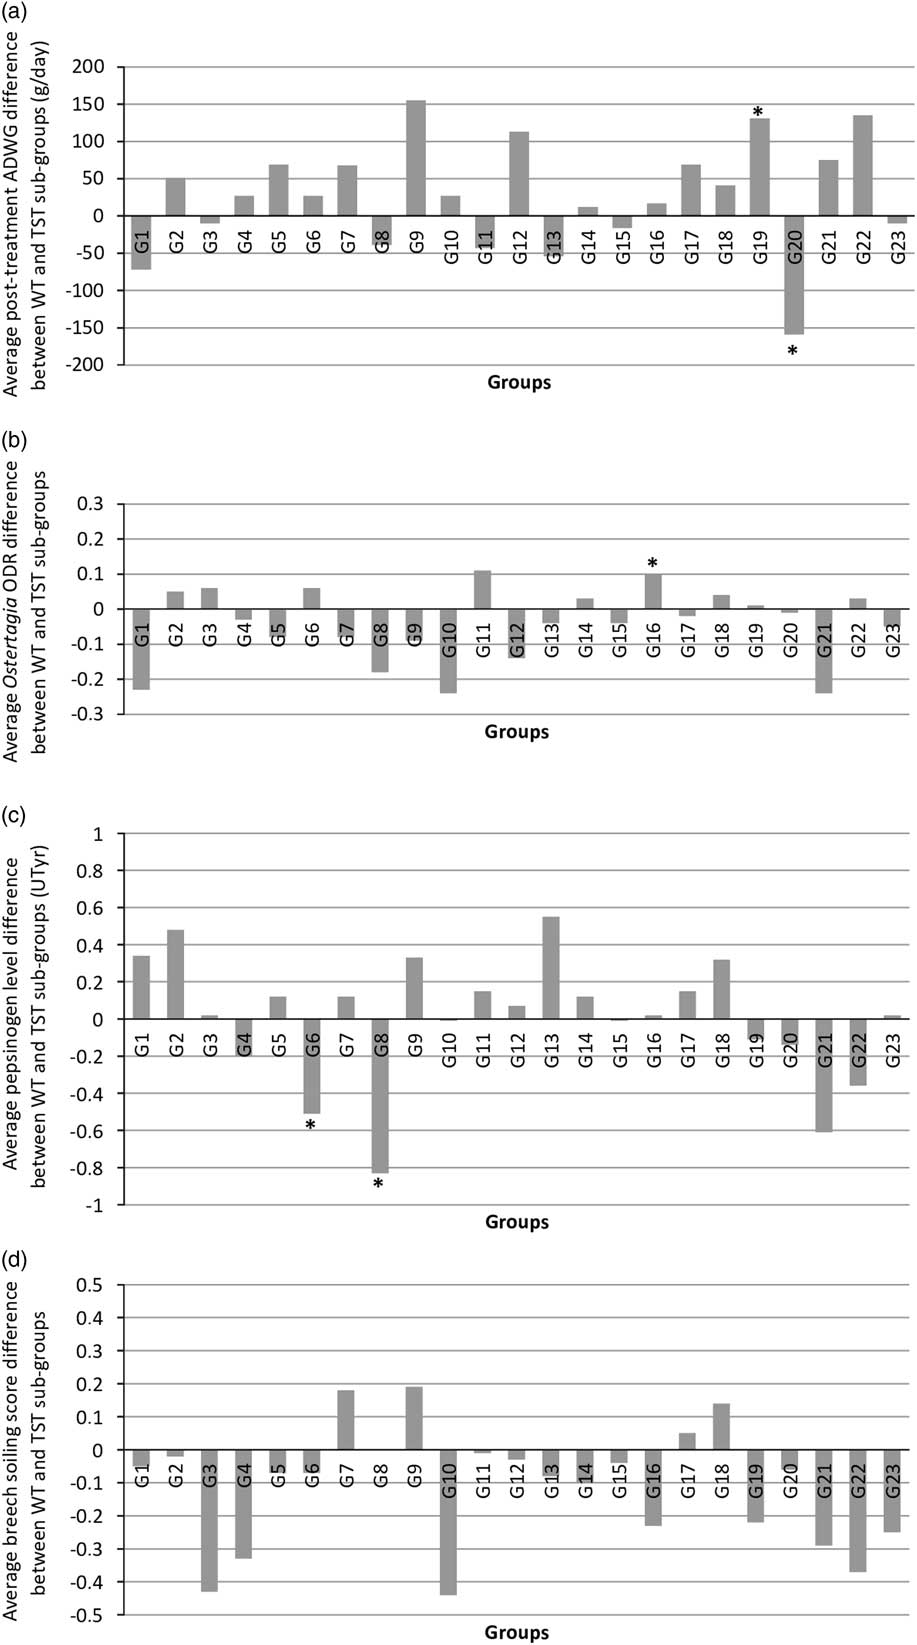
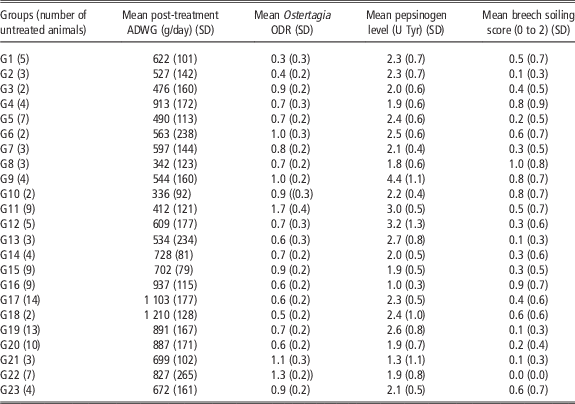
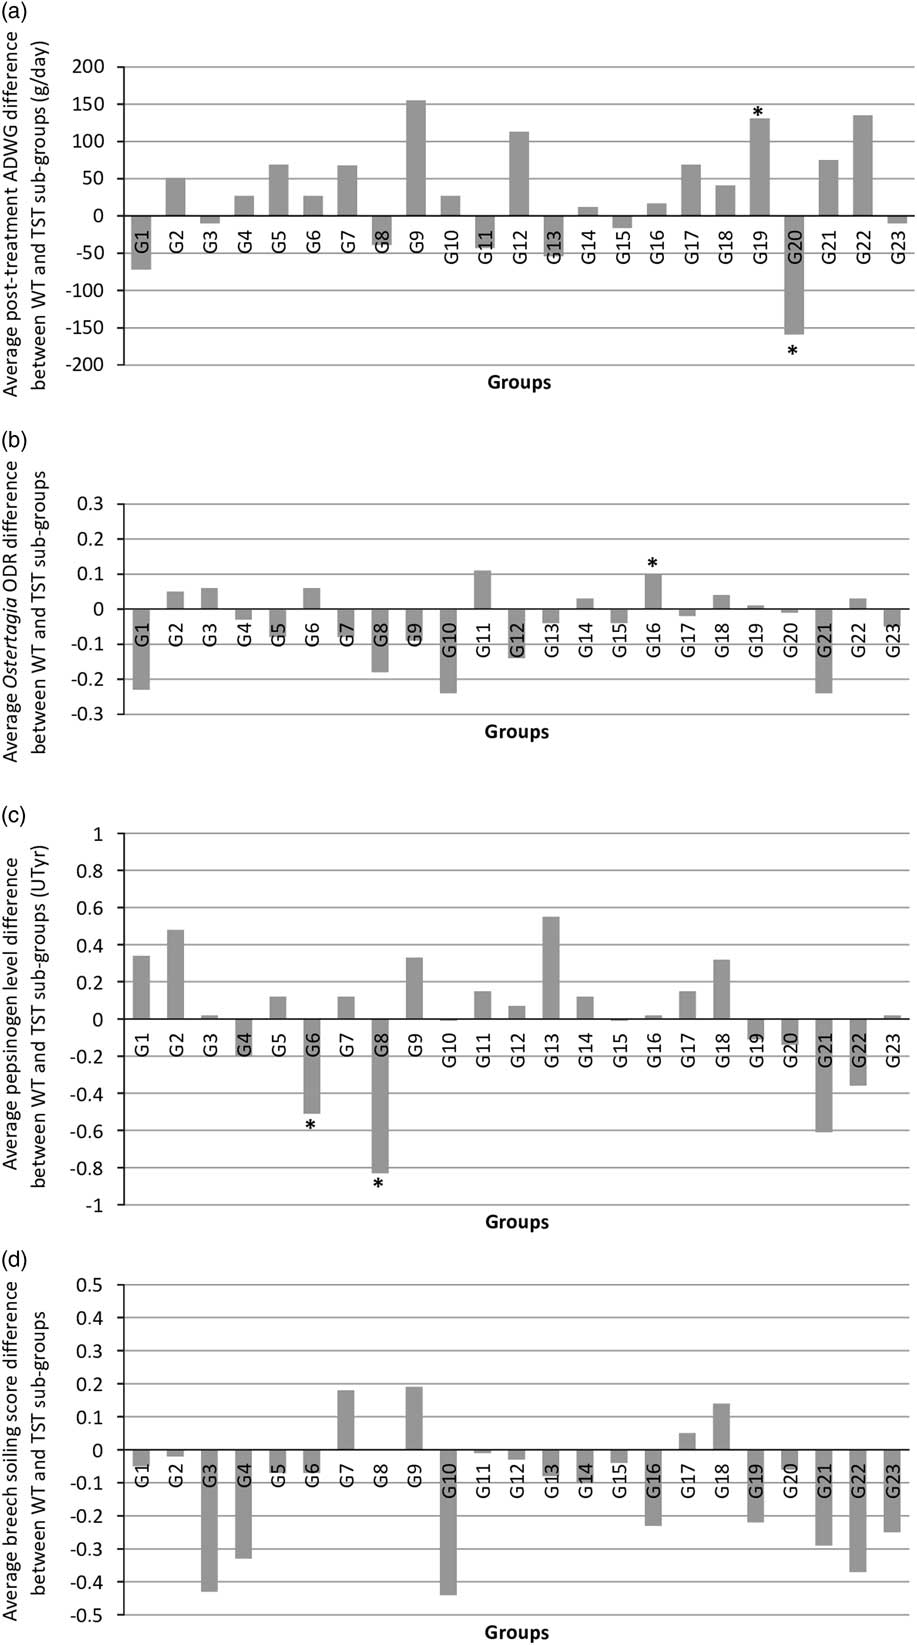
The mean values for post-treatment ADWG and parasitological and clinical parameters at housing according to groups are presented in Table 2. A wide range of post-treatment ADWG was observed between the groups (from 336 g/day for G10 to 1 210 g/d for G18). Within groups, no significant difference in terms of pre-treatment ADWG was observed between TST and WT sub-groups (data not shown). Furthermore, the post-treatment ADWG differences were not significant between WT and TST sub-groups except for G19 (+131 g/day for WT sub-group) and G20 (−159 g/day for WT sub-group) (Figure 2a).
Mean post-treatment average daily weight gain (ADWG) (a), mean Ostertagia optical density ratio (ODR) (b) and mean pepsinogen level (c) between targeted selective treatment (TST) and whole-group treatment (WT) sub-groups for the 23 groups of calves. * Significant difference between WT and TST sub-groups (Mann–Whitney test, P<0.05).
Mean post-treatment average daily weight gain (ADWG), mean Ostertagia optical density ratio (ODR), mean pepsinogen level and mean breech soiling score (and standard deviation) for each group of calves (whole-group treatment (WT) and targeted selective treatment (TST) sub-groups) at housing

At housing, the mean Ostertagia ODR levels varied from 0.3 to 1.7, the mean pepsinogen level ranged from 1.3 to 4.4 U Tyr and the mean BSS fluctuated from 0 to 1.1 according to groups (Table 2). Within groups, the only significant Ostertagia ODR difference between WT and TST sub-groups was seen for G16 (WT>TST) (Figure 2b). In addition, the only significant mean pepsinogen level differences between WT and TST sub-groups were seen for G6 and G8 (WT<TST with −0.51 and −0.83 U Tyr, respectively) (Figure 2c). No significant mean BSS difference was observed between WT and TST sub-groups.
Classification of groups according to the mean Ostertagia optical density ratio and pepsinogen levels in untreated animals
At housing, untreated animals exhibited a mean Ostertagia ODR<0.7 in six groups (the low exposed groups: G1/G2/G13/G16/G18/G20) and a mean Ostertagia ODR ⩾0.7 in 17 other groups (the high exposed groups) (data not shown). Among these 17 groups, six of them (G5/G6/G9/G11/G12/G19) exhibited a mean pepsinogen level ⩾2.5 U Tyr (data not shown).
Evaluation of the treatment effect on growth according to Ostertagia optical density ratio and pepsinogen classes of level
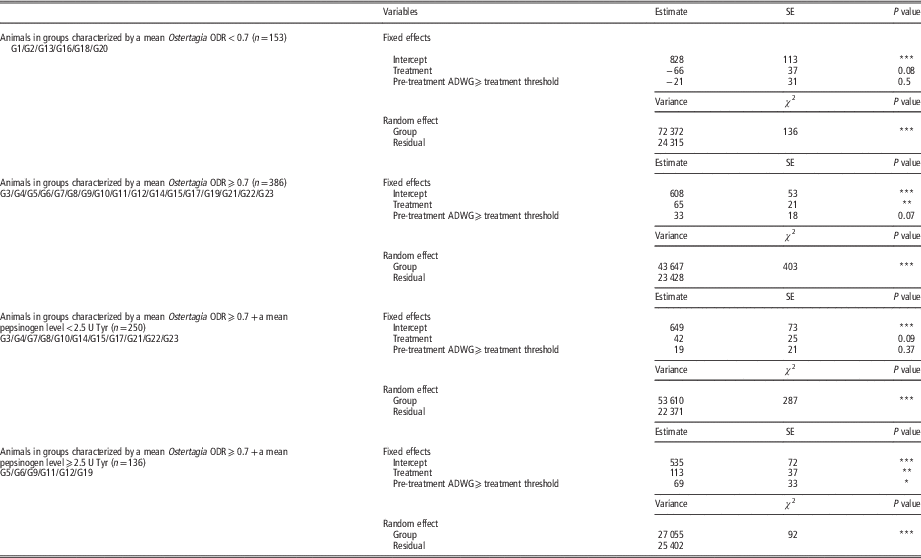
In the six low exposed groups, the effect of treatment on post-treatment ADWG was not significant (Table 3). At the opposite, in the 17 high exposed groups, the treatment significantly explained the post-treatment ADWG variability (P<0.01). In six of these 17 groups exhibiting also a mean pepsinogen level ⩾2.5 U Tyr, the positive impact of treatment on growth was significant (P<0.01) and higher than for other groups characterized by a mean pepsinogen level<2.5 U Tyr (P=0.09) (Table 3). In these six groups, the individual live weight gain due to the treatment was estimated up to 14 kg compared with untreated animals after a post-treatment grazing duration of 4 months.
Evaluation of the effect of treatment on individual post-treatment average daily weight gain in Ostertagia optical density ratio (ODR) and pepsinogen level classes: linear mixed-effect models

*P<0.05, **P<0.01, ***P<0.001.
Discussion
The aim of this study was to assess a mid-season anthelmintic TST strategy based on ADWG in first grazing season calves. We investigated whether such a strategy could provide similar results to a WT performed at the same time. In the tested strategy, the treatment threshold was the mid-season mean ADWG measured in the corresponding WT sub-group. Therefore, the selective treatment threshold could be different from one group to another. Actually, ADWG thresholds calculated varied from 338 to 941 g/day. This variability between groups showed the relevance of a flexible ADWG threshold in the TST strategy: it can be farm/group-specific and therefore adjustable to the diversity of herd management objectives and practices.
In our study design, Ostertagia ODRs, pepsinogen levels and BSSs were determined at housing. A wide range of values was observed between groups for those parasitological and clinical indicators related to GIN infection, confirming that our trial was carried out in different epidemiological contexts characterized by different levels of parasitic challenge during the grazing season, most likely related to the variability of grazing management practices (Table 1) and meteorological conditions. Several studies showed that the level of exposure to GIN in FGSC groups is influenced by grazing management practices (turnout date, grazing duration, paddock rotations, supplementary feeding), and meteorological conditions (Ploeger et al., Reference Ploeger, Borgsteede, Eysker and van den Brink1990; Bennema et al., Reference Bennema, Vercruysse, Morgan, Stafford, Höglund, Demeler, von Samson-Himmelstjerna and Charlier2010; Charlier et al., Reference Charlier, Demeler, Höglund, von Samson-Himmelstjerna, Dorny and Vercruysse2010; Merlin et al., Reference Merlin, Chauvin, Madouasse, Lehebel, Brisseau, Bareille and Chartier2017).
In those different epidemiological contexts, we showed that the WT and the TST sub-groups were globally not different at housing regarding post-treatment ADWG and parasitological and clinical parameters. However, these observations were not sufficient to validate the TST approach as the effect of treatment on growth must also be demonstrated. In groups characterized by a high level of exposure to GIN (mean Ostertagia ODR of untreated animals ⩾0.7), we verified that (i) the treatment applied actually had a positive effect on growth at the group level (significant improvement of post-treatment ADWG in treated animals compared with untreated animals), and that (ii) TST and WT strategies gave similar results at the sub-group level. In these groups, the TST strategy could thus be validated. However, in groups characterized by a low level of exposure to GIN (mean Ostertagia ODR of untreated animals<0.7), the effect of treatment on growth was not confirmed: the TST strategy could not be validated because the absence of difference between WT and TST sub-groups was due to the absence of effect of treatment. This was consistent with our previous results and with our categorization of groups (high v. low exposed groups): when mean Ostertagia ODR values<0.7, there was no association between gastrointestinal parasitism and growth (Merlin et al., Reference Merlin, Chauvin, Madouasse, Lehebel, Brisseau, Bareille and Chartier2017). In these low exposed groups, the parasitic challenge was actually not high enough to induce weight losses. Consequently, the mid-season treatment would not be necessary in such groups, and it would be relevant not to treat or at least to delay the treatment to maintain a host-parasite contact which enables the development of host immunity (Ploeger and Kloosterman, Reference Ploeger, Borgsteede, Sol, Mirck, Huyben, Kooyman and Eysker1993, Ploeger et al., Reference Ploeger, Kloosterman, Rietveld, Berghen, Hilderson and Hollanders2000).
Finally, in groups where the TST strategy was validated, we showed that the mid-season ADWG could allow the identification of those animals which do not suffer from GIN infection, which will achieve acceptable growth during the second part of the season and which do not require anthelmintic treatment. This result is consistent with the study of Höglund et al. (Reference Höglund, Morrison, Charlier, Dimander and Larsson2009) who stated that, without treatment, the mid-season ADWG (4 to 8 weeks after turnout) in FGSC was a good predictor of the ADWG at housing.
Nevertheless, we can hypothesize that the effect of treatment had been minimized in our experimental design because of (i) the drug selected, and/or (ii) because of the timing of treatment:
(i) Levamisole is a non-persistent anthelmintic and calves could therefore be re-infected the day after treatment. However, despite this drawback, levamisole was chosen to limit the interactions between the two sub-groups grazing on the same pastures (a physical separation of animals was impossible). Indeed, if a long-acting anthelmintic had been used, the deworming effect would have been extended and the treated animals, representing about 75% of the group, could have limited the pasture infectivity level for the untreated ones.
(ii) In our study design, the treatment was applied at mid-season. But one can ask whether it was the optimal date for targeted selective treatment: were the pasture infectivity level and parasitic loads sufficient to induce production losses? In order to determine for each group the optimal timing for treatment, the ideal would have been to closely monitor the infection in calves or the dynamics of the third stage larvae populations on pastures by monthly measurements for example. However, in such protocol, the strategy tested would not be operational because this close monitoring is not feasible in the field: it is time-consuming, expensive and requires frequent handling of animals. Moreover, in the study of Höglund et al. (Reference Höglund, Dahlström, Sollenberg and Hessle2013), where this close monitoring was implemented, treatment was finally applied once and, as in our protocol, 2 or 3 months after turnout. Indeed, in this latter study, animals in the TST groups were followed from 8 weeks after turnout until housing at fortnightly intervals and were selectively treated on the basis of an ADWG threshold calculated on calves receiving a suppressive anthelmintic treatment. All the treatments in the TST group were actually performed between 8 and 12 weeks after turnout and animals were treated once. These results indicate that our mid-season treatment was relevant. In the study of Greer et al. (Reference Greer, McAnulty and Gibbs2010) in New-Zealand, the TST for dairy calves was based on the monthly monitoring of animals with a selective treatment based on a predefined weight- and breed-target growth rates (581-679 g/day). Results indicated 0.83 to 1.76 treatments per calf in the TST groups, but without information regarding the timing of treatment.
To our knowledge, this is the first study comparing an easy-to-implement TST strategy with a commonly applied deworming procedure (whole-group treatment) in several groups of calves (n=23). The other studies on the TST strategy were limited to a few groups of calves, were complex and comparison of TST was made with highly suppressive treatment strategies not implemented by farmers (Greer et al., Reference Greer, McAnulty and Gibbs2010; Höglund et al., Reference Höglund, Dahlström, Sollenberg and Hessle2013).
Our operational TST approach was based on ADWG flexible thresholds and was validated in high exposed groups. However, ADWG remains a crude indicator which is not specific to GIN infection. Indeed, the sensitivity and specificity of ADWG to detect animals needing treatment (on the basis of high faecal egg count or high Ostertagia ODR) are around 0.75 and 0.55 respectively (Höglund et al., Reference Höglund, Morrison, Charlier, Dimander and Larsson2009; Merlin et al., Reference Merlin, Chauvin, Madouasse, Lehebel, Brisseau, Bareille and Chartier2017). This means that 25% of the animals needing treatment will not be treated and that 45% of the treated animals should not be treated.
In our study sample, on average, 50% of animals remained untreated in the TST sub-groups. Our TST strategy could thus ensure the conservation of a large refugia population, and would limit the selective pressure exerted on GIN population. Besides, Berk et al. (Reference Berk, Laurenson, Forbes and Kyriazakis2016) showed that treating calves according to ADWG thresholds is the best method to maximize the proportion of susceptible infective larvae on pastures in comparison with faecal egg count and pepsinogen indicators. This is explained by the combination of two factors: first, this method selects calves with an intrinsically slow growth genotype that do not necessarily have high worm burdens. Second, this method does not select resilient individuals experiencing large worm burdens without showing clear signs of poor performances due to parasitism (Berk et al., Reference Berk, Laurenson, Forbes and Kyriazakis2016). Notwithstanding, the refugia-based strategy may appear counterintuitive for farmers as it entails that several animals remain untreated (Van Wyk et al., Reference Van Wyk, Hoste, Kaplan and Besier2006). The implementation of refugia-based strategy thus depends on the acceptance of the farmers which is in turn subordinated to whether the TST strategy (i) is easy-to-implement or not, (ii) enables the minimization of any loss in animal performance (Van Wyk et al., Reference Van Wyk, Hoste, Kaplan and Besier2006; Kenyon et al., Reference Kenyon, Greer, Coles, Cringoli, Papadopoulos, Cabaret, Berrag, Varady, Van Wyk, Thomas, Vercruysse and Jackson2009).
Finally, our TST strategy was operational, did not induce weight losses (compared with a whole-group treatment) and enabled to conserve refugia. This strategy met the criteria to be adopted by farmers while preventing the emergence of anthelmintic resistance.
Acknowledgements
The authors warmly thank the people involved in the network of experiment units of INRA (Installation Expérimentale de Production Laitière, UMR 1348, J. Lassalas; Unité Expérimentale, UE 0326, F. Launay; Installation Expérimentale de l’unité SAD-ASTER, UR 55, C. Mignolet; Unité Expérimentale UEMA, UE 1296, P. D’Hour) and of chambres d’agriculture (Trévarez: G. Trou; Derval: B. Le Danois; Trinottières: D. Plouzin) and the farmers from Groupement des Agriculteurs Biologistes in Loire-Atlantique and Morbihan for their huge contribution to this work. Special thanks are also due to F. Leray and E. Blandin (Oniris).
This study was funded by the metaprogram GISA STREP (INRA) and by the Ecologically Intensive Agriculture Chair (Chaire AEI) (Agrial, Terrena, Triskalia, Agrocampus Ouest, ESA, Oniris). Aurélie Merlin is a grateful recipient of a PhD thesis grant from the Chaire AEI.