It has long been assumed that personality disorder (PDs) features remain stable over time, within the individual. For years the prevailing diagnostic nomenclature (Diagnostic and Statistical Manual of Mental Disorders [DSM]; American Psychiatric Association [APA], 1980, 1987, 1994) has embraced this assumption in asserting that PDs, which are relatively prevalent disorders affecting about 10% of the population (Lenzenweger, Loranger, Korfine, & Neff, Reference Lenzenweger, Loranger, Korfine and Neff1997; Lenzenweger, Lane, Loranger, & Kessler, Reference Lenzenweger, Lane, Loranger and Kessler2007), are “enduring patterns” of individual behavior that are “inflexible” and “stable over time” (APA, 1994, pp. 629–639). However, an emerging corpus of data from modern prospective longitudinal studies reveals that there is considerable individual change in personality pathology over time and, in addition, that these changes differ across individuals, whether PDs are conceptualized as dimensions or diagnostic entities (Johnson, Cohen, Kasen, Skodol, Hamagami, & Brooks, 2000; Lenzenweger, Reference Lenzenweger1999; Lenzenweger, Johnson, & Willett, Reference Lenzenweger, Johnson and Willett2004; Shea et al., Reference Shea, Stout, Gunderson, Morey, Grilo and McGlashan2002; Zanarini, Frankenburg, Hennen, & Silk, Reference Zanarini, Frankenburg, Hennen and Silk2003; Zanarini, Frankenburg, Hennen, Reich, & Silk, Reference Zanarini, Frankenburg, Hennen, Reich and Silk2005). In short, PDs do not appear to be set like plaster or carved in granite. Rather, the contemporary picture of the PDs is one characterized by plasticity, individual change, and interindividual heterogeneity in change over time. The reasons for this plasticity, change, and heterogeneity over time, nonetheless, remain fundamentally opaque.
We have been pursuing a program of research designed to illuminate and uncover variables that may be responsible for both interindividual and intraindividual growth and change in the PDs (Lenzenweger & Castro, Reference Lenzenweger and Castro2005; Lenzenweger, Clarkin, Fertuck, & Kernberg, Reference Lenzenweger, Clarkin, Fertuck and Kernberg2004; Lenzenweger & Willett, Reference Lenzenweger and Willett2007). Our program has been facilitated by the availability of prospective, multiwave PD and personality data from the Longitudinal Study of Personality Disorders (LSPD; for an overview, see Lenzenweger, Reference Lenzenweger2006) as well as contemporary developments in quantitative methods suited for the study of growth and change (Singer & Willett, Reference Singer and Willett2003), especially those inspired by the individual growth curve framework for the study of change over time (Rogosa & Willett, Reference Rogosa and Willett1985).
In this report, we seek to provide a window on this methodological and quantitative approach by adopting a longitudinal focus on schizoid personality disorder (SZDPD). SZDPD has long been described in the clinical literature as a diagnostic entity of considerable interest (Bernstein, Arntz, & Travaglini, Reference Bernstein, Arntz, Travaglini, Blaney and Millon2009), yet still very little is known about its long-term longitudinal course within the individual over time and the determinants of differences in change across individuals (if any). According to the DSM-IV (APA, 1994), “the essential feature of schizoid personality disorder is a pervasive pattern of detachment from social relationships and a restricted range of expression of emotion in interpersonal settings (p. 638).” SZDPD individuals may be described as “loners” or “recluses” by the lay observer. The lack of desire for contact of any sort (including sexual contact) with other human beings in SZDPD is profound. The nearly complete absence of any expression of emotion creates the impression of coldness, detachment, and almost complete affective flattening (for an excellent review, see Bernstein et al., Reference Bernstein, Arntz, Travaglini, Blaney and Millon2009).
Affecting roughly 1–2% of the general population (Lenzenweger, Reference Lenzenweger2008),Footnote 1 SZDPD resides in the “odd/eccentric” Cluster A section of the DSM system Axis II taxonomy with both schizotypal personality disorder and paranoid personality disorder. However, whereas schizotypal and paranoid personality disorder have come to be considered alternative expressions of schizophrenia liability (Lenzenweger, Reference Lenzenweger, Lenzenweger and Dworkin1998, Reference Lenzenweger, Blaney and Millon2009), SZDPD appears to be considerably less related to schizophrenia liability. SZDPD affected individuals rarely come to the attention of treating clinicians, as most do not appear in either inpatient or outpatient settings; rather, they live and function in the community. Those SZDPD individuals that present to clinical services are more likely than not to present in some form of crisis (e.g., drug abuse, suicidal behavior, depressive episode). A recent study of the prevalence of PDs in a large series of outpatients found relatively few (1.4%) to have SZDPD (Zimmerman, Rothschild, & Chelminski, Reference Zimmerman, Rothschild and Chleminski2005). Moreover, in contrast to schizotypal and paranoid PDs (as well as most other PDs), SZDPD represents more of a monothetic disorder, phenotypically manifesting itself as a profound disruption in sociability. This disruption may perhaps be reflective of a massive impairment in the underlying affiliation system (see Depue & Lenzenweger, Reference Depue, Lenzenweger and Livesley2001, Reference Depue, Lenzenweger, Lenzenweger and Clarkin2005). Finally, the disorder seems to appear with comparable frequency in men and women (Bernstein et al., Reference Bernstein, Arntz, Travaglini, Blaney and Millon2009).
Not unlike the general picture of plasticity and change over time emerging for nearly all of the other PDs in the DSM taxonomy, SZDPD is also characterized by change over time rather than immutable stability. For example, in the LSPD, the study from which we drew the data for the current exercise, although individuals maintained their position in the overall rank ordering of SZDPD features across assessment waves, we observed statistically significant changes in the mean levels (declines) of SZDPD features in both interview and self-report assessments (Lenzenweger, Reference Lenzenweger1999). Lenzenweger, Johnson, et al. (2004) used the more sensitive and fine-grained analytic approach of individual growth curve analysis and found that SZDPD features showed a statistically significant (rate of change = −0.07, p < .004) rate of change (toward decreasing symptomatology) over time, consistent with a small to medium effect size. Clearly, SZDPD was found to show evidence of growth/change over a 4-year study period in the LSPD. The results of the Children in the Community Study (CIC), under the direction of Patricia Cohen, also reported that levels of SZDPD features declined over time, showing a 47% drop in magnitude from the 9- to 12-year-old period to the 25- to 28-year-old period (Johnson et al., Reference Johnson, Cohen, Kasen, Skodol, Hamagan and Brook2000). Of interest, unlike the LSPD results, relatively low levels of stability in individual differences (rank order stability) were found for SZDPD, and therefore, SZDPD features in adolescence did not predict SZDPD in adulthood successfully. Thus, contemporary prospective multiwave studies suggest not only a lessening of SZDPD features over time, on average, but also the presence of interindividual heterogeneity in the emergence of the disorder over time (in the CIC).Footnote 2
In contrast to the findings of the LSPD and CIC, Durbin and Klein (Reference Durbin and Klein2006) did not find a statistically significant decrease in SZDPD features from baseline assessment to a 10-year follow-up in outpatient psychiatric patients who had concurrent mood disorders. However, it is somewhat difficult to discern whether some of the residual impairment and affective phenomenology present in individuals who are affectively ill could impact the presentation and, perhaps, assessment of SZDPD features. Fortunately, Durbin and Klein used a well-constructed semistructured psychiatric interview (the International Personality Disorder Examination [IPDE]; Loranger, Reference Loranger1999), which has been shown to be robust for Axis II assessments even in the face of mood and mental state disturbances (Loranger et al., Reference Loranger, Lenzenweger, Gartner, Susman, Herzig and Zammit1991). Finally, the results of a study in the United Kingdom found evidence for change in SZDPD features over time, on average, but in contrast to all other studies, these investigators reported an increase in SZDPD features with the passage of time (Seivewright, Tyrer, & Johnson, Reference Seivewright, Tyrer and Johnson2002). Thus, it seems reasonable to claim, informed by empirical data (as opposed to clinical impression or traditional psychiatric lore), that SZDPD displays a degree of plasticity over time.Footnote 3 The developmental psychopathology task at hand, therefore, is to discern those variables responsible for this plasticity (i.e., the individual changes) in the SZDPD as a psychopathological entity. Moreover, we should seek to illuminate the mechanism by which these changes, and the interindividual differences among them, in SZDPD occur over time.
What could a set of candidate variables that were responsible for change in SZDPD over time look like? One could consider any number of potential predictors of change in SZDPD symptomatology over time. However, one immediate research vector presents itself, namely, temperament and those processes subserving temperament. Thus, we hypothesize that one possible mechanism that might account for the change in SZDPD over time could be those underlying temperament processes that show themselves some plasticity over time. Temperament denotes a collection of constructs, and the overarching concept of temperament core to many developmental approaches to psychopathology. However, why would temperament be of relevance to the development of personality disorders in general, and SZDPD in particular? In many models, temperament is conceptualized as being the foundation that underlies personality and therefore, presumably, personality disorders. Temperament is often conjectured as being grounded in genetically influenced neurobehavioral systems and, moreover, it is thought to maintain its influence on the development of interindividual differences over time through childhood (e.g., Putnam, Rothbart, & Gartstein, Reference Putnam, Rothbart and Gartstein2008) on in to adolescence and adulthood (e.g., Schwartz, Wright, Shin, Kagan, & Rauch, Reference Schwartz, Wright, Shin, Kagan and Rauch2003). Several major theoretical positions/frameworks regarding the nature of temperament have been advanced over the years (e.g., Buss & Plomin, Reference Buss and Plomin1984; Derryberry & Rothbart, Reference Derryberry and Rothbart1988; Kagan, Reznick, & Snidman, Reference Kagan, Reznick and Snidman1988; Thomas & Chess, Reference Thomas and Chess1977; see also Shiner, Reference Shiner1998)Footnote 4 and, in many respects, the similarities among them are greater than their differences. For the purposes of the LSPD, a measure of temperament was needed that could be completed by individuals who were young adults at the time of assessment, yet as a measure it would presumably be sensitive to the central constructs of temperament known to be prominent in childhood and, by implication, their phenotypic expression in adulthood. Thus, Buss and Plomin's (1984) Emotionality–Activity–Sociability (EAS) Adult Temperament Scale was administered in the LSPD to assess the primary temperamental constructs of emotionality, activity, and sociability in the study participants.
A necessary and logical precursor to addressing the question of whether change in temperament over time predicts change in SZDPD over time is to specify and fit statistical models that represent simultaneously, in a thoughtful and fine-grained manner, individual growth over time in measures of both temperament (emotionality, sociability, and activity) and SZDPD features. In this paper, we use longitudinal data on both SZDPD symptomatology and the three major temperament dimensions to test our hypotheses about how individual change in emotionality, activity, and sociability impact individual change in SZDPD features over time. As our hypotheses concern potential relationships among individual change over time in both our outcome and our predictors, in our analyses we must simultaneously model change over time in personality disorders and in the interactive temperament systems (emotionality, activity, and sociability) that we believe could impact that change in SZDPD. We do this by applying latent growth modeling, a recently developed analytic approach that has mapped the methods of individual growth modeling onto the general covariance structure model (Willett & Bub, Reference Willett, Bub, Everitt and Howell2005; Willett & Keiley, Reference Willett, Keiley, Tinsley and Brown2000; e.g., Lenzenweger & Willett, Reference Lenzenweger and Willett2007).
Our application of latent growth modeling is relatively new in developmental psychopathology research, and builds directly on more traditional methods of analyzing longitudinal data. It is an extension of our earlier work on the analysis of individual growth, in which we used multilevel modeling to investigate systematic interindividual differences in growth by examining the relationships between time-invariant predictors, such as a subject's gender, and an individual's change in an outcome, like personality disorders, over time (Lenzenweger, Johnson, et al., 2004).
Under the standard individual growth modeling approach, individual change in the personality disorder outcome is described as a function of time by specifying a “Level 1” individual growth model (Singer & Willett, Reference Singer and Willett2003). The strength of the growth modeling approach is that it is possible to specify a variety of linear and nonlinear functional forms for representing individual change over time, seeking the most meaningful, well-fitting, and substantively appealing representation. However, when there limited numbers of waves of longitudinal data available for analysis, the functional form of the latter Level 1 growth model must necessarily be simple. With three waves of data on each individual, for instance, as in the current example, one can only adopt an individual growth model that has, at most, two parameters. This typically means that individual change is described as a linear function of time. Such a model contains two individual growth parameters: (a) an intercept parameter that represents the individual's “true initial status” (providing that the first occasion of measurement is chosen as the origin of time: a process known as “centering”), and (b) a slope parameter that represents the individual's “true rate of change over time.”
Once the Level 1 model has been defined, the two individual growth parameters can then stand in place of the individual change trajectory in subsequent analyses of interindividual differences in change. These latter analyses are achieved by specifying a “Level 2” statistical model in which the interindividual heterogeneity in the Level 1 parameters; that is, the differences across people in individual true initial status and rate of change are hypothesized to depend upon selected time-invariant predictors of change, such as subject gender.
The Level 1 and Level 2 models can be fitted simultaneously to longitudinal data, usually by maximum-likelihood methods. By testing and interpreting the obtained Level 2 parameter estimates, we can detect and assess any systematic interindividual differences in change that are present. As a consequence, we may conclude that the true initial status and rate of change in personality disorder differ for men and women, and consequently, that the entire personality growth trajectory differs by gender, on average, in the population (Singer & Willett, Reference Singer and Willett2003, provide an extensive description of the approach).
The individual growth model approach has many important advantages for the serious analysis of longitudinal data. It is not limited by the number of waves of data that can be incorporated into the analysis. In fact, the more waves of data that are collected and analyzed, the more statistical power accrues to the analysis, the greater the reliability with which change can be measured, and the more complex the individual trajectories that can be fit. This often opens up a richer arena of more interesting research questions that can be addressed, and with increasing precision. For instance, with more waves of data designed into the data collection, the investigator is no longer limited to a simple assessment of what predicts heterogeneity in the initial status and rate of change of the individual trajectories, but it may also be able to examine more complex curvilinear growth. For instance, one could track individual logistic and negative exponential trajectories over time, say, testing for interindividual differences in their asymptotes, half-lives, and instantaneous slopes at entry. Furthermore, in addition to suffering no limits on the number of waves of data that can be incorporated into any analysis, the individual growth modeling approach allows different individuals to contribute different numbers of waves of data, each obtained on a unique schedule, to the same analysis: something that more traditional approaches to analyzing panel data, such as repeated-measures analysis of variance, cannot entertain. Finally, where appropriate, it is also straightforward to hypothesize individual growth trajectories that are discontinuous, and that exhibit their discontinuities at important transitions in an individual's life. This permits the investigator to extend the research to assessing the impact of experimental treatments and disrupive life events, such as divorce, on individual growth over time.
Our current work is a direct extension of the individual growth modeling framework to a multivariate context, with growth in several constructs being modeled simultaneously. To achieve this, we use the methods of covariance structure analysis to model growth over time simultaneously in multiple domains, such as SZDPD and temperament. This “latent growth modeling” approach differs only in that it permits the concurrent specification of several Level 1 individual growth models to describe change in both the outcome and the predictors simultaneously. Consequently, at Level 2, we can examine potential relationships among the multiple trajectories of change, rather than simply seeking time-invariant predictors of those changes (although the latter can be incorporated also).
Our approach is concerned fundamentally with understanding of both stability and change (growth) in psychopathology over time. A number of other statistical approaches have been brought to bear on questions of stability and change in psychopathology over time, of course, in longitudinal data like ours. One approach, for example, treats the dimensions of temperament as time-varying predictors of change in SZDPD symptomatology and incorporates measures of temperament directly into the Level 1 individual growth model itself, along with the time predictor. Although this is a feasible analytic approach for handing time-varying covariates, it addresses an entirely different research question from ours, asking instead whether there is a concurrent relationship between time-varying levels of symptomatology and temperament while both are changing over occasions (thereby asking, “Is SZDPD symptomatology related to measures of temperament, controlling for time?”), rather than the relationship that we have examined here between concurrent changes in both outcome and predictor. A second popular approach has been to use path analysis and structural equation modeling to investigate simultaneous set of lagged pairwise relationships, between levels of the time-varying predictors on one occasion and the level of the outcome on a subsequent occasion, over multiple waves of data (this is a path-analytic extension of the now mostly disused and largely discredited cross-lagged correlation approach). Again, although this kind of analysis can certainly succeed in detecting the presence of multiple simultaneous pairwise relationships, and examine and compare the magnitudes of their effects over time, it cannot address a research question about change over time nor one about hypothesized links between simultaneous changes in both outcome and predictor, as does the approach we have implemented here.
In the present study, therefore, we sought to investigate, using prospective multiwave data from the LSPD (Lenzenweger, Reference Lenzenweger1999, Reference Lenzenweger2006; Lenzenweger et al., Reference Lenzenweger, Loranger, Korfine and Neff1997; Lenzenweger, Johnson, et al., 2004; Lenzenweger & Willett, Reference Lenzenweger and Willett2007), whether individual change in emotionality, activity, and sociability predicted individual change in SZDPD features over time. For the purposes of our work, we defined our outcome as the total number of SZDPD features evidenced by each subject at each wave. Fortunately, we had two independent measures of SZDPD available for all of our participants: one based on a structured interview and the other based on self-report (see below). Both of these clinical measures are well-validated from the standpoint of psychopathology assessment. The use of two measures that are based on two different methodologies (interview vs. self-report) provides useful alternative vantage points from which to view change in SZDPD. Therefore, to address our research questions, we modeled individual change simultaneously in emotionality, activity, and sociability and SZDPD features using latent growth modeling, and examined the prediction of individual change in the latter outcome variable by the individual changes in emotionality, activity, and sociability. We present and describe our statistical models in greater detail, below.
Finally, in this context we note that our focus on the participants in the LSPD data set necessarily begins with the longitudinal study of persons that entered the study at age 18 as they were selected initially from a university sample. Moreover, the DSM approach to the diagnosis of personality disorders demarcates age 18 as the minimum age for the diagnosis of personality disorders. Although the LSPD began with subjects at age 18, there is no reason to believe that the development of personality pathology began at age 18. In fact, although the DSM approach to personality disorders has selected age 18 as a formal cutoff, in the LSPD we actually had to evaluate the history of the participants as it related to personality disorders back to the age 13. This was so because our primary diagnostic interview necessitated knowledge of the PD-relevant history for each participant for the current year as well as for the prior 5 years. Insofar as schizoid PD is concerned, or any PD for that matter, it is our view that the development and emergence of personality pathology essentially begins at conception. By this we mean to emphasize that all PDs are emergent phenomena that develop from the complex interaction of genetically influenced brain-based neurobehavioral systems (Depue & Lenzenweger, Reference Depue, Lenzenweger and Livesley2001, Reference Depue, Lenzenweger, Lenzenweger and Clarkin2005, Reference Depue, Lenzenweger, Krueger and Tackett2006) with environmental inputs (e.g., parenting, peer relations, specific contextual enrichments, trauma, and so on). To this end, we present our analyses and results as a dynamic snapshot of the developmental period from roughly 18 to 21 in the LSPD subjects; however, we emphasize that we see the development and emergence of SZDPD as having roots well before this period. Furthermore, we note that additional study of the subjects in the LSPD will provide important long-term data on the life span development of SZDPD on into the later life course.
Method
Data set: LSPD
The LSPD (Lenzenweger, Reference Lenzenweger1999, Reference Lenzenweger2006; Lenzenweger, Johnson, et al., 2004), which was begun in 1991 as the first National Institutes of Mental Health-sponsored longitudinal study of PDs, has a prospective multiwave longitudinal design with participants evaluated at three points in time, corresponding to their first, second, and fourth years in college. Interview assessments for PD (i.e., Axis II) and Axis I disorders were conducted by PhD or advanced Master Social Worker clinicians with extensive Axis II diagnostic experience, at each of the three assessment waves (Lenzenweger et al., Reference Lenzenweger, Loranger, Korfine and Neff1997). All participants in the LSPD also completed a self-report inventory for personality pathology at all three assessment waves. Finally, as the LSPD is a naturalistic prospective study, participants were free to seek psychological treatment of their own accord. Extensive detail regarding the LSPD, including reliability assessments and other technical matters, is given in prior publications and the interested reader is referred to those papers (Lenzenweger, Reference Lenzenweger1999, Reference Lenzenweger2006; Lenzenweger et al., Reference Lenzenweger, Loranger, Korfine and Neff1997).
Participants
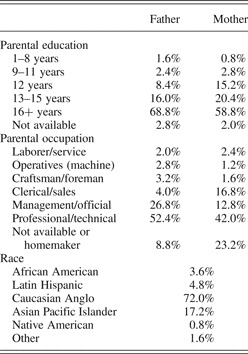
The 258 participants in the LSPD were drawn initially from a population consisting of 2,000 first-year undergraduate students (Lenzenweger, Reference Lenzenweger1999; Lenzenweger et al., Reference Lenzenweger, Loranger, Korfine and Neff1997; Lenzenweger, Johnson, et al., 2004). The participants were recruited from both the private and public (State University of New York) colleges at Cornell University in Ithaca, New York, which helped to ensure diversity across sociodemographic background variables. All participants gave voluntary written informed consent and received an honorarium of $50.00 at each wave of data collection. Extensive detail concerning the initial subject selection procedure and sampling is given elsewhere (Lenzenweger, Reference Lenzenweger1999; Lenzenweger et al., Reference Lenzenweger, Loranger, Korfine and Neff1997). Of the initial 258 participants, 250 completed all three assessment waves and are included in our current analysis. We summarize a selection of their individual characteristics in Table 1.
Descriptive statistics and selected demographic characteristics of participants in the Longitudinal Study of Personality Disorders sample (N = 250)

Initial screening measure
IPDE DSM-III-R Screen (IPDE-S)
The IPDE-S is a 250-item self-administered true–false PD screening inventory developed by A. W. Loranger. The diagnostic efficiency and psychometric properties of the IPDE-S, in a two-stage screen application, were generally excellent and have been described previously (Lenzenweger et al., Reference Lenzenweger, Loranger, Korfine and Neff1997). The grouping variable for the study participants described below was based on this measure and is, thus, retained as a control variable in the analyses we report; specific scores from the IPDE-S are not used in the analyses.
Outcome measures
Personality disorder assessments
IPDE
The IPDE is the well-known semistructured interview procedure that assesses both DSM and ICD-10 PD features (Loranger, Reference Loranger1999; Loranger et al., Reference Loranger, Sartorius, Andreoli, Berger, Buchheim and Channabasavanna1994; Loranger, Sartorious, & Janca, 1996), and was used in the World Health Organization/Alcohol, Drug Abuse, and Mental Health Administration sponsored International Pilot Study of Personality Disorders (Loranger et al., Reference Loranger, Sartorius, Andreoli, Berger, Buchheim and Channabasavanna1994, Reference Loranger, Sartorius and Janca1996). The IPDE has excellent psychometric properties, and it has been shown to be robust as a diagnostic assessment tool for PDs even in the face of mental state (anxiety, depression) changes. The DSM-III-R criteria were assessed in this study because these were the criteria in effect at the time the LSPD was undertaken. We note the DSM-III-R and the later DSM-IV criteria bear considerable resemblance to one another and the fundamental PD constructs are the same in both nomenclatures. Clinically experienced interviewers received intensive training in IPDE administration and scoring by Armand W. Loranger, and were supervised throughout the project by the first author, who was blind to the participants' identity, putative PD status, and all prior assessment information. The interrater reliability for IPDE assessments (based on intraclass correlation coefficients) was excellent at all three waves, ranging between .84 and .92 for all PD dimensions. The interviewers were (a) blind to the putative PD group status of the participants, (b) blind to all prior LSPD PD assessment data, and (c) the same interviewer never assessed the same subject more than once. We defined one of our SZDPD outcome variables as the dimensional score total for the disorder derived from the IPDE.
Millon Clinical Multiaxial Inventory—II (MCMI-II)
The MCMI-II (Choca & Van Denberg, Reference Choca and Van Denburg1997; Millon, Reference Millon1987) is the well-known 175-item, true–false, self-administered inventory of personality pathology designed to coordinate with the DSM-III-R Axis II PDs. The MCMI-II possesses excellent psychometric properties and yields separate dimensional scores for each of the 11 Axis II PDs (Millon, Reference Millon1987). We defined our other SZDPD outcome variable as the scale score for the disorder derived from the MCMI-II, specifically the SZDPD base rate corrected score (BR; for technical detail on BR scores, see Millon, Reference Millon1987).
Axis I diagnostic measure
Structured Clinical Interview for DSM-III-R Disorders: Nonpatient Version (SCID-NP)
The SCID-NP (Spitzer, Williams, Gibbon, & First, Reference Spitzer, Williams, Gibbon and First1990) is a semistructured DSM-III-R Axis I clinical interview for use with nonpatients. The clinical interviewers were trained on the use of the SCID-NP using the videotape-based training system provided with the SCID-NP. All interviewers achieved high reliability with criterial cases (intraclass correlation coefficients > .80 for symptom assessments). The SCID interview was done first followed by the IPDE as is customary practice for thorough Axis II assessments. The Axis I diagnostic information generated by the SCID is not a primary focus of this report, although we do note the results of some sensitivity analyses that incorporate data from the SCID later in this report.
Predictors
Because our questions focus on change, time is the principal “Level 1” predictor in our analyses. It was measured in years from a subject's entry into the study. Although all participants contributed three waves of data, each being assessed repeatedly on the same schedule, the time between assessments varied marginally from subject to subject because of the practical constraints of data collection. For instance, the average age of participants at each was therefore 18.78 years (SD = 0.51) at the first wave, 19.83 years (SD = 0.54) at the second wave, and 21.70 years (SD = 0.56) at the third wave. To implement the latent growth analysis, which buys some of its analytic sophistication at the expense of the flexibility of the individual growth modeling approach, we needed to assume a common measurement schedule across all participants, and so we set the times of measurement for each person equal to their between-person averages, at each wave. Declaring the origin of time as entry into the study, then, in our analyses time takes on the values of 0, 0.95 and 2.82 years at the first, second, and third waves, respectively. In our analyses, we then took the natural logarithm of its values (i.e., time value + 1) before incorporating time into out Level 1 models to linearize the individual growth trajectories and promote efficiency in the estimation in the latent growth models (Singer & Willett, Reference Singer and Willett2003). Thus, the transformed time values (see Appendix A) were 0.00, 0.67, and 1.34.
Temperament
The EAS Adult Temperament Scale (Buss & Plomin, Reference Buss and Plomin1984), is a 20-item self-report measure, for use with adults, of the three major temperament constructs, emotionality (E) (which breaks down further to “fear,” “distress,” and “anger” subdimensions), activity (A), and sociability (S), which are thought to underlie personality processes in children and adults. The EAS requires a subject to read 20 statements and decide how characteristic or typical each statement is of him/herself on a 5-point scale. Factor analysis of the childhood and adult versions of the EAS has revealed a consistent structure that supports the basic three temperaments model of Buss and Plomin (Reference Buss and Plomin1984; see also Mathieson & Tambs, Reference Mathieson and Tambs1999; Nærde, Røysamb, & Tambs, Reference Nærde, Røysamb and Tambs2004) and test–retest reliability of the Adult EAS is acceptable.
Covariates
Although none of their effects are a principal focus of the findings we report here, we also included three important covariates to control for intrinsic features of the study's sampling and research design, in all of our analyses. These were (a) the subject's age at entry into the study, (b) the subject's assignment to putative PD risk group prior to study onset, and (c) the subject's sex. Age-at-entry was measured in years and was included to account for marginal heterogeneity in the ages of participants at the beginning of the study. The group variable described participants' initial assignment (established prior to IPDE and MCMI-II data collection) to either a “possible personality disorder” (PPD) or “no personality disorder” (NPD) group according to the IPDE-Screen (IPDE-S; Lenzenweger, Reference Lenzenweger1999; Lenzenweger et al., Reference Lenzenweger, Loranger, Korfine and Neff1997). As detailed in Lenzenweger at al. (1997), PPD participants met the diagnostic threshold on the IPDE-S for at least one specific DSM-III-R PD, whereas NPD participants: (a) did not meet the DSM-III-R defined threshold for diagnosis, and (b) had fewer than 10 PD features across all disorders on the screener (see Lenzenweger, Reference Lenzenweger2006, for greater detail). Five PPD and three NPD participants did not complete all three waves of data collection; two of these noncompleting participants died during the course of the study, one in each subject group. Control predictor male identified the subject as either male or female: the sample contained 121 males (47%) and 137 females (53%). We also included a two-way interaction of the group and sex predictors as a covariate in our analyses.
Statistical analysis
As noted above, to evaluate the simultaneous impact of individual change in emotionality, activity, and sociability on individual change in the SZDPD features on the IPDE and MCMI-II over time, we adopted a latent growth modeling approach (Willett & Bub, Reference Willett, Bub, Everitt and Howell2005; Willett & Keiley, Reference Willett, Keiley, Tinsley and Brown2000). Under this approach, we used the Y and X measurement submodels present within the general covariance structure model to specify individual growth models for our time-varying outcome and for all three (emotionality, activity, and sociability) of our time-varying predictors simultaneously. With only three waves of data on both outcome and predictors for each subject, we were limited in the complexity of our growth specification. Consequently, after preliminary graphical exploration, we specified linear trajectories to represent change over time in each of the measures. Thus, individual trajectories of change in the outcome and each of the predictors are implicitly represented, in each case, by a “true initial status” and a “true rate of change” parameter for each participant. Then, in the standard structural component of the general covariance structure model, we specified Level 2 relationships among the respective individual growth parameters to articulate our hypotheses about the prediction of change in SZDPD features over time by changes in emotionality, activity, and sociability.
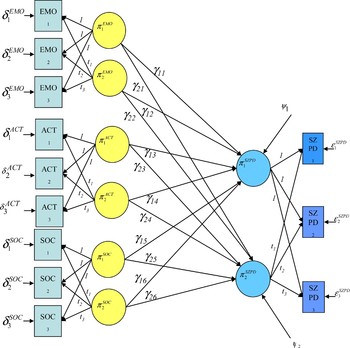
In Figure 1, we present a simplified path diagram that displays, for a generic SZDPD features outcome (for either IPDE or MCMI-II data), the several hypothesized measurement models and structural model that underpin our covariance structure analyses. As noted above, the Y and X measurement models on the right and left sides of the path model, respectively, specify the hypothesized Level 1 change trajectories in the outcome and the predictors, and the structural model that occupies the center of the path diagram defines the hypothesized Level 2 relationships among the individual growth parameters. Although we included additional control variables (as described above) in all of our statistical models as predictors of change in SZPD features, we have omitted them from the path diagram in Figure 1 to avoid clutter. It is easy to see how this kind of path model could easily be extended to incorporate any number of additional outcomes and predictors, each changing over time, and each measured on its own schedule of data collection. It would even be possible to generalize the latent growth model to accommodate differing numbers of waves of data for each outcome and predictor.
The hypothesized path model depicting the relationships among true initial status (elevation) and true rate of change in four personality indicators of neurobehavioral systems and true initial status (elevation) and true rate of change in personality disorder (PD) symptomatology over time (control predictors omitted for clarity, see text for additional details). [A color version of this figure can be viewed online at journals.cambridge.org/dpp]

We fitted the complete path model to our longitudinal data using the LISREL software (Version 8.7; Jöreskog & Sörbom, Reference Jöreskog and Sörbom2004), separately for each of the two SZPD outcome measures (IPDE—interview; MCMI-II—self-report). Appendix A presents the LISREL VIII program for fitting the basic latent growth model discussed here.
As can be seen in Figure 1, having three waves of longitudinal data available on each outcome and predictor permitted us to specify individual growth models in which predictors describing participants' emotionality, activity, and sociability were hypothesized simultaneously to be linear functions of time. This implied the presence, in the path model, of three latent constructs representing the true initial levels (or elevations, π 1EMOT, π 1ACT, π 1SOC) and true slopes (or rates of change, π 2EMOT, π 2ACT, π 2SOC) of the growth trajectories for these neurobehavioral indicators. Growth in the total SZDPD features (IPDE or MCMI-II), was similarly specified in the latent growth model, yielding another pair of latent constructs that represented the true initial level (π 1SZDPD) and true rate of change (π 2SZDPD) of the PD features growth trajectory in each of the clusters. Then, the individual latent growth parameters representing change over time in emotionality, activity, and sociability were hypothesized to predict the latent growth parameters that represented change in SZDPD features in the structural part of the path model, providing 12 structural regression parameters (gammas) that were the focus of our analytic attention and addressed our research questions.
In an initial round of statistical analysis, we fitted the “full” path model specified in Figure 1 (including all covariates) for each of our two outcomes (IPDE SZDPD and MCMI-II SZDPD features). Then, we tested sequential nested hypotheses to ascertain a parsimonious final fitted model in which we omitted several of the originally hypothesized paths because they were not required (for a description of this approach, see Singer & Willett, Reference Singer and Willett2003). We provide parameter estimates and associated inferential statistics for both the “full” and the “reduced” models later in the paper. A full taxonomy of fitted models is available from the first author, on request. All hypothesized latent growth models were fitted assuming that the Level 1 measurement errors were homoscedastic over time, within each growth process, because supplementary analyses in which the errors were permitted to be heteroscedastic confirmed that this was reasonable. Finally, we also conducted sensitivity analysis in which we fit models in which we included two additional predictors of true initial level and true rate of change in the SZDPD dimensions, namely, the presence or absence of any form of Axis I disorder before or during the study period as well as the presence or absence of any form of psychological/psychiatric treatment before or during the study period, as predictors. We detected no important differences in our findings on inclusion of these covariates.
Results
Clinical characteristics of the sample
The lifetime DSM-III-R Axis I diagnoses for study participants have been reported previously (Lenzenweger, Reference Lenzenweger1999; Lenzenweger, Johnson, et al., 2004). In overview, 81 (62.8%) of the PPD participants received a definite or probable Axis I diagnosis compared to 32 (26.4%) NPD participants (χ 2 = 33.30, df = 1, p < .00001). Forty-one (31.8%) PPD participants versus 21 (17.4%) NPD participants reported a prior history of treatment by Wave III (χ 2 = 6.97, df = 1, p < .008). Finally, at Wave I, 11% of the participants qualified for an Axis II diagnosis of some sort. The raw rates of diagnosed PDs in the LSPD sample as of Wave I were as follows: 1.2% paranoid, 1.2% schizoid, 1.6% schizotypal, 0.8% antisocial, 1.6% borderline, 3.5% histrionic, 3.1% narcissistic, 1.6% obsessive–compulsive, 0.8% passive–aggressive, 1.2% avoidant, 0.8% dependent, and 4.3% PD—not otherwise specified. Moreover, as of the Wave III assessment (i.e., 4 years, 16% of the sample received a probable or definite diagnosis for at least one Axis II PD (or PD—not otherwise specified). Thus, by Wave III, approximately one in every six participants in the sample met formal DSM-III-R thresholds for PD diagnoses based on the highly conservative IPDE (Loranger, Reference Loranger1999). When converted to weighted population prevalence rates (see Lenzenweger, Reference Lenzenweger2006), the rates of diagnosed PD accord well with estimates for the general population of the United States (Lenzenweger, Lane, et al., 2007).
Baseline (Wave I) associations among temperament and SZDPD measures
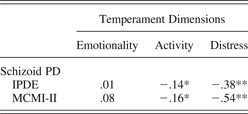
Although the principal focus of this report is the latent growth analysis that we report next, we anticipate that some psychopathologists would have an interest in the baseline (Wave I) associations that were observed between the two measures of SZDPD and the temperament variables. We present these statistics in Table 2. Inspection of the table reveals that SZDPD has a robust inverse relationship with sociability (large effects) across both clinical measures and activity has a modest, but statistically significant, inverse relationship (small effects) with activity across both clinical measures. At baseline, SZDPD has very weak associations with the emotionality temperament dimension.
Latent growth analyses
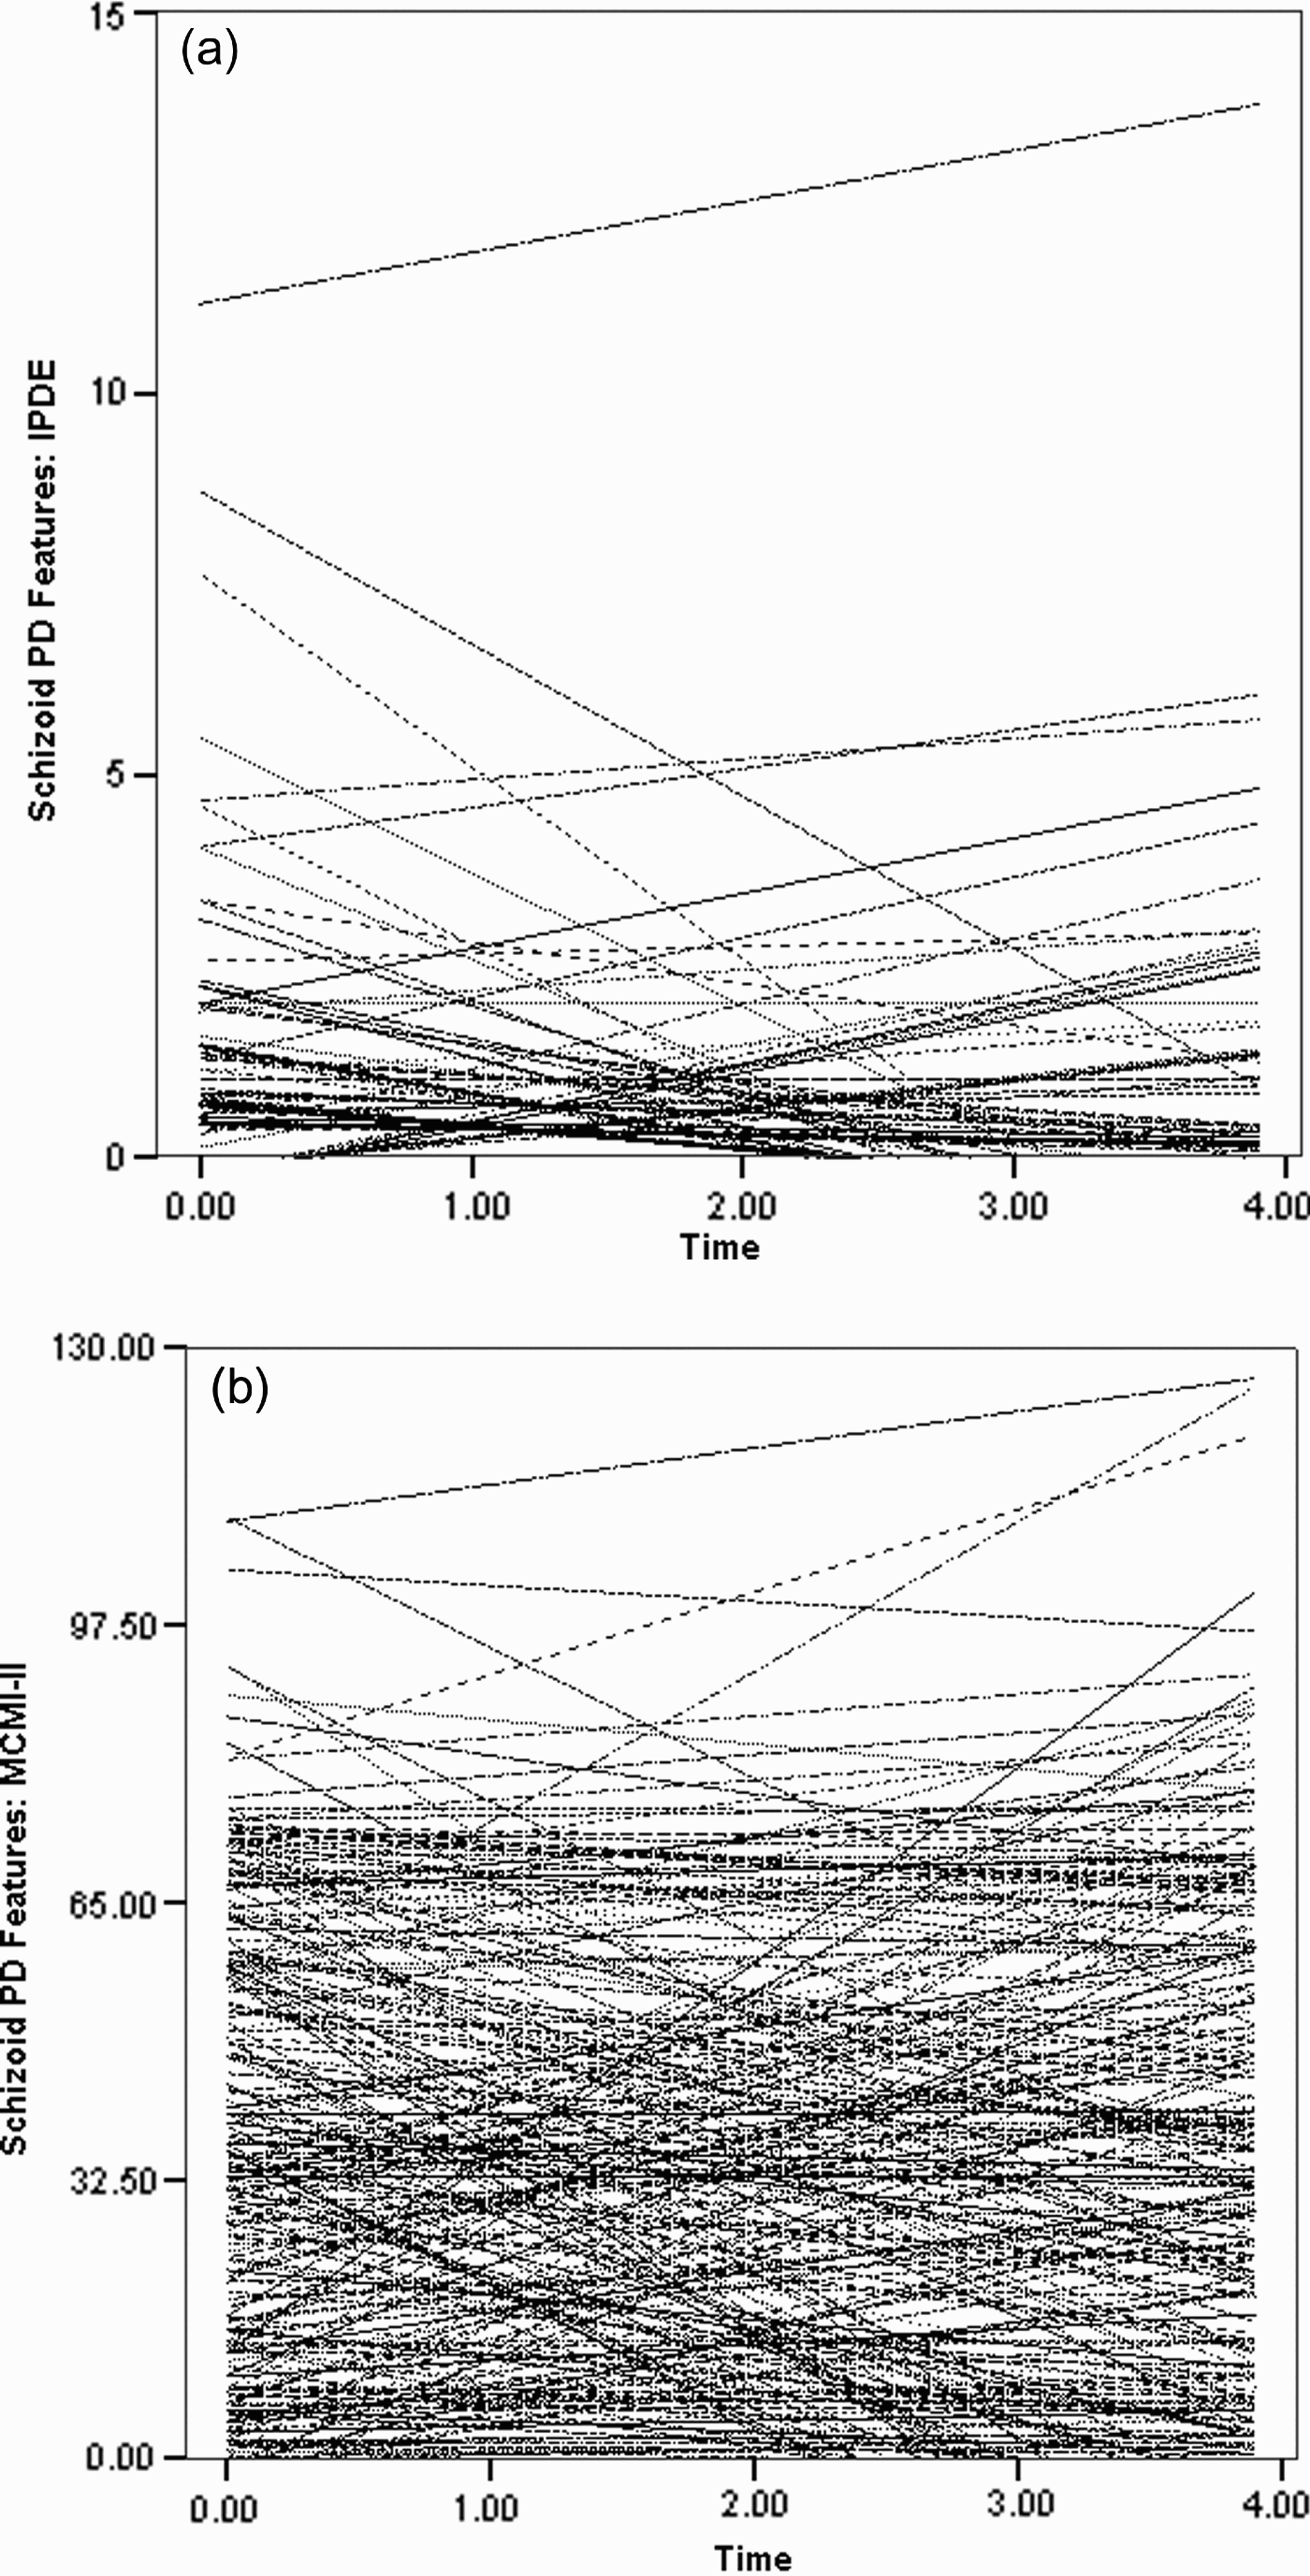
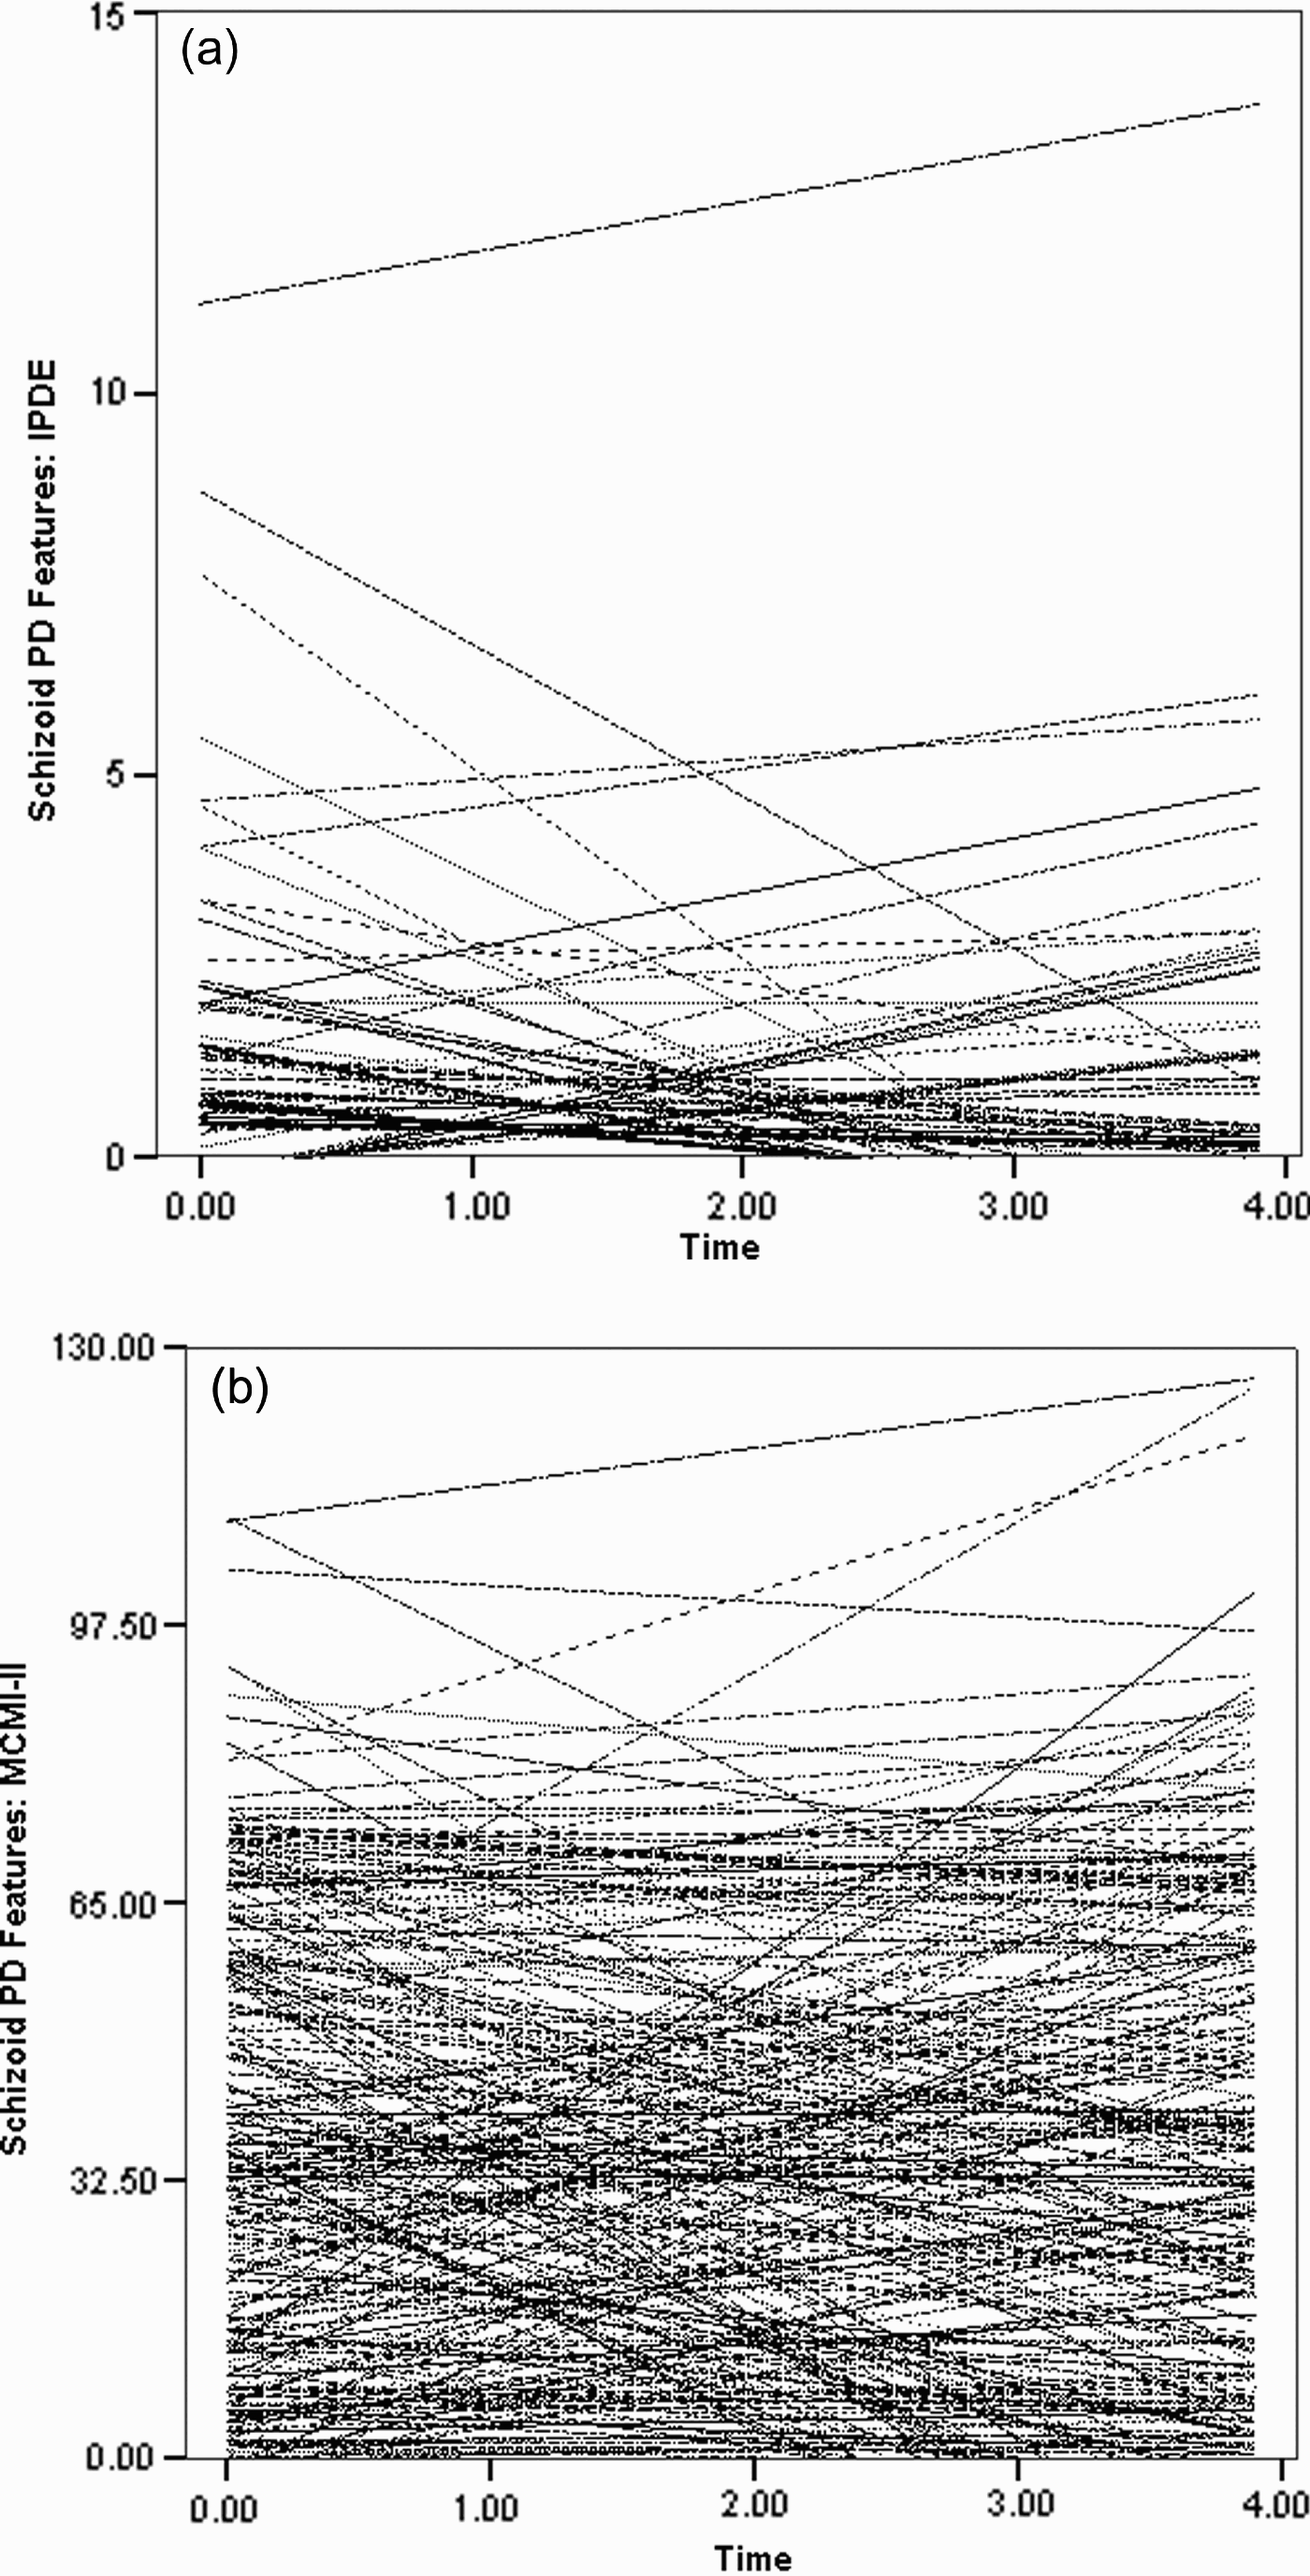
The variability in SZDPD growth across participants that we sought to model as a function of temperament in this approach is evident in Figure 2. In exploratory analyses, Figure 2 presents individual ordinary least squares fitted growth curves for each of the 250 participants in the LSPD across the study period. The most striking aspect of this collection of empirical individual growth trajectories for both the IPDE and MCMI-II SZDPD features scores is the large heterogeneity that is evident in the observed growth. Clearly, the participants did not all follow the same trajectory, nor did their outcome values remain completely consistent over time, as would have been predicted by the DSM definition of PD. Indeed, although some participants' SZDPD features scores did, in fact, remain largely unchanged over time, others lost SZDPD features over time and yet others developed more SZDPD features over time. It was this variability in SZDPD growth that we sought to model as a function of change in temperament, in our latent growth analyses.
Individual ordinary least-squares fitted growth trajectories in schizoid personality disorder features for 250 participants over the study period. Time is reported in years since the beginning of the study, and it is centered for each subject using the subject's age at entry into the study. (a) The International Personality Disorder Examination (IPDE; Loranger, Reference Loranger1999) assessments and (b) the Millon Clinical Multiaxial Inventory—II (MCMI-II; Millon, Reference Millon1987) assessments.
Bivariate correlations among temperament and schizoid personality disorder (N = 250) at baseline (Wave 1)
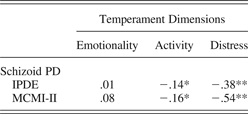
Note: Values are Pearson product-moment correlation coefficients with two-tailed p values. PD, personality disorder; IPDE, International Personality Disorder Examination (Loranger et al., Reference Loranger, Lenzenweger, Gartner, Susman, Herzig and Zammit1991); MCMI-II, Millon Clinical Multiaxial Inventory—II (Millon, Reference Millon1987). Temperament dimensions of emotionality, activity, and distress were assessed using the Buss and Plomin (Reference Buss and Plomin1984) EAS Adult Temperament Scale.
*p < .05. **p < .01.
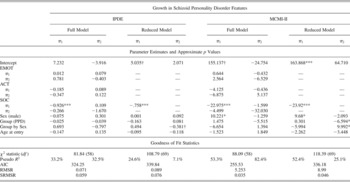
Table 3 reports our full and reduced fitted latent growth models for each of the two SZDPD outcomes (IPDE and MCMI-II). We present parameter estimates, approximate p values and selected goodness of fit statistics (goodness of fit chi square, Akaike information criterion, root mean square residual, standardized root mean square residual) for all fitted models. We also report a pseudo-R 2 statistic describing the success of the prediction of variability in each SZDPD growth parameter in each model. This latter statistic is akin to the adjusted R 2 statistic, more familiar in regular regression analyses, and estimates the proportion of variance in the relevant SZDPD growth parameter that has been explained simultaneously by all predictors in the particular model. The overall average trend for SZDPD growth over the study period was toward a lessening of SZDPD features with the passage of time; however, there were indeed a nontrivial number of cases where SZDPD symptomatology worsened (i.e., increased) with time. We now discuss the results for the IPDE and MCMI-II measures of SZDPD separately.
Predicting individual growth in schizoid personality disorder features (true initial status and true rate of change) by individual growth in temperament dimensions of emotionality, activity, and sociability (N = 250)

Note: The table contains parameter estimates and approximate p values from the structural portion of selected full and reduced (final) fitted latent growth models for the interview (IPDE) and self-report (MCMI-II) data. IPDE, International Personality Disorder Examination (Loranger et al., Reference Loranger, Lenzenweger, Gartner, Susman, Herzig and Zammit1991); MCMI-II, Millon Clinical Multiaxial Inventory—II (Millon, Reference Millon1987); π 1, true initial status; π 2, true rate of change; EMOT, emotionality temperament dimension; ACT, activity temperament dimension; SOC, sociability temperament dimension; AIC, Akaike information criterion; RMSR, root mean square residual; SRMSR, standardized root mean square residual. Sex is coded 1 = male, 0 = female; Group (PPD) is coded 1 = probable personality disorder, 0 = normal control.
†p < .10. *p < .05. **p < .01. ***p < .001 (two tailed).
With respect to the IPDE SZDPD results, we found that in the full model, which included the full array of temperament dimensions as well as all control variables (sex, group, Group × Sex interaction, and age at study entry), the true initial status of sociability was inversely related to true initial SZDPD status. No other temperament nor control variable predicted the true initial status of SZDPD. In terms of rate of change in the SZDPD features from the IPDE, no predictor among the temperament or control variable set was statistically significantly related to true rate of change. We fitted a reduced model that included the true initial level of sociability in the prediction of true initial status of SZDPD as well as the control variables as predictors of both true initial status and true rate of change in SZDPD. Not unlike the results for the full model, true initial status of sociability was inversely related to true initial status levels for SZDPD. No other predictors had a statistically significant relationship with true rate of change in SZDPD for the IPDE data, in the reduced model.
With respect to the MCMI-II SZDPD results, we found that in the full model, which also included the full array of temperament dimensions as well as the control variables (sex, group, Group × Sex interaction, and age at study entry), again true initial status of sociability was inversely related to the true initial SZDPD status of the participants. In this analysis, subject sex was also associated with true initial status of SZDPD, with males exhibiting higher levels. No other temperament or control variables were related to true initial status of SZDPD. In terms of rate of change in the SZDPD features from the MCMI-II, no predictor in the temperament or control variable set was statistically significantly related to true rate of change in SZDPD features.
We again fitted a reduced model that included the true initial level of sociability as a predictor of true initial status of SZDPD as well as the control variables as predictors of both true initial status and true rate of change in SZDPD. Not unlike the results for the full model, true initial status of sociability was inversely related to true initial status levels for SZDPD. In the reduced model, as before, males exhibited higher levels of true initial status of SZDPD features. With respect to the rate of change in SZDPD features on the MCMI-II, there were no statistically significant predictors of the true rate of change in SZDPD features in the full model. However, of interest, in the reduced model, we found a statistically significant relationship between the “Subject Group [PPD vs. NC] × Sex interaction” and true rate of change in SZPD such that male/PPD participants exhibited a positive rate of change in SZDPD (i.e., greater amount of symptomatology) over time. There were no other predictors that were related to true rate of change in SZDPD for the MCMI-II data in the reduced model.
Sensitivity analyses: Impact of treatment and/or Axis I
In addition to our primary analyses of SZDPD described above, we also conducted sensitivity analyses to evaluate the impact of the presence or absence of any Axis I disorder and/or the presence or absence of any form of psychiatric/psychological treatment in the participants either before, or during, the study period on the growth observed for the SZDPD feature dimensions on the IPDE and MCMI-II. We believed that this was a reasonable set of analyses to undertake given the possibility that comorbid Axis I pathology might alter the growth trajectories, as might the impact of any form of treatment. We found that the presence of any form of Axis I disorder either before or during the study period was unrelated to true rate of change for SZDPD features over time, and that the presence of any form of psychiatric/psychological treatment was also unrelated to true change for SZDPD features over time.
Discussion
The emerging corpus of empirical results from the longitudinal study of personality pathology suggests that the disorders are considerably more flexible and plastic than previously thought. Indeed, the prevailing doctrine in psychiatry and clinical psychology over the past 100 years held that PDs are stable, enduring, and traitlike. Like the other PDs for which data on long-term growth are now available, SZDPD also shows evidence of flexibility, change, and malleability. The data from the LSPD for SZDPD underscore this flexibility for SZDPD on both structured diagnostic interview assessments as well as self-report scores on a psychometric inventory. In this study, we sought to determine if changes in temperament over time were in some manner related to growth in SZDPD over time. The overall thrust of our findings was that true rate of change in any of three core temperament dimensions (emotionality, activity, sociability) was essentially unrelated to true rate of change in SZDPD over time. The only statistically significant predictive relationship that we found for a temperament construct was with sociability. That finding was relatively straightforward in that we found that participants with lower initial levels of sociability exhibited higher initial levels of SZDPD, for both the IPDE and MCMI-II data. This consistency in finding across the self-report and interview assessment instrument modalities was encouraging and suggested to us that sociability, perhaps reflective of the underlying affiliation system (see Depue & Lenzenweger, Reference Depue, Lenzenweger and Livesley2001, Reference Depue, Lenzenweger, Lenzenweger and Clarkin2005), was an important determinant of schizoid symtomatology. It also accord well with a prior analysis of growth in the Cluster A symptomatology in the LSPD study participants in relation to growth in communal positive emotion (affiliation; Lenzenweger & Willett, Reference Lenzenweger and Willett2007), such that initial levels of communal positive emotion were inversely related to initial levels of Cluster A features (on the IPDE). Somewhat surprising to us was that changes in emotionality, which consists of anxiety, fear, and anger, were not associated either with true initial level or rate of change in SZDPD. This was surprising, because a wealth of clinical observation and conjecture (see Bernstein et al., Reference Bernstein, Arntz, Travaglini, Blaney and Millon2009) suggests that considerable fear and anxiety attend schizoid pathology. It is possible, however, that with only three waves of data available on the outcome and predictors, that we did not have sufficient statistical power to detect these relationships. The statistical power of any longitudinal research design, and the reliability with which we can estimate individual true rate of change (Singer & Willett, Reference Singer and Willett2003), are strongly dependent on the number of waves of data that have been collected, providing a considerable incentive for including additional waves of data in any panel. Finally, one aspect of our results raises an interesting methodological question for us, namely, why was it that male/PPD participants showed a higher (positive) rate of change (worsening of SZDPD) over time on the MCMI-II, but not on the IPDE? Could it be that in some instances, male participants with some evidence of pathology might be more disclosing on a psychometric inventory than in an interview? We hope to pursue this issue in subsequent analyses.
One of the interesting developmental questions that arose for us in this set of analyses concerned the ultimate fate of participants with elevated SZDPD features. Could it be the case that for some participants with noteworthy SZDPD features at study entry cease to show SZDPD features over time because their psychopathology has shifted somewhat, perhaps toward more severe Cluster A or (even) psychotic phenomenology? There are few data bearing upon this developmental question; however, a hint of this possibility comes from the interesting work of Sula Wolff. She and her colleagues (Wolff, Townshend, McGuire, & Weeks, Reference Wolff, Townshend, McGuire and Weeks1991) assessed adult longitudinal outcomes in children initially diagnosed as schizoid. A considerable proportion (i.e., 75%) of those children initially diagnosed as schizoid went on to develop more clearly identifiable schizotypal (as opposed to schizoid) personality disorder features in adulthood. In fact, of those studied (n = 32), two went on to develop clinically diagnosed schizophrenia. Thus, the import of the Wolff et al. (Reference Wolff, Townshend, McGuire and Weeks1991) findings for the present study is that longer term longitudinal followup may shed light on this critical question: Do many of the more severely affected schizoid LSPD participants go on to develop schizotypal disorders (or schizotypal features) as they move into the later decades of life? Would such conversion to schizotypal PD be associated with identifiable changes in temperament or would this reflect, perhaps, the developmental unfolding of a schizophrenia-related liability (as opposed to a temperament based alteration)? We hope to examine this possibility as we develop a methodological extension of the present latent growth curve approach for that purpose.
On a broader methodological note of interest, the latent growth modeling approach that we utilized here offers powerful advantages in the study of the predictors of change or growth in developmental psychopathology research. This is particularly true with respect to systems that involve multiple component parts or processes that could be affecting (or be correlated with) a given outcome simultaneously. For example, as it is likely that SZDPD (and all PDs for that matter) features reflect the phenotypic manifestations of multiple dynamic interactive neurobehavioral systems at work and each of these interactive systems themselves likely show change and growth across the life course, then an understanding of this process requires an appropriate analytic strategy that must be able to handle simultaneous growth in several systems, as well as take various background variables into account (e.g., sex, age). Our latent growth modeling approach achieves this goal as it unifies the powerful growth curve methodology (Rogosa, Brandt, & Zimoski, Reference Rogosa, Brandt and Zimowski1982; Rogosa & Willett, Reference Rogosa and Willett1985) that has proven so useful in the investigation of change in psychological and behavioral phenomena over time with the flexibility of covariance structure analysis. In this way, we have been able to move freely through an exploration of the impact of multiple important variables, some changing (emotionality, activity, sociability) and others not (sex, group status, age at entry), in predicting growth in SZDPD. We also note that our present approach for investigating “growth on growth” represents a compelling and superior statistical alternative to the analysis of cross-lagged correlations, which has been a common, but problematic (Rogosa, Reference Rogosa1980), way of examining relationships between two variables that are changing simultaneously over time.
In exploring SZDPD data from the LSPD, it has become evident to us that it is likely that our study sample, like many in all areas of psychopathology research, probably contains an admixture of participants. For example, our sample contains a proportion of participants that were unimpaired at the baseline entry point of the study and remained so throughout the study period. Such participants reside within the data set and, in a manner of speaking, they have their own (somewhat) unique growth pattern: they show no growth and inflate the data set with zero values (i.e., known statistically as “zero inflation”). This suggests to us that the potential utility of using mixture modeling approaches, which have proven useful in other psychopathology efforts (e.g., Lenzenweger, Clarkin, Yeomans, Kernberg, & Levy, Reference Lenzenweger, Clarkin, Yeomans, Kernberg and Levy2008; Lenzenweger, McLachlan, & Rubin, Reference Lenzenweger, McLachlan and Rubin2007; Lenzenweger & Moldin, Reference Lenzenweger and Moldin1990), to parse the observed growth trajectories of the LSPD participants into identifiable latent growth mixture components (Muthén, Reference Muthén and Kaplan2004, Reference Muthén2006; Nagin, Reference Nagin1999, Reference Nagin2005; Nagin & Tremblay, Reference Nagin and Tremblay2001; see also Connell & Frye, Reference Connell and Frye2006).
Several caveats must also be considered with these data. First, the LSPD sample is clearly more homogenous in age, educational achievement, and social class than the US population at large as well as consists of young adults, features that may have differentially affected the study results. Perhaps the most effective way to assess the generalizability of findings from the LSPD is to evaluate whether prior core LSPD findings have been replicated, and they have. For example, the LSPD-based estimate for PD prevalence in the community (11%; Lenzenweger et al., Reference Lenzenweger, Loranger, Korfine and Neff1997) has now been broadly replicated several times in US nonclinical community samples (Crawford et al., Reference Crawford, Cohen, Johnson, Kasen, First and Gordon2005; Samuels et al., Reference Samuels, Eaton, Bienvenu, Brown, Costa and Nestadt2002) and the US general population (Lenzenweger, Lane, et al., 2007), as well as in Norwegian (Torgersen, Kringlen, & Cramer, Reference Torgersen, Kringlen and Cramer2001) and United Kingdom (Coid, Yang, Tyrer, Roberts, & Ullrich, Reference Coid, Yang, Tyrer, Roberts and Ullrich2006) samples (for review, see Lenzenweger, Reference Lenzenweger2008). Furthermore, the basic patterns of change in mean levels of general PD features over time initially reported for the LSPD sample (Lenzenweger, Reference Lenzenweger1999) were subsequently replicated in both clinical (Shea et al., Reference Shea, Stout, Gunderson, Morey, Grilo and McGlashan2002; Zanarini et al., Reference Zanarini, Frankenburg, Hennen and Silk2003) and nonclinical community (Johnson et al., Reference Johnson, Cohen, Kasen, Skodol, Hamagan and Brook2000) samples. Thus, although the present sample is somewhat more compressed in terms of demographic background characteristics, this has not lead to findings at odds with those obtained in other epidemiological or longitudinal PD research. As noted above, the prevalence of SZDPD in the population tends to run in the range of 1.0%, which was precisely the rate of SZDPD in the population studied here.
Second, we also note that adjustment to university life across the college years may have played some role in the changes we observed. However, we do note that the IPDE specifically requires one to respond after reflecting on 5 years of behavior (not just the current time or recent past) (Loranger, Reference Loranger1999), and it is relatively robust in the face of mental state alterations (Loranger et al., Reference Loranger, Lenzenweger, Gartner, Susman, Herzig and Zammit1991). Third, given that the LSPD participants were selected from a population of first-year university students, the sample may have been somewhat censored for a portion of the most severely PD affected individuals. However, one must be cautious in ascribing undue levels of mental health to participants who happen to be selected for academic achievement as such selection does not confer immunity to psychopathology. In fact, several forms of PD might actually be enriched in such a sample (e.g., obsessive–compulsive PD, narcissistic PD, schizoid PD). To this end, we note that 16% (or one in every six) of the LSPD sample participants was diagnosed with a formal Axis II disorder by the end of the study period (i.e., by Wave III) using the highly conservative IPDE. Many other participants met intermediate levels of PD criteria (e.g., two or three criteria) that fell short of DSM diagnostic threshold counts, but indicated the presence of some degree PD disturbance of clinical intensity nonetheless according to the IPDE. Such intermediate levels of PD pathology are frequently seen even in clinical samples (e.g., Loranger et al., Reference Loranger, Lenzenweger, Gartner, Susman, Herzig and Zammit1991). We note also that 45.2% of the LSPD participants had a lifetime (or current) Axis I disorder by the end of college and these data are broadly consistent with the ubiquitous nature of Axis I disorders in the US population (see Kessler, Chiu, Demler, & Walters, Reference Kessler, Chiu, Demler and Walters2005; Kessler et al., Reference Kessler, McGonagle, Zhao, Nelson, Hughes and Eshleman1994).
Fourth, we are mindful that there may be other predictors of change in personality disorder. Some may be a consequence of important time-varying processes (e.g., other personality factors), whereas others may not (e.g., presence of severe childhood sexual abuse would be a time invariant predictor). Thus, there may well be other factors that would be predictive of true rate of change in the PDs over time. We hope to establish such hypotheses, and probe the LSPD database more deeply in terms of SZDPD as well as the other PDs, in the coming years to explore such possibilities as well as collect additional data relevant to this possibility upon upcoming Wave IV and Wave V assessments. On a related note, it may also be the case that some of the DSM PDs may not reflect solely the functioning of personality systems, specifically the Cluster A PDs. It may be the case that paranoid and schizotypal PDs represent variants of schizophrenia and thus are less related to personality (cf. Lenzenweger, Reference Lenzenweger, Lenzenweger and Dworkin1998). Finally, we emphasize that our research design is observational not experimental and so, although we have specified the hypothesized direction of relations in the growth model, we cannot address questions of causation. The temperament systems studied here are thought to reflect underlying neurobehavioral, brain-based systems and they may be, in part, responsible ultimately for personality and personality disorder; however, our data analyses cannot test these conjectures.
It has long been assumed that SZDPD and the other PDs are in place relatively early in the life course (i.e., late adolescence, early adulthood; see DSM; APA, 1980, 1987, 1994) and that they stay in place for the most part across the life span, as if carved in granite. In our prior analyses of the LSPD (Lenzenweger, Reference Lenzenweger1999; Lenzenweger, Johnson, et al., 2004) data, we have reported evidence of flexibility in most PD features over time, a fact that challenged this long-held assumption regarding the traitlike quality of PDs over time. In short, those prior reports documented that an appreciable amount of change was occurring in the PDs on average over time. However, those reports did not specify what was driving, or was correlated with, such change. The present paper extends those initial observations by using an approach that seeks to identify the temperament variables (constructs) that do (or do not) predict individual change in PD features over time, thus moving from a merely descriptive to a more explanatory, model-testing research posture. Although William James (Reference James1890, p. 121) claimed “by the age thirty, the character has set like plaster, and will never soften again,” we now know this is true only for some some aspects of normal personality (Srivastava, John, Gosling, & Potter, Reference Srivastava, John, Gosling and Potter2003; Roberts, Walton, & Viechtbauer, Reference Roberts, Walton and Viechtbauer2006). Of importance, we now know, insofar as one might want to suggest SZDPD is a form of character or personality, SZDPD is not set like “plaster” at an early age with little prospects for change as assumed by the official psychiatric nomenclature and common clinical lore (Johnson et al., Reference Johnson, Cohen, Kasen, Skodol, Hamagan and Brook2000; Lenzenweger, Reference Lenzenweger1999; Lenzenweger, Johnson, et al., 2004; Shea et al., Reference Shea, Stout, Gunderson, Morey, Grilo and McGlashan2002; Zanarini et al., Reference Zanarini, Frankenburg, Hennen and Silk2003). Our research findings provide some initial coordinates for future explorations of those aspects of both temperament and personality disorder where the plaster seems not to harden.
Appendix A
LISREL VIII program for fitting the hypothesized latent growth model in Figure 1

Note: See Willett and Keiley (Reference Willett, Keiley, Tinsley and Brown2000) and Singer and Willett (Reference Singer and Willett2003) for extended discussion of other examples of using covariance structure analysis to model multivariate change over time.