INTRODUCTION
The genus Theileria is part of the Piroplasmida (Phylum: Apicomplexa) and is transmitted by ixodid ticks to vertebrate hosts (Bishop et al. Reference Bishop, Musoke, Morzaria, Gardner and Nene2004). In the Bovini (African buffalo, Asiatic water buffalo and cattle) four main groups include the Theileria buffeli, Theileria mutans, Theileria velifera and Theileria taurotragi clades (Mans et al. Reference Mans, Pienaar, Latif and Potgieter2011a ). Genotypes within the T. buffeli, T. mutans and T. velifera clades are considered to represent populations of the same species (Chae et al. Reference Chae, Allsopp, Waghela, Park, Kakuda, Sugimoto, Allsopp, Wagner and Holman1999; Gubbels et al. Reference Gubbels, Hong, van der Weide, Qi, Nijman, Guangyuan and Jongejan2000). However, differences in host preference, clinical pathology, vector specificity and genetics are challenging this (Chae et al. Reference Chae, Allsopp, Waghela, Park, Kakuda, Sugimoto, Allsopp, Wagner and Holman1999; Gubbels et al. Reference Gubbels, Hong, van der Weide, Qi, Nijman, Guangyuan and Jongejan2000; Mans et al. Reference Mans, Pienaar, Latif and Potgieter2011a , Reference Mans, Pienaar, Potgieter and Latif b ). Genotypes within these clades can have as many as 5–20 nucleotide differences in the 18S rRNA V4 hyper-variable region (Mans et al. Reference Mans, Pienaar, Latif and Potgieter2011a ). In contrast, differences in the ‘T. taurotragi’ clade range from 3–15 nucleotides (Mans et al. Reference Mans, Pienaar, Latif and Potgieter2011a ). The T. taurotragi clade is composed of the recognized species Theileria annulata, Theileria lestoquardi, T. parva and T. taurotragi which have differentiated clinical outcomes in their vertebrate hosts and specific host and vector preferences (Bishop et al. Reference Bishop, Musoke, Morzaria, Gardner and Nene2004). The designation of the T. buffeli, T. mutans and T. velifera genotypes as representatives of the same species in their respective clades is linked to apathogenicity in the vertebrate host and the inability to differentiate them by non-genetic means (Chae et al. Reference Chae, Allsopp, Waghela, Park, Kakuda, Sugimoto, Allsopp, Wagner and Holman1999). The question remains as to what level of genetic diversity would differentiate different Theileria species. In this regard, members of the T. taurotragi clade are of interest, since they are genetically more closely related than genotypes from other clades and may be good models for speciation in the Theileria.
Theileria sp. (buffalo) and T. sp. (bougasvlei) are from the ‘T. taurotragi’ clade and related to T. parva (Zweygarth et al. Reference Zweygarth, Koekemoer, Josemans, Rambritch, Pienaar, Putterill, Latif and Potgieter2009; Mans et al. Reference Mans, Pienaar, Latif and Potgieter2011a ; Pienaar et al. Reference Pienaar, Potgieter, Latif, Thekisoe and Mans2011a ). Pairwise comparisons indicate 3–5 differences between these three genotypes in the 18S rRNA V4 hyper-variable region (Mans et al. Reference Mans, Pienaar, Latif and Potgieter2011a ). Theileria sp. (buffalo) was identified in African buffalo from East Africa based on serological differences with T. parva and later shown to be genetically distinct (Conrad et al. Reference Conrad, Stagg, Grootenhuis, Irvin, Newson, Njamunggeh, Rossiter and Young1987; Allsopp et al. Reference Allsopp, Baylis, Allsopp, Cavalier-Smith, Bishop, Carrington, Sohanpal and Spooner1993). Theileria sp. (buffalo) and T. sp. (bougasvlei) was subsequently shown to be present in buffalo from southern Africa, to be apathogenic and has not yet been found in cattle (Allsopp et al. Reference Allsopp, Theron, Coetzee, Dunsterville and Allsopp1999; Oura et al. Reference Oura, Bishop, Wampande, Lubega and Tait2004, Reference Oura, Tait, Asiimwe, Lubega and Weir2011; Mans et al. Reference Mans, Pienaar, Latif and Potgieter2011a ; Pienaar et al. Reference Pienaar, Potgieter, Latif, Thekisoe and Mans2011a ). Theileria sp. (buffalo) and T. sp. (bougasvlei) affects accurate diagnostics of T. parva in African buffalo using the hybridization PCR assay due to PCR suppression (Sibeko et al. Reference Sibeko, Oosthuizen, Collins, Geysen, Rambritch, Latif, Groeneveld, Potgieter and Coetzer2008; Pienaar et al. Reference Pienaar, Potgieter, Latif, Thekisoe and Mans2011a ). Accurate diagnostics of a T. parva carrier status in African buffalo is important in South Africa, since it is being used as a means to control Corridor disease outbreaks in cattle (Pienaar et al. Reference Pienaar, Potgieter, Latif, Thekisoe and Mans2011a ).
The T. parva hybridization assay amplifies the 18S rRNA V4 hyper-variable region of T. parva, T. sp. (buffalo) and T. sp. (bougasvlei) (Sibeko et al. Reference Sibeko, Oosthuizen, Collins, Geysen, Rambritch, Latif, Groeneveld, Potgieter and Coetzer2008; Pienaar et al. Reference Pienaar, Potgieter, Latif, Thekisoe and Mans2011a ). Genotypes are distinguishable using two probes: the 640 nm probe detects T. parva, while the 705 nm probe detects the Theileria genus (Sibeko et al. Reference Sibeko, Oosthuizen, Collins, Geysen, Rambritch, Latif, Groeneveld, Potgieter and Coetzer2008). The only non T. parva genotypes amplified by the primer set are T. sp. (buffalo) and T. sp. (bougasvlei) (Mans et al. Reference Mans, Pienaar, Latif and Potgieter2011a ). Since the 705 nm probe cannot differentiate these latter genotypes, they were collectively designated T. sp. (buffalo)-like parasites (Pienaar et al. Reference Pienaar, Potgieter, Latif, Thekisoe and Mans2011a ). In cases where mixed infections of T. parva and T. sp. (buffalo)-like parasites occur with higher parasitaemia for the latter parasites, false negative results for T. parva can be obtained (Pienaar et al. Reference Pienaar, Potgieter, Latif, Thekisoe and Mans2011a ). It is not known which T. sp. (buffalo)-like genotype affects the hybridization assay to the largest extent. The geographic distribution of these parasites is unknown in southern Africa and it is unclear whether T. sp. (buffalo) and T. sp. (bougasvlei) belong to the same species or are closely related species (Chaisi et al. Reference Chaisi, Sibeko, Collins, Potgieter and Oosthuizen2011; Mans et al. Reference Mans, Pienaar, Potgieter and Latif2011b ). The current study aimed to address these questions by developing specific assays for T. sp. (buffalo) and T. sp. (bougasvlei), surveying a large geographically distinct T. sp. (buffalo)-like buffalo population as well as analysis of the COI gene.
MATERIALS AND METHODS
Buffalo samples and DNA extraction
African buffalo blood samples from game ranches and National Parks in southern Africa were submitted to the Parasites, Vectors and Vector-Borne Diseases laboratory during 2008–2011 for T. parva diagnostics using the real-time hybridization assay (Sibeko et al. Reference Sibeko, Oosthuizen, Collins, Geysen, Rambritch, Latif, Groeneveld, Potgieter and Coetzer2008). Genomic DNA was extracted from 200 μL of whole blood using the MagNa Pure Large Volume Kit and MagNa Pure LC (Roche Diagnostics). DNA was eluted in 100 μL of elution buffer and 2·5 μL (∼15–50 ng μL−1 DNA) used per real-time hybridization assay (Pienaar et al. Reference Pienaar, Potgieter, Latif, Thekisoe and Mans2011a ). For all assays the gold standard T. parva positive (KNP102) (Sibeko et al. Reference Sibeko, Oosthuizen, Collins, Geysen, Rambritch, Latif, Groeneveld, Potgieter and Coetzer2008), T. sp. (buffalo) positive (Buffalo 114) (Zweygarth et al. Reference Zweygarth, Koekemoer, Josemans, Rambritch, Pienaar, Putterill, Latif and Potgieter2009) and negative (9426) controls used for routine diagnostics were included. The negative control was born and raised in a herd under quarantined tick-free conditions. For T. sp. (bougasvlei) samples used were negative for T. sp. (buffalo) and T. parva by reverse line blot (RLB) (Pienaar et al. Reference Pienaar, Potgieter, Latif, Thekisoe and Mans2011a ) as well as cloning and sequencing of the 18S rRNA gene (Mans et al. Reference Mans, Pienaar, Latif and Potgieter2011a ).
Real-time hybridization assay for T. parva
The T. parva real-time hybridization assay was performed (Pienaar et al. Reference Pienaar, Potgieter, Latif, Thekisoe and Mans2011a ), using the LightCycler® 2.0 (Roche Diagnostics, Mannheim, Germany). Briefly, assay conditions included 4 μL of the LightCycler-FastStart DNA MasterPlus Hybridization mix (Roche Diagnostics, Mannheim, Germany), 1 U uracil deoxy-glycosylase (UDG) (Roche Diagnostics, Mannheim, Germany), 0·5 pmol TpF forward and TgR reverse primers, 0·1 pmol of the T. parva specific anchor and probe, 0·1 pmol of the Theileria genus specific anchor and probe pairs at a final volume of 20 μL. Crossing-point (CP) values were calculated by the qualitative analysis mode of the LightCycler 4.0 software (Roche Diagnostics, Mannheim, Germany). Results were interpreted according to the protocol: negative samples show no amplification or melting curves for the 640 or 705 nm channels. Theileria parva positive samples show amplification and melting curves in both 640 and 705 nm channels. Weak amplification and melting curves for the 640 nm channel, but significant signals for the 705 nm channel, indicate samples as T. parva negative, but T. sp. (buffalo)-like positive (Pienaar et al. Reference Pienaar, Potgieter, Latif, Thekisoe and Mans2011a ).
Hybrid II assay for T. parva
The Hybrid II assay was performed (Pienaar et al. Reference Pienaar, Potgieter, Latif, Thekisoe and Mans2011b ) using 2 μL LightCycler-FastStart DNA MasterPlus Hybridization mix (Roche Diagnostics, Mannheim, Germany), 2 μL LightCycler® 480 Genotyping Master mix (Roche Diagnostics, Mannheim, Germany), 1 U UDG (Roche Diagnostics, Mannheim, Germany), 0·5 pmol TgF forward and TpR reverse primer, 0·1 pmol each of the T. parva specific anchor and probe pairs (final volume of 20 ul). Reaction conditions included an initial UDG activation step (40 °C, 10 min) and a pre-incubation step (95 °C, 10 min). An initial 10 cycles of denaturation (95 °C, 10 s), annealing (60 °C, 10 s) and extension (72 °C, 15 s), followed by a touch-down procedure (60–56 °C, 15 cycles), followed by 20 cycles at 56 °C. Melting curves were obtained using a ramp rate of 0·2°/s from 40–95 °C. These conditions were used on both Roche LightCycler® 2.0 and LightCycler® 480 systems (Roche Diagnostics, Mannheim, Germany).
Real-time hybridization assay for T. sp. (buffalo) and T. sp. (bougasvlei)
The real-time hybridization assays for T. sp. (buffalo) and T. sp. (bougasvlei) utilized the same primer set and 640 nm anchor probe as the T. parva hybridization assay. However, unique sensor probes were used for T. sp. (buffalo) (LC640-TCAgACggAgTTTACT-PH) and T. sp. (bougasvlei) (LC640-TCAgACgAAgTTTCTT-PH), where the bases in bold indicate locked nucleic acids. Assay conditions included 2 μL LightCycler-FastStart DNA MasterPlus Hybridization mix (Roche Diagnostics, Mannheim, Germany), 2 μL LightCycler® 480 Genotyping Master mix (Roche Diagnostics, Mannheim, Germany), 1 U UDG (Roche Diagnostics, Mannheim, Germany), 0·5 pmol forward and reverse primer, 0·1 pmol each of the hybridization anchor and probe pairs (final volume of 20 μL). Reaction conditions included UDG activation (40 °C, 10 min) and a pre-incubation (95 °C, 10 min), followed by 45 cycles of denaturation (95 °C, 10 s), annealing (58 °C, 10 s) and extension (72 °C, 15 s). Melting curves were obtained by ramping from 40–75 °C (5 data acquisitions per degree). Runs were performed using the LightCycler® 480 system and CP values calculated using the LightCycler Version 1.5.0 software.
Specificity of T. sp. (buffalo) and T. sp. (bougasvlei) hybridization assays
Samples positive for T. parva, T. sp. (buffalo) and T. sp. (bougasvlei) were from the positive control panel. Buffalo or cattle samples negative with the hybridization assay for T. parva or T. sp. (buffalo)-like parasites were analysed by RLB (Pienaar et al. Reference Pienaar, Potgieter, Latif, Thekisoe and Mans2011a ) and identified samples positive for Babesia bigemina and Babesia bovis, Anaplasma centrale and A. marginale, Ehrlichia ruminantium, T. annulata, T. lestoquardi, T. sp. (duiker), T. sp. (kudu) and T. sp. (sable). The 18S gene for various Theileria species was also amplified, cloned and sequenced (Mans et al. Reference Mans, Pienaar, Latif and Potgieter2011a ) and this identified samples positive for T. buffeli-like C, T. buffeli type D-like, T. mutans, T. mutans like-1, T. mutans like-2, T. mutans like-3, T. mutans MSD, T. sp. (sable-like), T. taurotragi, T. velifera, T. velifera-like A and T. velifera-like B. Cattle samples positive for the Trypanosoma spp. T. vivax, Trypanosoma congolense Savannah and T. congolense Kilifi were confirmed by cloning and sequencing of the 18S rRNA gene (Mamabolo et al. Reference Mamabolo, Ntantiso, Latif and Majiwa2009). Samples from the KNP were also analysed using the RLB assay to detect infection with Theileria parasites (Pienaar et al. Reference Pienaar, Potgieter, Latif, Thekisoe and Mans2011a ).
Estimation of parasitaemia in database samples
Parasitaemias for T. parva positive samples were estimated as described (Pienaar et al. Reference Pienaar, Potgieter, Latif, Thekisoe and Mans2011a ). For T. sp. (buffalo) and T. sp. (bougasvlei), standard curves for the real-time hybridization assays were constructed using 18S rRNA PCR templates quantified by nanodrop spectrophotometry and gel electrophoresis against DNA standards. These concentrations were converted to molecules and estimated parasitaemia (Pienaar et al. Reference Pienaar, Potgieter, Latif, Thekisoe and Mans2011a ). Ten-fold serial dilutions were made to span CP values of 15–40 cycles, corresponding with the observed ranges of field and diagnostic samples. From regression curves, parasitaemias were calculated from CP values. In each run, a positive control for T. parva, T. sp. (buffalo) or T. sp. (bougasvlei) was included to estimate the consistency of the real-time hybridization assay. Mean CP values for the KNP102 samples during the assays were 27·73±0·55 (n = 220), for T. sp. (buffalo) it was 33·26±0·47 (n = 15) and for T. sp. (bougavslei) it was 28·93±0·65 (n = 15).
Calculation of the coefficient of correlation parameter Rij
The coefficient of correlation (Rij) was calculated as described to investigate competitive exclusion between parasites (Dib et al. Reference Dib, Bitam, Tahri, Bensouilah and De Meeûs2008). Briefly, the presence or absence of a parasite in a given sample is treated as a phenotypic character with absence represented by a value of 1 and presence represented by a value of 2. The coefficient of correlation (Rij) represent the association between a pair of parasites designated i and j. It is calculated using the formula:
 $${Rij = \displaystyle{{\displaystyle{n \over {n - 1}}\left[ {\displaystyle{{n11} \over n} - \displaystyle{{(n11 + n12)} \over n}\displaystyle{{(n11 + n21)} \over n}} \right]} \over {\sqrt {\displaystyle{{(n11 + n12)} \over n}\displaystyle{{(n22 + n21)} \over n}\displaystyle{{(n11 + n21)} \over n}\displaystyle{{(n22 + n12)} \over n}}}}} $$
Values denote the following: n: total sample number tested; n11: samples negative for both parasites i and j; n12: samples negative for parasite i, positive for j, n21: samples positive for parasite i, negative for j and n22: samples positive for both parasites i and j. Due to character coding and the oriented nature of the formula, a positive value for Rij implies positive correlation between parasite pairs and a negative value implies avoidance or competitive exclusion between parasites.
Cloning and sequencing of the COI gene
Genetic differentiation was observed between T. sp. (buffalo) and T. sp. (bougasvlei) using the S5 nuclear ribosomal gene (Mans et al. Reference Mans, Pienaar, Latif and Potgieter2011a ). To find genetic markers unbiased with regard to potential linkage, the mitochondrial COI gene was investigated. Samples positive for T. parva, T. sp. (buffalo) and T. sp. (bougasvlei) were selected from different geographic areas. Samples positive for T. taurotragi and T. lestoquardi were also analysed as well as an unknown genotype. Theileria genotypes were amplified using the COI primer sets (ThCOIF1/ThCOIR1 and ThCOIF2/ThCOIR2), used for genetic barcoding of the Piroplasmida (Gou et al. Reference Gou, Guan, Liu, Ma, Xu, Liu, Ren, Li, Yang, Chen, Yin and Luo2012). These primers did not work for the amplification of T. parva and T. sp. (buffalo), while a primer set (ThCOIF1/ThCOIR1) that did work for T. sp. (bougasvlei) also amplified another Theileria species.
New primer sets were designed specific for T. parva, T. sp. (buffalo), T. lestoquardi and T. taurotragi (COIF: ACT GGT CTT TTT GGA GGA; COIR: TCT GGT ATT CTT CTT GGA A) and for T. sp. (bougasvlei) (BgvlF: GTA TGA GTG GAT TAA AAG TGA; BgvlR: TTC TTC TTG GTA AAG GTG AG). Assay conditions for PCR consisted of 25 μL GreenTaq (Fermentas), 21·5 μL water, 1 μL primer mix (10 pmol forward and reverse primer, respectively) and 2·5 μL sample. Reaction conditions included denaturation (94 °C, 2 min), 45 cycles of denaturation (94 °C, 30 s), annealing (53 °C, 30 s) and extension (72 °C, 2 min), with a final extension (72 °C, 7 min). Samples were separated on a 1·2% agarose gel using standard TAE buffer and visualized using EtBr. Bands were cut from the gel, purified using the Silica Bead DNA Gel Extraction Kit (Thermo Scientific) and eluted with 15 μL of water. Purified bands were A-tagged by mixing equal volumes of sample and Greentaq (10 μL), denaturing at 94 °C (2 min) and extension at 72 °C (7 min). Products were cloned into the pGem T-Easy vector (Promega), transformed into competent Escherichia coli cells and colonies screened using gene specific primers. For each sample, three positive clones were purified using silica beads and sequenced from both directions using gene specific primers and the BigDye® Terminator v3.1 Cycle Sequencing Kit (Applied Biosystems). Consensus sequences were determined for the clones.
Bioinformatic analysis of the COI gene
Sequences were aligned with ClustalX (Jeanmougin et al. Reference Jeanmougin, Thompson, Gouy, Higgins and Gibson1998), manually checked and trimmed to an open reading frame (777 bp, 259 amino acids). Bayesian analysis was performed using MrBayes 3.1.2 (Ronquist and Huelsenbeck, Reference Ronquist and Huelsenbeck2003). Codons were partitioned into three sets corresponding to the first, second and third positions. Partitions were allowed to have different rates and a general time reversible (GTR) model of nucleotide substitution was used with a proportion of invariant sites and a gamma distribution of among site heterogeneity using the nst = 6 rates = ingamma command. Four categories were used to approximate the gamma distribution and two runs were performed simultaneously, each with four Markov chains (one cold, three heated) which ran for 4 000 000 generations. The first 2 000 000 generations were discarded (burnin) and every 100th tree sampled to calculate a 50% majority-rule consensus tree. Nodal values represent posterior probability that the recovered clades exist given the sequence dataset and are considered significant above 95% (Alfaro et al. Reference Alfaro, Zoller and Lutzoni2003).
Pairwise genetic distances were calculated from the alignment using the Tamura and Nei (Reference Tamura and Nei1993) model in Mega 5 (Tamura et al. Reference Tamura, Peterson, Peterson, Stecher, Nei and Kumar2011). Rate variation among sites was modelled with a gamma distribution (shape parameter = 0·41) and differences in the composition bias among sequences were considered in evolutionary comparisons (Tamura and Kumar, Reference Tamura and Kumar2002). The analysis involved 97 nucleotide sequences and included all codon positions. Positions containing gaps and missing data were eliminated with 775 positions in the final dataset.
The alignment was submitted to the Automatic Barcode Gap Discovery (ABGD) Server (http://wwwabi.snv.jussieu.fr/public/abgd/) that calculates a barcode gap from the inference of a model-based one-sided confidence limit for intraspecific divergence (Puillandre et al. Reference Puillandre, Lambert, Brouillet and Achaz2012). Minimum prior intraspecific divergence (0·001) and maximum prior intraspecific divergence (0·1) were scanned over 10 steps with a minimum gap width (1·5) and distance distribution Nn bins (20). Pairwise-distances were calculated using the Kimura two parameter model (K2P). Iterative limit inference and gap detection results in partitioning of data into groups predicted to be species units.
RESULTS
Specificity and sensitivity of the T. sp. (buffalo) and T. sp. (bougasvlei) hybridization assays
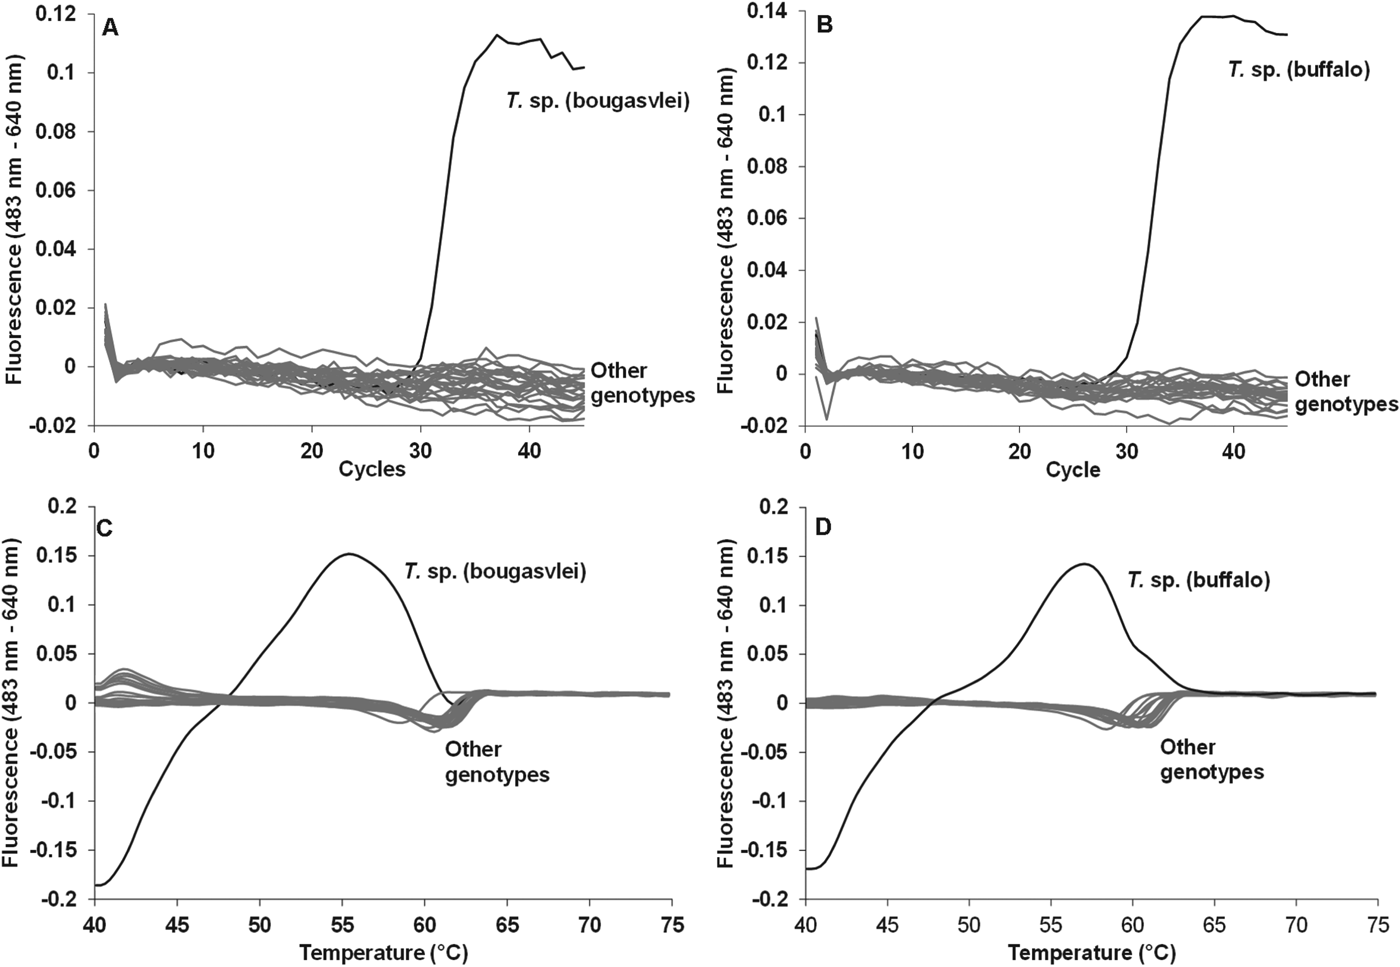
Each assay showed specific detection of their respective genotypes at 640 nm (Fig. 1). In addition, no other Theileria genotype thus far detected in African buffalo gave any amplification signal based on the 640 nm probes (Fig. 1). Both assays detected ten copies of template DNA with efficiencies of 92–95% (Fig. 2). Given this sensitivity range, a cut-off CP value for positive samples were determined to be below 37 cycles for both assays.
Specificity of the T. sp. (buffalo) and T. sp. (bougasvlei) real-time hybridization PCR assays. Indicated are amplification curves (A, B) and melting curves (C, D) for the T. sp. (buffalo) and the T. sp. (bougasvlei) positive controls. Other genotypes refer to negative control and samples that possessed genotypes found in bovids. Theileria species included: T. sp. (bougasvlei) and T. sp. (buffalo), respectively, T. annulata, T. buffeli-like C, T. buffeli type D-like, T. lestoquardi, T. mutans, T. mutans like-1, T. mutans like-2, T. mutans like-3, T. mutans MSD, T. parva, T. sp. (duiker), T. sp. (kudu), T. sp. (sable), T. sp. (sable-like), T. taurotragi, T. velifera, T. velifera-like A, T. velifera-like B. Babesia: B. bigemina and B. bovis. Anaplasma: A. centrale and A. marginale. Ehrlichia: E. ruminantium. Trypanosoma species: T. vivax, T. congolense Savannah and T. congolense Kilifi.

Analytical sensitivity of the T. sp. (buffalo) and T. sp. (bougasvlei) assays. (A) Standard curves obtained from a 10-fold serial dilution of T. sp. (buffalo) and T. sp. (bougasvlei) 18S DNA templates. The number of molecules vs their corresponding CP values is indicated; (B) Amplification curves of the serial dilution indicating T. sp. (buffalo) (black curves) and T. sp. (bougasvlei) (grey curves).

Sample analysis
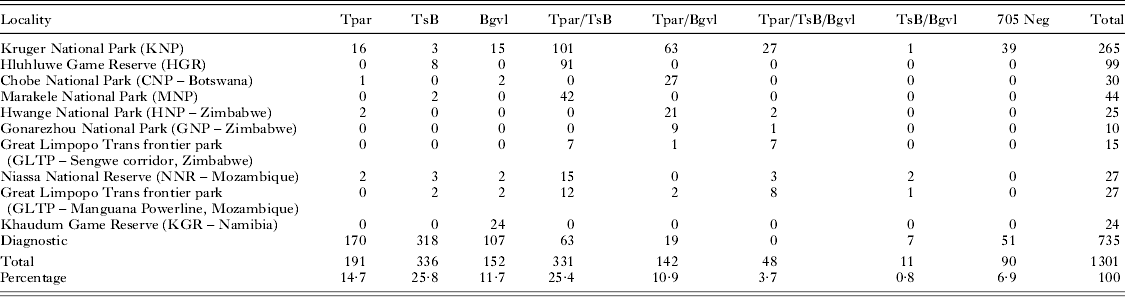
Samples were analysed using the T. parva hybridization assay (n = 1301). Of these, 1211 were positive at 705 nm, indicating both T. parva and T. sp. (buffalo)-like infections (Table 1). All 705 nm positive samples were tested using the hybrid II assay for T. parva, and the T. sp. (buffalo) and T. sp. (bougasvlei) assays. Samples were positive for T. parva (n = 712), T. sp. (buffalo) (n = 726) and T. sp. (bougasvlei) (n = 353). Animals with single infections included for T. parva (n = 191), T. sp. (buffalo) (n = 336) and T. sp. (bougasvlei) (n = 152). Mixed infections of T. parva and T. sp. (buffalo) or T. sp. (bougasvlei) comprised 331 and 142 animals, respectively. In contrast, animals with mixed infections of T. sp. (buffalo) and T. sp. (bougasvlei) comprised only 59 animals, of which 48 were also infected with T. parva. In addition 90 samples negative at 705 nm were tested that were negative using all different tests.
Diagnostic results for T. parva (Tpar), T. sp. (buffalo) (TsB) and T. sp. (bougasvlei) (Bgvl)

Geographic distribution
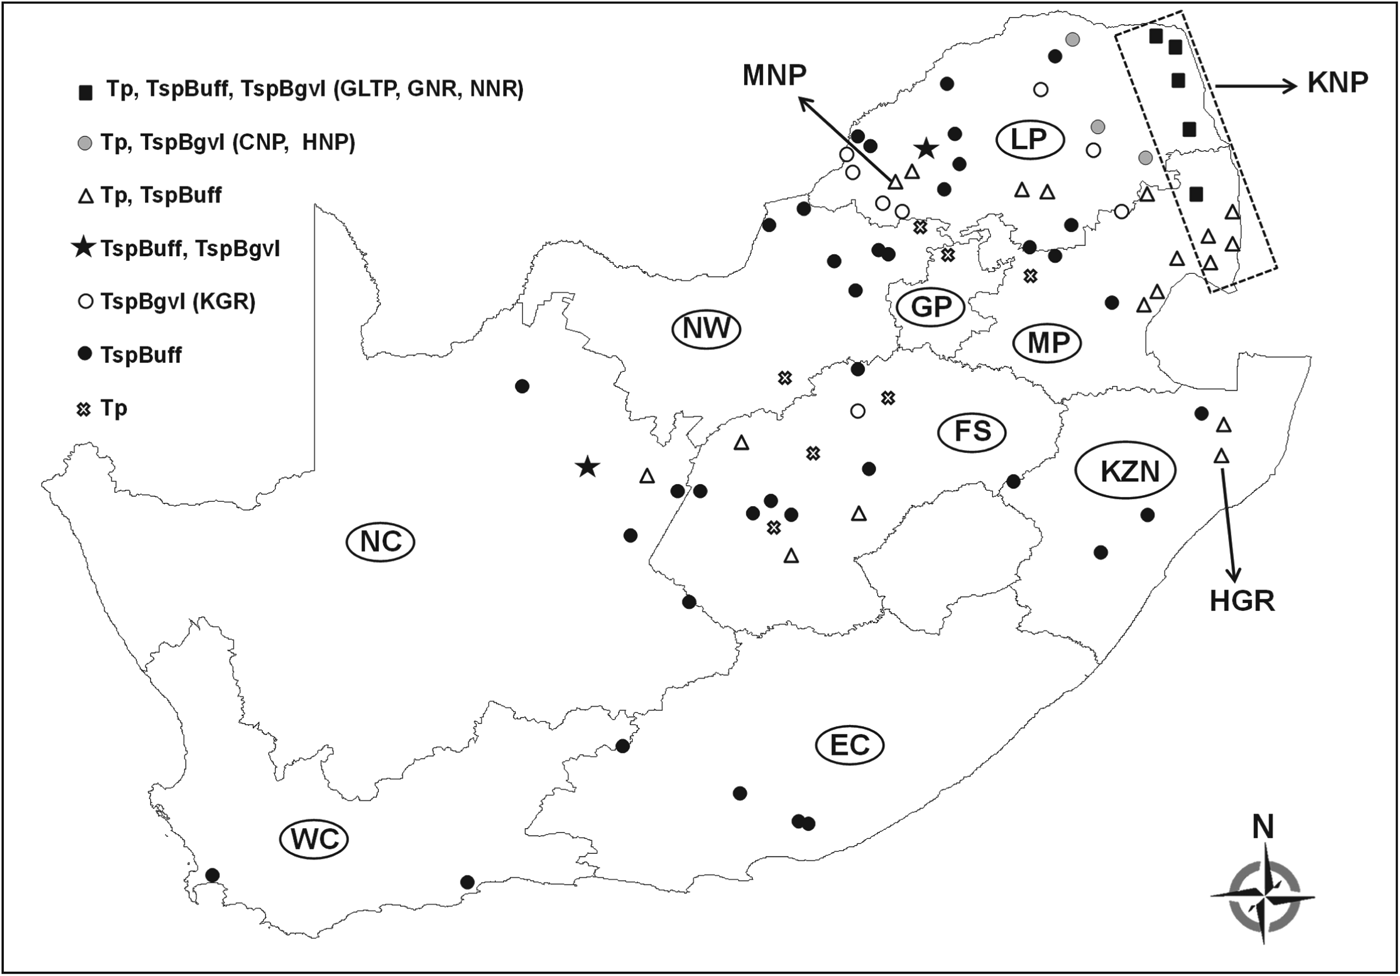
Theileria sp. (buffalo) and T. sp. (bougasvlei) were distributed across southern Africa, although the majority of buffalo ranches and game parks possessed a single genotype (Fig. 3). The majority of mixed infections of T. sp. (buffalo) and T. sp. (bougasvlei) were limited to National Parks, while seven diagnostic samples were limited to two localities. Even though both genotypes occur in the Kruger National Park (KNP), their predominant distribution was limited to specific geographic areas (Fig. 4A). Theileria sp. (buffalo) occurred in the northern and southern areas of the park, with T. sp. (bougasvlei) in the central region. Animals that possessed mixed infections occurred at T. sp. (buffalo) and T. sp. (bougasvlei) interfaces. To determine whether the disparate distribution of T. sp. (buffalo) and T. sp. (bougasvlei) is not an artefact, co-infection rates with other Theileria species were determined for the KNP dataset (Fig. 4B). Co-infection of T. sp. (buffalo) and T. sp. (bougasvlei) was lower than any other parasite pair, while co-infection of either T. sp. (buffalo) or T. sp. (bougasvlei) with other Theileria species was comparable.
Geographic distribution of T. parva, T. sp. (buffalo) and T. sp. (bougasvlei) in South Africa. National parks are indicated with arrows (KNP: Kruger National Park; HGR: Hluhluwe Game Reserve; MNP: Marakele National Park). All other localities include small game reserves, commercial wildlife ranches and buffalo project ranches grouped under diagnostic samples. Distribution in international parks is indicated in parentheses (CNP: Chobe National Park; GLTP: Great Limpopo Transfrontier Park; GNP: Gonarezhou National Park; HNP: Hwange National Park; KGR: Khaudum Game Reserve; NNR: Niassa National Reserve). Circles indicate provinces: Western Cape (WC), Northern Cape (NC), Eastern Cape (EC), North-West (NW), Free State (FS), Gauteng (GP), Kwa-Zulu Natal (KZN), Mpumalanga (MP) and Limpopo (LP).

Distribution of T. parva, T. sp. (buffalo) and T. sp. (bougasvlei) in the Kruger National Park. (A) Park boundaries are indicated with bold lines and major rivers by thin lines and italicized names. Sampling sites are indicated with numbered circles and corresponding names and the number of positive samples per site found for T. parva (Tpar), T. sp. (buffalo) (TsBuff), T. sp. (bougasvlei) (TsBgvl), T. mutans (Tmut) and T. velifera (Tvel); (B) A heat map distribution indicates absence (white), presence (grey) or mixed infections for T. sp. (buffalo) and T. sp. (bougasvlei) (black); (C) Percentage co-infection for T. sp. (buffalo) or T. sp. (bougasvlei) positive buffalo with T. parva, T. mutans and T. velifera. The presence of the latter two parasites was determined using RLB analysis.

Parasitaemia levels
For all genotypes, parasitaemia ranged from 0·0001–0·1% (Fig. 5). However, there were significant differences in the parasitaemia ranges between different parks. Parasitaemia ranges for T. parva in the KNP and Hwange National Parks gave a wide range from 0·0001–0·1%. In contrast, parasitaemia ranges in Marakele, Niassa (Mozambique) and Khaudum (Namibia) were much narrower (0·001–0·1%), while in Chobe National Park (Botswana) parasitaemias were consistently below 0·01%. In Hluhluwe National Park, parasitaemias were on average higher than the other parks (0·01–1%).
Parasitaemia ranges for T. parva, T. sp. (buffalo) and T. sp. (bougasvlei) in different sample sets. Indicated are different National Parks as well as the diagnostic sample set. Number of data points for each genotype is indicated in parentheses.

Competitive exclusion between different Theileria parasites
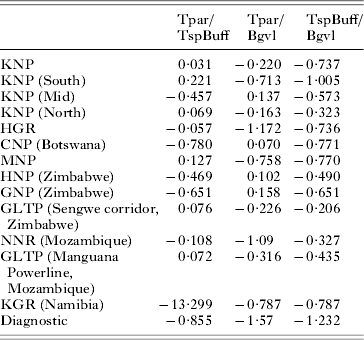
A negative correlation was found for T. sp. (buffalo) and T. sp. (bougasvlei) at all localities (Table 2). In contrast, for mixed infections with T. parva, both genotypes showed instances of low positive correlation, with an inverse negative correlation for the opposite genotype, again indicative of the negative association observed between T. sp. (buffalo) and T. sp. (bougasvlei).
Correlation of co-occurrence of Theileria parasites. Indicated are the Rij values

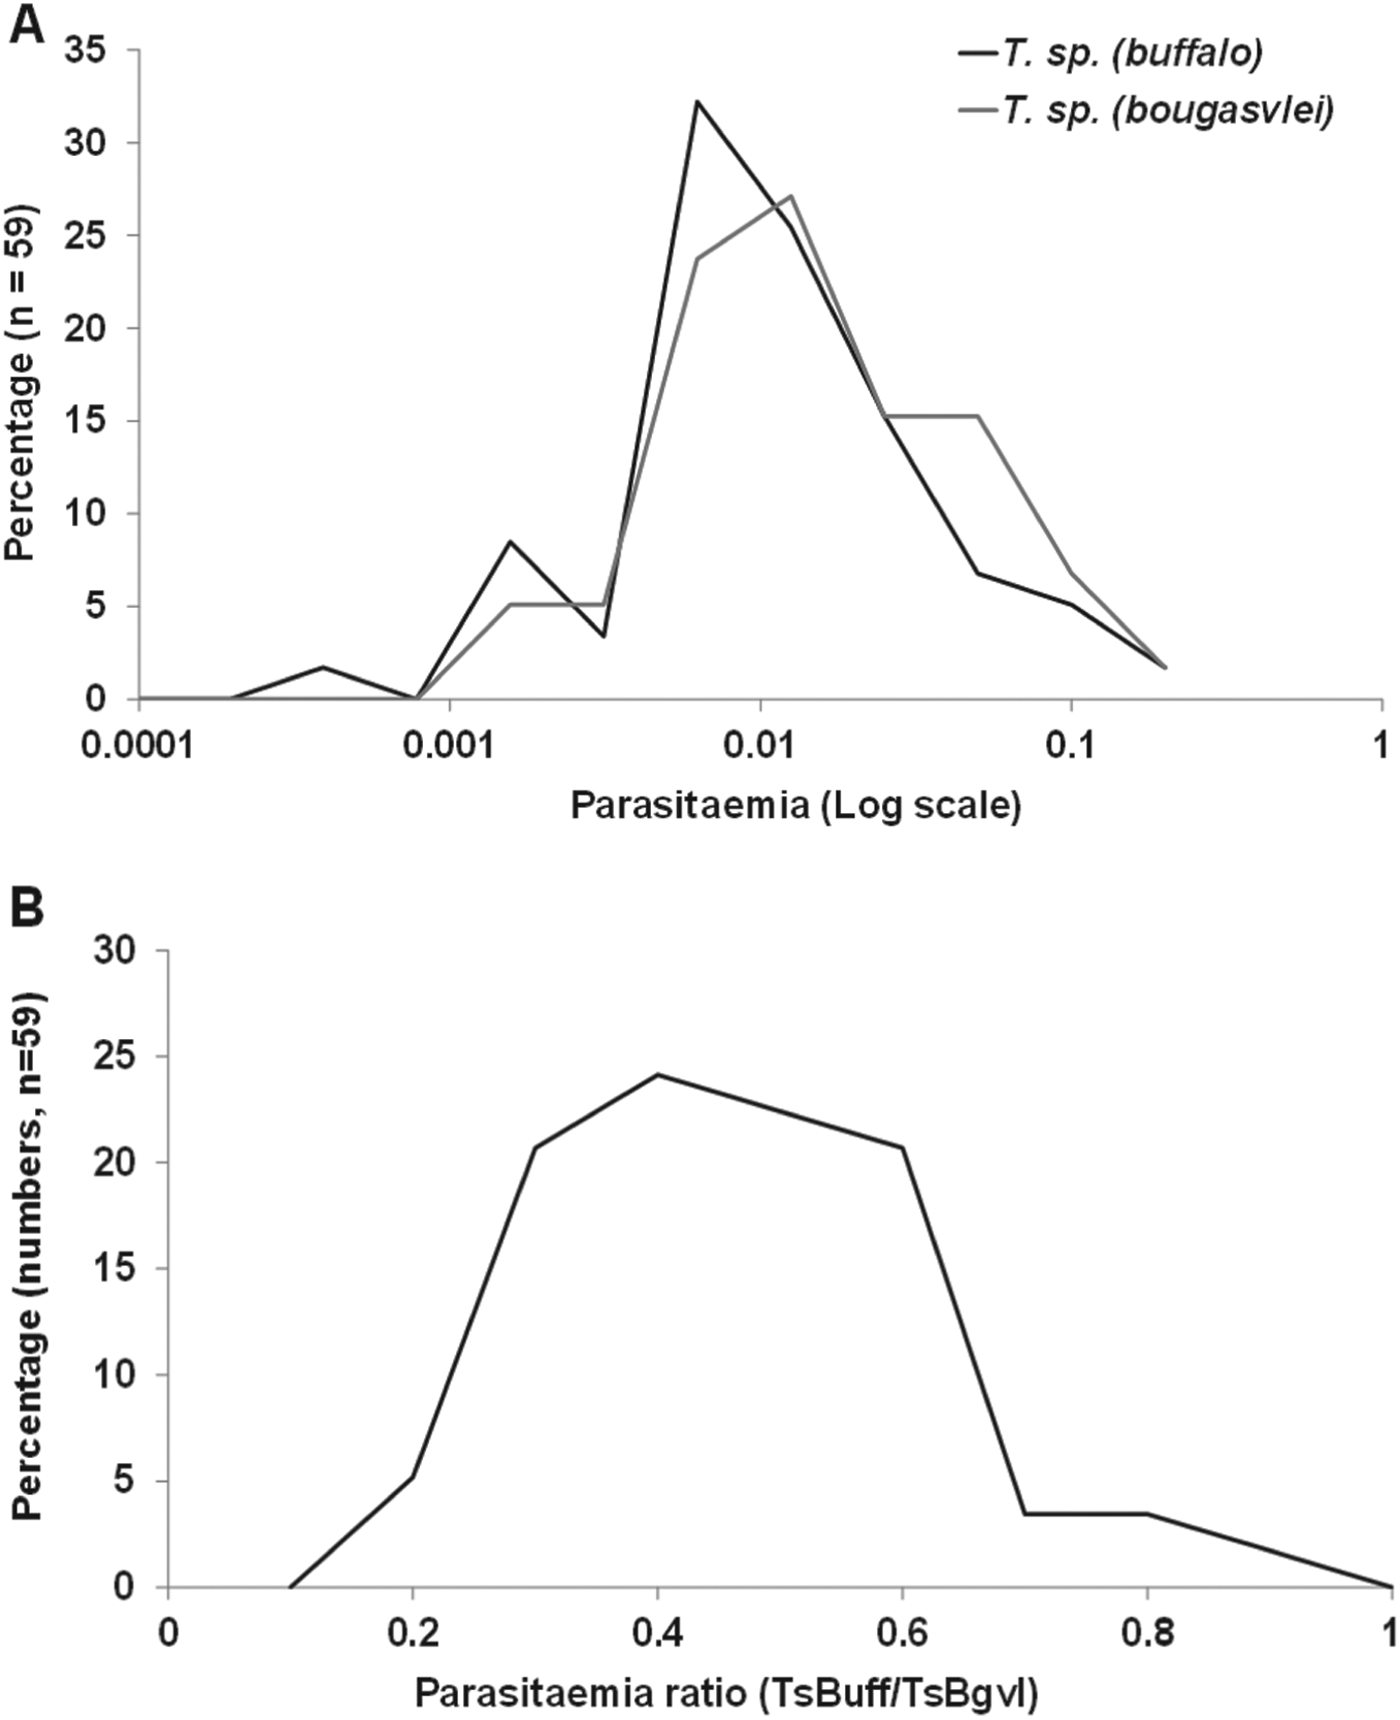
Ratios of mixed infections
Expression of mixed infections as parasitaemia ratio can be used to investigate whether any systematic skew exists, i.e. whether competitive exclusion was present. Analysis of animals with mixed infections indicated that the parasitaemia ranges for T. sp. (buffalo) and T. sp. (bougasvlei) spanned the normal range (Fig. 6A). A frequency plot of the parasitaemia ratios approximates a normal distribution (Fig. 6B). No systematic skew could be observed and competitive exclusion between these genotypes within an animal with mixed infections was not supported.
Parasitaemia of animals with mixed-infections of T. sp. (buffalo) and T. sp. (bougasvlei). (A) Parasitaemia range of animals with mixed-infections; (B) A frequency distribution of the parasitaemia ratios of T. sp. (buffalo)/T. sp. (bougasvlei) for animals with mixed infections.

T. sp. (buffalo) and T. sp. (bougasvlei) as different species
Phylogenetic analysis of COI indicated that all members of the ‘T. taurotragi clade’ grouped as distinct genotypes (Fig. 7A). This included the known species T. annulata, T. lestoquardi, T. parva and T. taurotragi. Theileria sp. (bougasvlei) showed a closer genetic relationship to T. parva than T. sp. (buffalo) although with weak posterior probability support (83%). All samples from a specific genotype grouped within their respective clades with 100% posterior probability support with no support for the monophyly of T. sp. (buffalo) and T. sp. (bougasvlei). An unknown genotype grouped separately from any other Theileria genotype and based on a common genotype found in all the samples, could potentially represent T. velifera-B (BJM, unpublished observation). Analysis of the intra- vs inter-species genetic distances indicated that intra-species distances are all below 0·02 (Fig. 7B). In contrast the lowest inter-species distance was 0·079 for T. annulata and T. lestoquardi. Genetic distances between T. sp. (buffalo)/T. sp. (bougasvlei), T. sp. (buffalo)/T. parva and T. parva/T. sp. (bougasvlei) were 0·124, 0·139 and 0·147, respectively. These values are similar to other inter-species distances within the ‘T. taurotragi clade’ and well above the lowest distance for two recognized species, T. annulata and T. lestoquardi. This suggests that these genotypes represent different species and is supported by the fact that primers specific for T. sp. (buffalo) or T. sp. (bougsvlei) did not reciprocally amplify the other genotype. ABGD analysis separated the data into 9 groups after 9 recursive partitions, Group 1: T. sp. (buffalo), Group 2: T. parva, Group 3: T. sp. (bougasvlei), Group 4: T. taurotragi, Group 5: T. annulata and T. lestoquardi, Group 6: T. luwenshuni, Group 7: T. uilenbergi, Group 8: T. sergenti and T. sinensis and Group 9: T. spp. These correspond with the phylogenetic clades obtained during Bayesian analysis.
Bayesian analysis of the cytochrome oxidase (COI) gene. (A) Sequences are indicated by an animal number, locality, province, T. parva, T. sp. (buffalo) or T. sp. (bougasvlei) test result and GenBank accession number in parentheses. Posterior nodal support higher than 95% is indicated; (B) Average genetic distances are indicated for intra- and inter-species with standard deviation as error bars. The upper broken line indicates the lowest limit considered for inter-species relationships as defined by T. annulata and T. lestoquardi. The lower broken line indicates the highest limit considered for intra-species relationships as defined by the upper deviation for T. sp. (buffalo). The distances between T. parva, T. sp. (buffalo) and T. sp. (bougasvlei) are indicated by dark grey bars.

DISCUSSION
Distinction of species between genetically closely related organisms remains problematic in the absence of unambiguous phenotypic traits. In the Theileria, phenotypic traits include microscopic morphology, vertebrate host or tick vector specificity, differential clinical disease outcomes or carrier-state biology (proliferation in the host and parasitaemia), serological distinction and molecular markers. Few traits distinguish between T. sp. (buffalo) and T. sp. (bougasvlei). Morphologically no distinguishing features are known (Zweygarth et al. Reference Zweygarth, Koekemoer, Josemans, Rambritch, Pienaar, Putterill, Latif and Potgieter2009). Theileria sp. (buffalo) was found in African buffalo in Uganda, Kenya and southern Africa, with no substantive reports that cattle can be infected (Oura et al. Reference Oura, Bishop, Wampande, Lubega and Tait2004, Reference Oura, Tait, Asiimwe, Lubega and Weir2011; Pienaar et al. Reference Pienaar, Potgieter, Latif, Thekisoe and Mans2011a ). Theileria sp. (bougasvlei) has only been found in African buffalo in southern Africa (Zweygarth et al. Reference Zweygarth, Koekemoer, Josemans, Rambritch, Pienaar, Putterill, Latif and Potgieter2009; Mans et al. Reference Mans, Pienaar, Latif and Potgieter2011a ). Tick vectors for T. sp. (buffalo) and T. sp. (bougasvlei) remain unknown. Whereas T. parva is known to cause the related diseases of East Coast fever (ECF), January disease (Zimbabwe theileriosis) and Corridor disease in cattle, T. sp. (buffalo) and T. sp. (bougasvlei) are considered to be un-infective to cattle (Mans et al. Reference Mans, Pienaar, Latif and Potgieter2011a , Reference Mans, Pienaar, Potgieter and Latif b ; Oura et al. Reference Oura, Tait, Asiimwe, Lubega and Weir2011). While data regarding serological cross-reactivity are scarce, some strains of T. sp. (buffalo) might cross-react with T. parva antibodies and vice versa using IFAT or the PIM ELISA (Conrad et al. Reference Conrad, Stagg, Grootenhuis, Irvin, Newson, Njamunggeh, Rossiter and Young1987; AAL and BJM, unpublished observations).
The only molecular differences exist in the V4-region of the 18S rRNA and the S5 ribosomal protein genes (Mans et al. Reference Mans, Pienaar, Latif and Potgieter2011a ). In the case of T. sp. (buffalo) and T. sp. (bougasvlei) there are 8 to 10 nucleotide differences across the 18S rRNA gene and two indels (Chaisi et al. Reference Chaisi, Sibeko, Collins, Potgieter and Oosthuizen2011). Between T. parva and T. sp. (bougasvlei), 10 to 14 nucleotide differences exist, and two indels. Nine to 13 nucleotide differences exist between T. parva and T. sp. (buffalo), with no indels. For the S5 gene, T. parva, T. sp. (buffalo) and T. sp. (bougasvlei) gave similar pairwise genetic distances (Mans et al. Reference Mans, Pienaar, Latif and Potgieter2011a ). As such, molecular data do suggest that some form of differentiation exists between T. sp. (buffalo) and T. sp. (bougasvlei). The current study expands on this with regard to geographic distribution as well as the use of the mitochondrial COI gene as molecular marker.
Two novel assays, specific for T. sp. (buffalo) and T. sp. (bougasvlei) were developed and validated in the current study. Sensitivity of both assays compared well with the hybridization probe and Hybrid II assays for T. parva (Pienaar et al. Reference Pienaar, Potgieter, Latif, Thekisoe and Mans2011b ). It is therefore possible to distinguish these parasites in a single sample using different real-time PCR assays. It also indicates the potential of real-time PCR technology to derive quantitative data for animals with mixed Theileria infections.
Previously, 10% of KNP samples with mixed infections showed PCR suppression of T. parva (Pienaar et al. Reference Pienaar, Potgieter, Latif, Thekisoe and Mans2011a ). These samples were T. parva positive with the Hybrid II assay (Pienaar et al. Reference Pienaar, Potgieter, Latif, Thekisoe and Mans2011b ), and are all T. sp. (buffalo) positive. No PCR suppression has been observed with T. sp. (bougasvlei). The parasitaemia of T. sp. (bougasvlei) is generally lower than that of T. sp. (buffalo) and T. parva, while parasitaemia for T. sp. (buffalo) is higher than that for T. parva. This could explain why mixed infections with T. sp. (buffalo) lead to PCR suppression in a limited set of samples of the KNP (Pienaar et al. Reference Pienaar, Potgieter, Latif, Thekisoe and Mans2011a ). No PCR suppression has been observed in the samples from Hluhluwe Game Reserve (HGR) where ∼100% of buffalo possess mixed infections of T. parva and T. sp. (buffalo). However, parasitaemia in HGR is much higher for both parasites compared with the KNP, which could affect PCR suppression (Pienaar et al. Reference Pienaar, Potgieter, Latif, Thekisoe and Mans2011a ). Parasitaemia differences observed in National Parks may be related to tick density and park size which could impact on risk of PCR suppression.
Several different possibilities may explain the geographic distribution and parasitaemia differences observed:
-
(1) Sampling bias. In the case of diagnostic samples this could be a factor, since buffalo are commodities based on their T. parva disease-free status (Laubscher and Hoffman, Reference Laubscher and Hoffman2012). Movement of buffalo infected with T. sp. (buffalo)-like parasites is not controlled and these could be moved to vector-free areas. Conversely, movement of buffalo into vector areas will promote the spread of the infection, thereby re-establishing historic endemic areas. However, the geographic distribution of diagnostic samples correlates with those from National Parks, where the parasites and vectors are assumed to be endemic. Sampling bias is therefore not considered to be a significant factor. Of interest was that RLB analysis previously indicated few T. sp. (buffalo) positive animals in the central KNP (Pienaar et al. Reference Pienaar, Potgieter, Latif, Thekisoe and Mans2011a ). The current study explains this, as T. sp. (bougasvlei) predominates in the central KNP and will go undetected by RLB (Chaisi et al. Reference Chaisi, Sibeko, Collins, Potgieter and Oosthuizen2011).
-
(2) PCR suppression due to mixed infections. It was previously shown that in at least 10% of cases in the KNP, suppression of PCR led to false-negative T. parva samples (Pienaar et al. Reference Pienaar, Potgieter, Latif, Thekisoe and Mans2011a ). However, herd-wide suppression was never observed and suppression seems to depend on individual parasitaemia levels. This factor is therefore considered to be minor in the current study.
-
(3) Different tick vectors. This could be a relevant factor, since the tick vectors for T. sp. (buffalo) and T. sp. (bougasvlei) remain unknown. If tick species play a significant role, this would support T. sp. (buffalo) and T. sp. (bougasvlei) being different species. Analysis of ticks found on buffalo in the KNP indicated that potential vectors could be Amblyomma hebraeum, A. marmoreum, Hyalomma truncatum, Rhipicephalus appendiculatus, Rhipicephalus evertsi or Rhipicephalus simus (Horak et al. Reference Horak, Golezardy and Uys2007). Most of these ticks are distributed across all eco-zones in the park, even though some localized distributions are found (Spickett et al. Reference Spickett, Horak, Braack and van Ark1991). As such, Rhipicephalus zambesiensis is localized in the northern and southern regions of the park, but not the central regions. This might suggest that it could be a vector of T. sp. (buffalo), however, it is not found in HGR.
-
(4) Host dispersal. Movement of buffalo herds or individuals would explain localized distributions. However, the potential lifelong carrier state of Theileria in buffalo (the longest documented T. parva carrier period in a vector-free area being 20 years – F. T. Potgieter, personal communication, 2013), the infection cycle of ticks that is dispersed over an annual period (which enhance contact with new hosts) and the fact that buffalo herds and individuals can migrate over large distances within short periods of time in response to environmental cues (Halley et al. Reference Halley, Vandewalle, Mari and Taolo2002; Cross et al. Reference Cross, Lloyd-Smith and Getz2005), would negate any host vicariance effects. As such, other Theileria species such as T. parva, T. mutans and T. velifera show no geographic localization as observed for T. sp. (buffalo) and T. sp. (bougasvlei) within the KNP.
-
(5) Gene duplicates in the same genome. Thus far all Theileria species have two genomic copies of the 18S rRNA gene (Hayashida et al. Reference Hayashida, Hara, Abe, Yamasaki, Toyoda, Kosuge, Suzuki, Sato, Kawashima, Katayama, Wakaguri, Inoue, Homma, Tada-Umezaki, Yagi, Fujii, Habara, Kanehisa, Watanabe, Ito, Gojobori, Sugawara, Imanishi, Weir, Gardner, Pain, Shiels, Hattori, Nene and Sugimoto2012). It is therefore possible that the different genotypes observed might be different gene duplicates. This is relevant, since multiple divergent copies of the 18S gene has been identified in various protozoans, with the implication that the 18S rRNA gene is not useful to distinguish species compared with the COI gene (El-Sherry et al. Reference El-Sherry, Ogedengbe, Hafeez and Barta2013). However, if this was the case, co-detection would be the norm, while the COI gene phylogeny and ABGD analysis supports the designation as different species.
-
(6) Different alleles. In this scenario, T. sp. (buffalo) and T. sp. (bougasvlei) would be considered to be the same species and the 18S variants different allelic forms (Chaisi et al. Reference Chaisi, Sibeko, Collins, Potgieter and Oosthuizen2011). Differences in geographic distribution would be due to changes in allelic frequencies. The disparate geographic distribution of T. sp. (buffalo) and T. sp. (bougasvlei) would suggest that genetic drift played an important part in the fixation of alleles within the various geographic populations. This would suggest that small population sizes or bottleneck events are the norm in Theileria biology (McKeever, Reference McKeever2009). In this regard, T. parva was assumed to be panmictic, but has been shown to exhibit local sub-structuring in different populations (Oura et al. Reference Oura, Asiimwe, Weir, Lubega and Tait2005; Muleya et al. Reference Muleya, Namangala, Simuunza, Nakao, Inoue, Kimura, Ito, Sugimoto and Sawa2012). The effective population size of a Theileria parasite in a buffalo with moderate parasitaemia (0·01%) is, however, not small but in the range of 1×10¹⁰ parasites. Population bottlenecks certainly occur if it is considered that only ∼1×10⁵ parasites are ingested by nymphal ticks, while less than a 1000 parasites infects the salivary glands, is subsequently transmitted to the host and that only one tick mating pair survives (McKeever, Reference McKeever2009). A further bottleneck might occur due to host immunity in the case of heterologous challenge, where few parasites will mature to the point of piroplasms. However, given that the piroplasm carrier-state may be life long, that extensive recombination events do occur that make heterologous challenge more probable and that multiple tick challenges occur over many years, the reality of a bottleneck effect and small effective population sizes in a vector endemic region seems to be remote. The possibility that T. sp. (buffalo) and T. sp. (bougasvlei) belong to the same species is also not supported by either nuclear S5 ribosomal and mitochondrial COI gene phylogenies or ABGD analysis.
-
(7) Competitive exclusion of piroplasms in the buffalo host. Competition of parasites for resources, specifically red blood cells in the host has been documented for anaplasmosis and babesiosis (Dib et al. Reference Dib, Bitam, Tahri, Bensouilah and De Meeûs2008). The relatively low parasitaemia levels observed for T. sp. (buffalo), T. sp. (bougasvlei) and T. parva do not, however, suggest that this is a significant mechanism utilized by these parasites, since multiple infections by Theileria genotypes seem to be the norm in African buffalo (Mans et al. Reference Mans, Pienaar, Latif and Potgieter2011a ). In addition, no skew was observed in parasitaemia ratios for animals with mixed infections.
-
(8) Immunological cross-reactivity. If significant immunological cross-reactivity exists between species or strains, the establishment of carrier piroplasms could be prevented, since parasites will not have time to mature before elimination by the host's immune system. In such a scenario, the piroplasm population might be established during the initial infection, while subsequent infections will not contribute towards genetic diversity. This scenario seems unlikely, given that heterologous strains exist and are known to be responsible for re-infection (McKeever, Reference McKeever2009).
-
(9) Genetic incompatibility. This would imply that T. sp. (buffalo) and T. sp. (bougasvlei) are closely related but different Theileria species. In this scenario, these species recently diverged and is transmitted via the same tick vector. A feeding tick that ingests parasites from a buffalo with mixed infections, results in mating, genetic incompatibility and/or sterile hybrid progeny (Coyne and Orr, Reference Coyne and Orr2004). Mixed infections in the vertebrate host will therefore adversely affect population fitness, with a resulting fixation of a specific species in the buffalo population. In areas where buffalo migrate and come into contact with their opposite carriers, mixed infections will occur until fixation of a specific genotype occurs. Such zones will be found wherever migrating buffalo meet. In the present study, the region in Northern KNP is of interest, since the Transfrontier Park has opened up in 2008 with the Senge Corridor linking the KNP and Goranguru National Park. Migration and contact of buffalo in this region is therefore possible and creates an unstable zone where mixed infections will occur. This does not imply that mixed infections in the buffalo host cannot be maintained in the carrier-state, but do suggest that such buffalo might be dead-end hosts for the parasites. This mechanism will allow parasites to mimic geographic isolation within a shared vertebrate host and tick vector and ensure speciation. Once mating does not occur any more, mixed infections will not be problematic. Once the tick vector for T. sp. (buffalo) and T. sp. (bougasvlei) has been identified, it would be possible to test this hypothesis on a more formal basis, by tick transmission experiments. It also implies that T. sp. (bougasvlei) and T. parva, which seem to be genetically closer related, have different tick vectors and hybrid sterility would therefore not be problematic. The possibility that hybridization may occur between T. sp. (buffalo) and T. sp. (bougasvlei) exist. However, co-segregation of nuclear (18S) and mitochondrial (COI) markers do not support this possibility.
In the case of T. parva and T. taurotragi, which shares the same tick vector and cattle as vertebrate hosts, but also specifically infect buffalo and eland, respectively (Bishop et al. Reference Bishop, Musoke, Morzaria, Gardner and Nene2004; Oura et al. Reference Oura, Tait, Asiimwe, Lubega and Weir2011), host specificity as means of geographic isolation probably played a larger role than genetic incompatibility. This implies that speciation occurred in these species before introduction of cattle into Africa. Mechanisms for speciation in Theileria could therefore include host and tick vector specificity as well as genetic incompatibility.
ACKNOWLEDGEMENTS
We thank Dr Roy Bengis for buffalo samples from various National Parks.
FINANCIAL SUPPORT
This work was supported by the Theileria Diagnostics project of Onderstepoort Veterinary Institute (project number 15/08/1P01) and a contract grant from the Department of Agriculture and Fisheries (grant number OV21/03/C148).