1. Introduction
Safety has always been the top priority in the shipping industry, particularly in recent years. Prioritising safety and preventing accidents will boost industry personnel confidence and save many lives. Accidental costs to personnel, equipment, the economy and the environment, are often unaffordable. Marine traffic accidents are less common than road traffic accidents and have been significantly reduced in recent years because of using advanced technology (Luo and Shin, Reference Luo and Shin2019). However, the frequency of marine accidents, particularly accidents between ships, has no possibility of declining to zero due to human error. Various reports, such as those from the Marine Accident Investigation Branch or the European Maritime Safety Agency, have shown that collision is the most common type of marine accident. Therefore, scholars have paid much attention to collision avoidance research and many related models and techniques have been developed. Some focused on the collision accident per se, while others chose to study non-accident events (i.e. collision risk, near misses, close-quarter situations and immediate danger). These non-accident events are critical to accident prevention research because scholars (Majumdar et al., Reference Majumdar, Manole and Nalty2021) have proved that numerous near-misses will eventually lead to an actual accident. Some shipping companies rewarded $10 per near-miss event to any crew who reported it, but only a maximum of five such reports are rewarded monthly (i.e. Thome Ship Management Pte Ltd., http://thome.com/). Because the company also believed that these research findings are effective in reducing accidents, it is of crucial importance for ship owners and other stakeholders to have effective ways of analysing the collision risks and improving the safety of maritime transportation in different waters.
1.1 Literature review
Although potential collision risk is a relatively new field for marine traffic research, it has a long history in other fields, such as road traffic. The traffic conflict technique (TCT) was developed by road traffic research, with an early foundation laid by Chin and Quek (Reference Chin and Quek1997). Later, Debnath and Chin (Reference Debnath and Chin2010) proposed a nautical traffic conflict technique as an improved approach to the TCT. For marine traffic, collision risk or ‘risk of collision’ appeared in the Convention on the International Regulations for Preventing Collisions at Sea (COLREGS)Footnote 1 many times, but no specific explanations about the concept of collision risk exist. Alternatively, some articles outlined the relevant definitions. Li and Pang (Reference Li and Pang2013) proposed a vessel collision risk assessment model based on the Dempster–Shafer theory of evidence. The collision risk was explained as a combination of the probability and consequence of ship's collision. A multi-radar network was used to manage the complex relationship between collision risk and the distance to the closest point of approach (DCPA), the time to the closest point of approach (TCPA) and other distances. Simsir et al. (Reference Simsir, Amasyalı, Bal, Çelebi and Ertugrul2014) presented a decision support system to help the vessel traffic service (VTS) to monitor and guide vessels transiting the Istanbul Strait. The data from passing vessels were used to train an artificial neural network that can predict the subsequent 3-min trajectory of each vessel. Goerlandt and Montewka (Reference Goerlandt and Montewka2015a) created a two-stage risk assessment model to analyse maritime transportation risks. First, they use a Bayesian network model to quantify the risk probability. Then, they give an assessment of uncertainty based on the first stage. This model helped to evaluate tanker collision oil spill risks after the case study was implemented. Moreover, the risk was believed as a concept acted on a system in the evaluator's mind, instead of a physical property that exists in the system itself. Zhang et al. (Reference Zhang, Goerlandt, Kujala and Wang2016) proposed a model that uses automatic identification system (AIS) data to differentiate the severity of a ship's encounter. Szlapczynski and Szlapczynska (Reference Szlapczynski and Szlapczynska2016) gave analytical formulas for domain-based collisions that can upgrade the use of the ship domain in real-time systems and significantly reduce the processing time. Chai et al. (Reference Chai, Weng and De-qi2017) developed a quantitative risk assessment model to evaluate ship collision risks. This model considers the frequency and consequences of possible accidents and includes a collision frequency estimation model, an event tree and a consequence estimation model. The accident assessment is well represented by the consequence estimation model. Zhang et al. (Reference Zhang, Teixeira, Soares and Yan2018) created a collision probability model using Bayesian rules and the least-squares estimation method to assess the risk-influencing factors that cause collisions. Seven factors were determined from the model's analysis and test. Zhang and Meng (Reference Zhang and Meng2019) proposed a probabilistic ship domain with a vague domain boundary rather than a crisp value with the desired boundary. Jon et al. (Reference Jon, Kim and Choe2021) proposed a safety criterion based on the risk assessment of marine accidents. The assessment was done by combining a Markov model and a Markov chain Monte Carlo simulation. The criteria were determined based on the earlier accident data. Zhao et al. (Reference Zhao, Yuan and Yu2021) used a data-driven Bayesian network based on accident data from the Yangtze River to determine the risk factors for marine accidents involving unmanned surface vessels (USVs). They built a network to determine how the future occurrence of maritime accidents, such as collisions, can be reduced as crews are removed from USVs, but accidents, such as fire and extreme weather, can be even worse. Relevant literature reviews (Goerlandt and Montewka, Reference Goerlandt and Montewka2015b; Lim et al., Reference Lim, Cho, Bora, Biobaku and Parsaei2018; Čorić et al., Reference Čorić, Mandžuka, Gudelj and Lušić2021) provide a more comprehensive view of this field. It is worth noting that some research approach the issues qualitatively, while others address them quantitatively.
A word cloud (Figure 1) was created as a hot index from the 103 papers we collected on this topic. The larger the word, the more frequently it appears. Therefore, the top keyword is ‘collision risk’, and other collision-related terms are also frequently used. This image highlights the current state of the research and indicates the research enthusiasm for collision risk.
Word cloud of collected papers

The model proposed by Zhang et al. (Reference Zhang, Goerlandt, Kujala and Wang2016) was considered adequate for detecting potential collision risks between vessels. However, the adopted ship domain, named the Fujii model, was deemed too risky for navigators and supervisors to use when they needed to take action to avoid potential collisions (Wang et al., Reference Wang, Meng, Xu and Wang2009). In the Fujii model, the major axis of the ellipse domain is only 4 times the ship's length, and the minor axis is 1 · 6 times the ship's length. In other words, this model does not give sufficient time for navigators and/or supervisors to react before the collision; hence, despite being suitable for analysis, this model does not practically improve safety.
By addressing the aforementioned problem, this study has made some improvements to the research conducted by Zhang et al. (Reference Zhang, Goerlandt, Kujala and Wang2016) by using a different ship domain, the Goodwin model. Unlike traditional risk assessment models often involved the probability and consequence of an accident, this model does not use accident probability as an input. Some further improvements included the AIS data-cleaning process, the analysis of overtaking situations with the new model and considering the situation where the observing vessel is located in the boundary of the observed vessel's domain (where d = 0, see Section 3.2).
The rest of the paper is arranged as follows: Section 2 presents the associated conceptual basis. Section 3 describes the mathematical model using the Goodwin domain. Section 4 outlines the testing and verification of the collision risk model. Section 5 presents the discussion and concluding remarks.
2. Conceptual basis
2.1 Automatic identification system
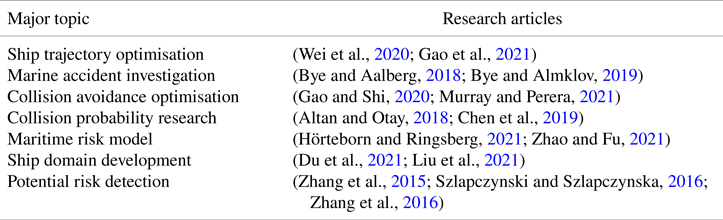
AIS is a commonly used system in the shipping industry because it is a major navigational element. AID data can provide nearby vessels’ navigational status (e.g. visible/invisible), particularly occluded ships’ information, which is considered an important supplement to automatic radar plotting aid (ARPA) function. AIS data are used for a variety of research purposes, as shown in Table 1.
Major topics using AIS data

AIS data are vital information for the duty officer, the Maritime Safety Administration (MSA), VTS and port control. Vessels equipped with AIS can detect other vessels equipped with AIS because AIS data are automatically exchanged between the AIS equipment. AIS data contain two kinds of information: static information and dynamic information. Static information includes the ship's name, maritime mobile service identity (MMSI) number, call sign, IMO number, length, width and so on. Dynamic information includes the ship's position, heading, speed, course, cargo type, onboard crew number and destination, amongst other things. VTS, as a shore facility, can store the AIS data in a particular area which will be helpful for future studies and relevant investigations.
However, a large number of illogical and abnormal data are generated while AIS is in operation, whether on the transmitting side or the receiving side. The reasons can be summarised as follows (Liu et al., Reference Liu, Shi and Zhu2020): (a) signal error, (b) equipment failure or (c) network error. Because noisy data affects the accuracy of subsequent calculations, AIS data processing must be performed prior to analysis.
This paper uses AIS data from Tianjin Port for the model's calculations and evaluation. The data set comprises 1044857 original AIS data from 3383 ships in January 2015. Figure 2 shows the distribution of the original AIS data. There are many abnormal AIS data values; some data points are even spread across the land, which is clearly an error. As a result, data cleaning is required for accurate calculations.
Original AIS data distribution: the red square marks the abnormal data

Since the original AIS data were not properly organised, we sorted them based on the database as follows:


where D is the ship's database; V represents one of the ship's AIS data points; i is the number of ships; j refers to the number of AIS data for this ship; and Name, MMSI, Type, Length, Width, tj, cj, sj, pj, Lonj, Latj are the ship's name, MMSI, type, length, width, present time, course, speed, position, longitude and latitude, respectively. Although the AIS data contain more information, we will only focus on this list.
The MMSI is a unique number assigned to each ship and is not editable from the AIS equipment onboard. If the MMSI is incorrect, it is impossible to ensure that the data are correct. Therefore, data with an incorrect MMSI number (e.g. <9 digits, empty or ‘888888888’type) should be deleted. Notably, the ship's name is rarely wrong and corresponds to the MMSI number. Similarly, the length and width are not editable onboard. Normal vessels do not exceed a length of 450 m or a width of 100 m, and data with abnormal values should be removed. The course has a range of 360° and cannot exceed it; hence, data outside of this range should be deleted. The speed must be considered because obtaining data from a ship that never moves is pointless. Considering both the current and the wind, the lower and upper speed thresholds have been determined to be 3 and 30 kn, respectively. Therefore, if the speed is <3 or >30 kn, it should be deleted, similar to previous research (Liu et al., Reference Liu, Shi and Zhu2020).
Furthermore, the completeness of the AIS track should be considered (Zhao et al., Reference Zhao, Shi and Yang2018). There are several isolated AIS data tracks, including one where the number of the AIS data is less than 10, indicating that it is incomplete. These AIS tracks cannot characterise the ship's motion or identify features of interest. Based on the work of Zhao et al. (Reference Zhao, Shi and Yang2018), track points with $<$ 80 should be removed.
2.2 Ship domain
The ship domain is defined as ‘the waters around the vessel which the navigator would like to keep free of other vessels or objects for safety reasons’ (Goodwin, Reference Goodwin1975). Since 1975, around 10 typical ship domains have been proposed; they are not entirely distinct. The domain can be distinguished based on its circular, elliptical or polygonal shapes. The circular ship domain is represented by the Goodwin model (Goodwin, Reference Goodwin1975) and the Davis model (Davis et al., Reference Davis, Dove and Stockel1980). The elliptical ship domain is described by the Fujii model (Fujii and Tanaka, Reference Fujii and Tanaka1971), the Coldwell model for head-on situations, the Coldwell model for the overtaking situation (Coldwell, Reference Coldwell1983) and the Kijima model (Kijima and Furukawa, Reference Kijima and Furukawa2001). The polygonal domain can be represented by the Smierzchalski model (Smierzchalski, Reference Smierzchalski2001) and the Pietrzykowski model (Pietrzykowski and Uriasz, Reference Pietrzykowski and Uriasz2004). Wang (Reference Wang2013) proposed a dynamic quaternion ship domain (DQSD) that combines ship, human and situational submodels. When simulating the Esso Osaka tanker, the DQSD outperformed the previous ship domain in terms of performance and accuracy. Wang and Chin (Reference Wang and Chin2016) proposed an empirically calibrated elliptical ship domain. When compared to the existing model, it is a free-form ship domain that can represent the non-typical encounters. Zhang et al. (Reference Zhang, Goerlandt, Kujala and Wang2016) developed an AIS-based ship collision detection model. The Fujii model was used to improve differentiation. Zhang et al. (Reference Zhang, Peng, Huang, Zhu, Wen and Zheng2021) presented a dynamically established ship domain for inland waters. This domain divides the surrounding waters of the ship into grids and calculates the grid densities to determine shape and size of the ship domain. It is influenced by the water level and the season (wet or dry).
The circular ship domain proposed by Goodwin is applied in this study because it takes into account the COLREGS. The boundary of this domain is divided into three sectors based on the arcs of the ship's sidelights and stern light, as shown in Figure 3. Typically, the domain parameters are set to r1 = 0 · 85 nm, r2 = 0 · 70 nm and r3 = 0 · 45 nm. Jingsong et al. (Reference Jingsong, Zhaolin and Fengchen1993) proposed a fuzzy ship domain based on fuzzy set theory, which is shown as broken lines in Figure 3. The following are some comments regarding this domain:
1. The domain looks like the arcs of a lighthouse that can display different colours of light simultaneously based on its direction. The arcs have different radii. The arc radius of the starboard is the longest, while the arc radius of the stern is the shortest. The COLREGS are the main reason for this arrangement;
2. The size of this domain is obtained from the research (Wang et al., Reference Wang, Meng, Xu and Wang2009); it is not influenced by the ship's size;
3. The broken arcs within the domain form a fuzzy ship domain, as proposed by Jingsong et al. (Reference Jingsong, Zhaolin and Fengchen1993). The corresponding parameters are r1 = 0 · 68 nm, r2 = 0 · 56 nm and r3 = 0 · 35 nm.
Goodwin ship domain

The Goodwin domain can be described as follows (Wang et al., Reference Wang, Meng, Xu and Wang2009):


where ri (i = 1, 2, 3) is the radius of each domain, dt is 0, φ represents the course of the ship and (xs, ys) are coordinates of the ship in the Earth reference coordinate system.
2.3 Framework of the proposed model
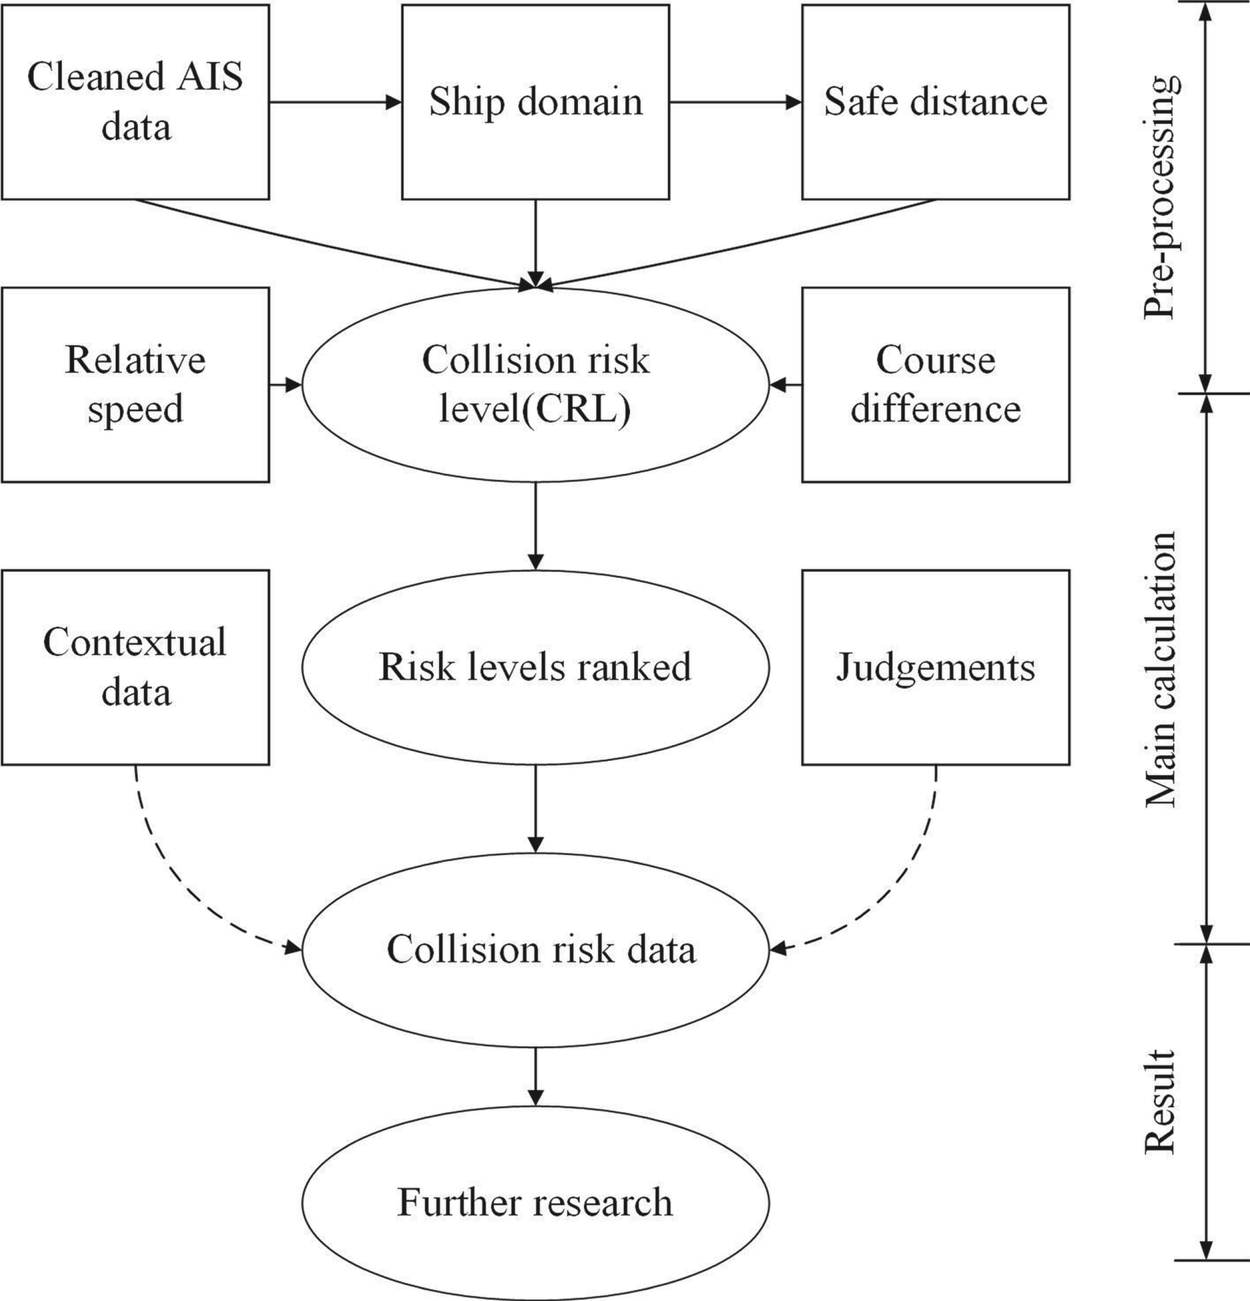
Figure 4 shows the framework of the marine collision risk identification strategy. Its primary steps include preprocessing, main calculation and result presentations. The kernel of this framework should be the collision risk level (CRL), which was developed with several variables based on a set of logic (see details in Section 3). The variables comprise AIS data, ship domain, distance to the domain, relative speed and course difference of the two vessels. The first two were covered in Sections 2.1 and 2.2. The distance to the domain was explained in Section 3.1.1 and the relative speed and course difference were explained in Sections 3.1.2 and 3.1.3, respectively. CRLs are calculated and classified in Section 4.
Framework of the model

In large or busy sea areas, ship encounters happen all the time; judging every one of them would require a consistent effort. This study outlines a filtering procedure that can reduce the effort required to determine the collision risk severity. Compared with previous work (Zhang et al., Reference Zhang, Goerlandt, Kujala and Wang2016), this method provides the concerned parties with more evaluation time to take action.
3. The collision risk identification model
3.1 Model contents
Collision risk research (Mou et al., Reference Mou, Van Der Tak and Ligteringen2010; Goerlandt and Montewka, Reference Goerlandt and Montewka2015b) has shown that the DCPA and TCPA are not the only factors that can be used to assess a collision situation. The relative azimuth of the encountered ships is also an important factor. Furthermore, different meeting scenarios require different timescales for actions; for example, a head-on situation is more urgent than a crossing encounter; however, a crossing encounter is more urgent than an overtaking encounter. Considering these facts, we propose the CRL model, which combines expert knowledge and the following relevant factors:
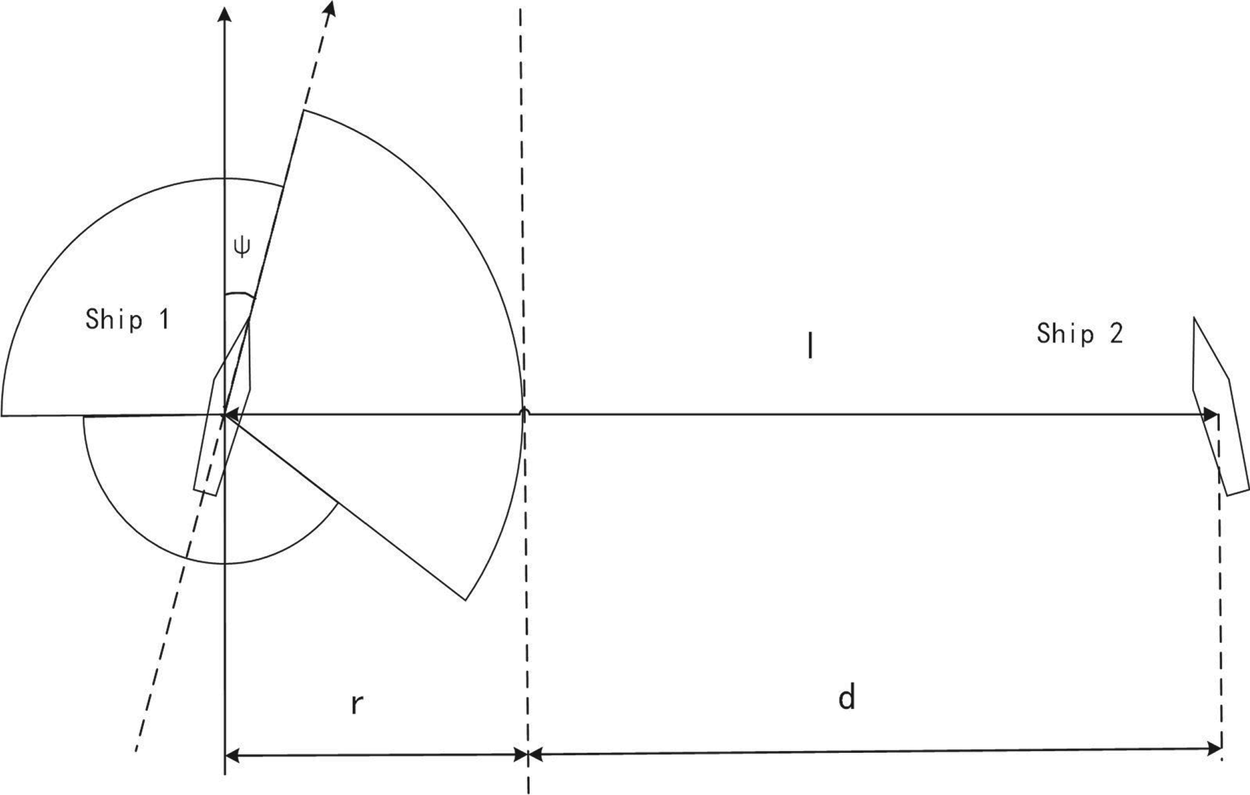
1. The distance d between the target ship and the domain boundary of the own ship, as shown in Figure 5
2. The relative speed v of the encountered ships
3. The course difference h between the encountered ships
Distance between the two ships

These factors are considered the key elements that can identify the collision risk severity during the encounter and can be used as a reference to determine the CRL.
3.1.1 Safe distance d
The safe distance in the model is not the distance between two vessels’ centres, but the distance between the domain boundaries of the observing ship and the observed ship. Moreover, a longer safe distance implies a lower collision risk between vessels, but there is no clear evidence of the relationship between the safe distance and the collision risk. However, Zhang et al. (Reference Zhang, Goerlandt, Kujala and Wang2016) reasonably assumed that the safe distance is inversely proportional to the conflict severity; we adopted this strategy and treated the relationship between the safe distance and the CRL as inversely proportional:


where r is the radius of the safety domain of the observing ship and l is the distance between the encounter ships (Figure 5). The distance l is calculated from the positions of the two vessels. It differs from the distance between two known points in the Cartesian coordinate system and, therefore, the calculation procedure must be illustrated. The positions of the two vessels are (L1, B1) and (L2, B2), respectively, and the safe distance between them can be calculated as:


where ΔL is the difference in longitude, ΔB is the difference in latitude, a is the Earth's ellipsoid long radius, e refers to the eccentricity of the Earth, S is the arc length from the point to the equator, r1 is the latitude radius at the point (L1, B1) and A1 is the ship's orientation at (L1, B1).
3.1.2 Relative speed v
A higher relative speed implies a faster rate of change in the distance between encountered ships. If the v value is negative, the ships are not in danger because they are moving away from each other. However, if the v value is positive, there is a collision risk. Therefore, relative speed should be considered when assessing the collision risk between ships. Based on the senior expert's experience, the relative speed positively correlates with the distance change, and the distance change has a linear relationship with the collision risk. Combining these two facts, we propose a relationship between the relative speed and the CRL:

3.1.3 Course difference h between the encounter ships
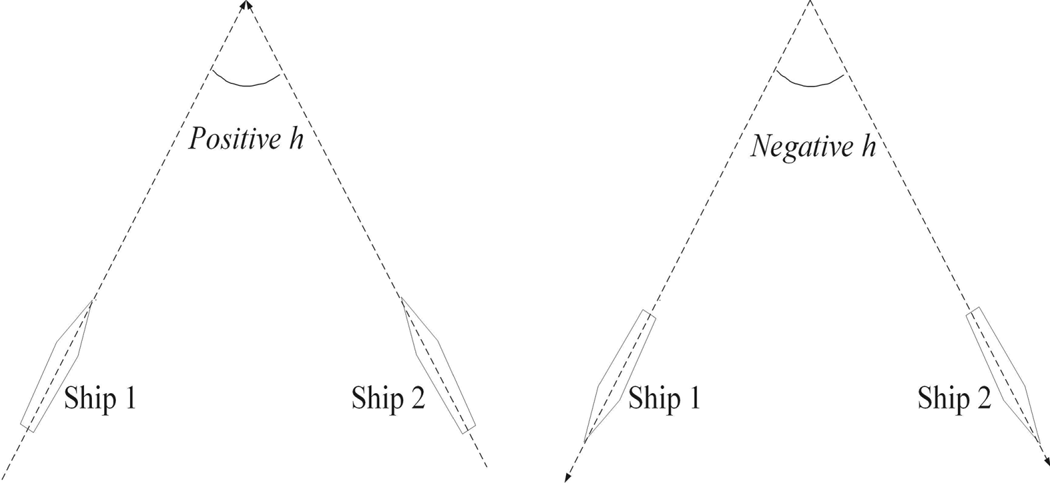
The course difference h is a dynamic angle that changes with the movement of the ships. It has a significant impact on the vessel's collision-avoidance capacity and is influenced by the frequency of manoeuvring actions. The range of h can be defined as [−π, π], where a positive value indicates that the two vessels are moving closer and a negative value indicates that they are moving apart (Figure 6). Zhang et al. (Reference Zhang, Feng, Goerlandt and Liu2020) showed that h can be expressed as an odd periodic function with a period of 2π using a Fourier series as:


where φ(h) is the Fourier series, T is the period and coefficients ai can be expressed as:


Course difference h

Thus, f(h) can be represented using a sine series as:


3.2 The collision risk level formulation
The influencing factors of the model were discussed in Section 3.1. Generally, encountered ships with a large d and small v should be at very low risk of collision, and their CRL value should be small, while a higher CRL value represents an increased collision risk severity, and vice versa. This aligns with the findings in Sections 3.1.1 and 3.1.2 that a combination of the two factors (d and v) can better reflect the risk scenario. Therefore, CRL could be formulated as:

where k is the final coefficient that considers all the factors simultaneously, i is the number of sine series and pi is the coefficients of the sine series. It can be observed that a greater i value implies more precision for f(h). However, a larger i value indicates a more complex calculation and increased calculation time. A good balance must be maintained between precision management and complex calculation. Previous researchers (Wang et al., Reference Wang, Deng and Guo2014; Zhang et al., Reference Zhang, Goerlandt, Kujala and Wang2016) set the example by computing with a fixed i in the Fourier series, and the result remained with enough precision. The formulation can then be modified as:


When v equals zero, the encountered ships are relatively stationary, implying that there is no collision risk because the CRL value is zero. When d equals zero, the observed vessel is located in the boundary of the ship domain of the observing vessel; Equation (23) is not suitable for expressing the CRL in that case. Therefore, Equation (24) can be used in place of Equation (23). When h equals zero, the encountering ships are moving in the same direction (e.g. overtaking), the collision risk still exists, and the formulation must be transformed again. Given that the safe distance and relative speed are the main factors influencing this situation, Equation (25) is a suitable choice.
3.3 Model parameter estimation
Two standard CRL values are predefined to provide reference CRL values. As stated in Section 1.1, the two preset values are referred to Zhang et al. (Reference Zhang, Goerlandt, Kujala and Wang2016) to better make the comparison. The first value occurs when the distance between encountering ships equals 6 nm; this range will draw the attention of the duty deck officers because any vessel entering this range should be monitored, particularly in coastal waters. The second value occurs when d is equal to 1 nm; the officers must thoroughly evaluate the collision risk situation and be prepared to take evasive action to avoid the collision. The equations are:


where E is the expectation of the formulation, m is the number of sampled encounters and n is the Fourier series number. Both m and n influence the accuracy of the formulation. The AIS data used in this paper will help to determine the m value, and n can be determined from relevant references. Wang et al. (Reference Wang, Deng and Guo2014) found that sufficient accuracy will be obtained when n is >5; Zhang et al. (Reference Zhang, Goerlandt, Kujala and Wang2016) used n = 17 to ensure sufficient precision. Herein, we also selected 17 as the n value.
To determine the parameters of Equations (23)–(25), Equations (26) and (27) were applied using the AIS data of Tianjin Port. The least square method was used to calculate the parameters [Equation (28)]. It should be noted that the predefined values serve as a reference for identifying the different encounter situations. Only after connecting the predefined values to the collision risk situations, can the degree of collision risk severity level be determined; thereafter, these values become meaningful.
4. Calculation and evaluation
This section analyses some randomly selected encounter cases to validate the proposed model. On the basis of the aforementioned model, a number of results are shown in this section, including the cleaned AIS data, the CRL model parameters, the discriminant evaluation and the concurrent evaluation.
4.1 Calculation
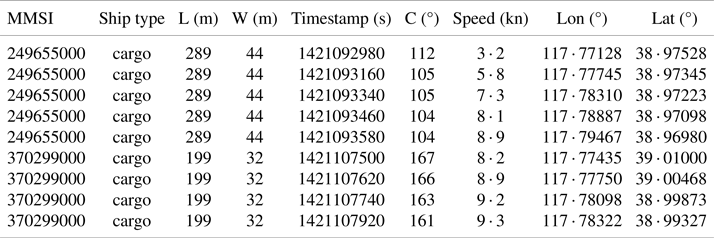
As mentioned, AIS data from Tianjin Port in January 2015 are used for calculation and evaluation. The original messy data have been cleaned, as shown in Figure 7, and the sample AIS data structure is listed in Table 2. The parameters of CRL are presented in Table 3.
Cleaned AIS data distribution

Sample AIS data structure

Parameters of CRL

When discussing the manoeuvrability of different vessels, ship size should be considered. Generally, a larger vessel (excluding warships) has a worse manoeuvrability than a small vessel. In other words, bigger ships require more time to evaluate and take action to avoid collisions. Therefore, it is necessary to classify the vessels based on their size so that an accurate analysis can be carried out. The cleaned AIS data contains 1354 ships, as shown in Figure 8. Using the K-means clustering method, we classified the ships into three groups: small, medium and large (Table 4).
Number of ships in different length sections

Clustering results based on ship length

4.2 Evaluation
4.2.1 Discriminant evaluation
In this section, we randomly analysed five encounter cases from the database to evaluate the CRL model. Similar encounter scenarios were avoided during the process. This measure ensures that the following evaluations have improved discriminant, coherence and result. The encounter situations and corresponding calculation results are shown in Figures 9–13. The highest CRL value is used as a reference because it indicates whether or not there is a potential collision. In the figures, ‘Lond’ represents the longitude, ‘Latd’ represents the latitude and ‘Time’ represents the timestamp. The dashed line is the projection contour of the solid line (not the exact number of positions of the solid line), ‘d’ is the distance to the closest point of the ship domain and ‘T’ means the time to the closest point of the domain.
Encounter between two medium vessels

Figure 9 shows the first case, a crossing encounter between a cargo ship (MMSI:371811000) of 229 m length and another cargo ship (MMSI: 373140000) of 189 m length. After one course change, they were travelling in opposite directions. ‘Zhang et al.’ represents the model proposed by Zhang et al. (Reference Zhang, Goerlandt, Kujala and Wang2016), ‘Proposed’ represents the model developed in this research, same as in Figures 10–13. The minimum values of d from the two models are 0 · 708 nm and 0 · 864 nm. The values of T are 1 · 678 min and 2 · 059 min, and the CRL values are 45 · 679 and 47 · 605, respectively. Based on the results, the proposed method can identify the potential risk 0 · 381 min earlier than the model developed by Zhang et al. (Reference Zhang, Goerlandt, Kujala and Wang2016). The second case is shown in Figure 10. At first, the two vessels (MMSI: 413603000 and MMSI: 636016718) were in a crossing situation before one of them altered course. Both were cargo vessels, one with a length of 151 m and the other with a length of 108 m. The minimum d values obtained from the two models are 2 · 740 nm and 3 · 305 nm, respectively, and the corresponding T values are 8 · 869 min and 9 · 460 min with the CRL values being 57 · 068 and 50 · 934, respectively. Based on the results, the proposed method can identify the potential risk 0 · 591 min earlier than the other one.
Encounter between a medium and a small vessel

Figure 11 shows a crossing situation between the two vessels (MMSI: 205535000 and MMSI: 209389000). Both are cargo vessels, one with a length of 289 m and the other 184 m. The minimum d values of the two models are −0 · 144 nm and −0 · 047 nm, indicating that the observing vessel is within the safety domain of the observed vessel. The corresponding T values are −0 · 466 min and −0 · 154 min with the CRL values of 711 · 606 and 402 · 033, respectively. The results indicate that the proposed method can identify the collision risk 0 · 312 min earlier than the other method.
Encounter between a large and a medium vessel, with high risk

The fourth case is shown in Figure 12. At first, the two vessels are nearly on reciprocal courses, where the small vessel (MMSI: 372229000) is a cargo ship of 80 m length and the large vessel (MMSI: 356984000) is a cargo vessel of 399 m length. Later, both vessels altered their course. The minimum d values of the two methods are 1 · 442 nm and 1 · 773 nm, respectively. The values of T are 6 · 079 min and 7 · 680 min, and the CRL values are 26 · 670 and 24 · 511, respectively. Based on the results, the proposed method can identify the potential collision risk 1 · 601 min earlier compared to the previous model developed by Zhang et al. (Reference Zhang, Goerlandt, Kujala and Wang2016).
Encounter between a large and a small vessel

The fifth case is shown in Figure 13. An overtaking situation occurs between the two vessels: a cargo ship of length 289 m (MMSI: 249655000) and another cargo ship of length 199 m (MMSI: 370299000). The minimum d values of the two models are 1 · 189 nm and 1 · 464 nm; the relevant T values are 23 · 955 min and 29 · 103 min and the CRL values are 131 · 719 and 47 · 870, respectively. Based on the results, the proposed method can identify the collision risk 5 · 148 min earlier than the method of Zhang et al. (Reference Zhang, Goerlandt, Kujala and Wang2016).
Encounter between a large and a medium vessel

From the five encounter scenarios, we determined the following:
1. The proposed CRL model can identify the collision risk severity of encountering ships, allowing for a better understanding of the situation and more time to take action. It has been proven to be reasonable.
2. The CRL model can identify the potential risks earlier than the method developed by Zhang et al. (Reference Zhang, Goerlandt, Kujala and Wang2016), enabling more time for subsequent analysis and response. This is crucial for maritime safety because more time means better chance to survive.
3. The CRL value positively correlates with the potential collision risk. A higher CRL value indicates a higher probability of collision. This can provide another reference for a vessel's safety, in addition to the CPA and TCPA.
4.2.2 Concurrent evaluation
To execute the concurrent evaluation, all the cleaned AIS data from Tianjin Port in January 2015 were used to calculate the CRL values. The calculated CRL values were clustered into several groups and plotted on a nautical chart, each group representing a level of collision risk severity. Collision risk severity levels can vary in different studies. Baldauf et al. (Reference Baldauf, Benedict, Fischer, Motz and Schröder-Hinrichs2011) proposed four levels: safe, caution, warning and alarm. Zhang et al. (Reference Zhang, Goerlandt, Kujala and Wang2016) proposed five levels: regular encounter low, regular encounter high, collision avoidance, close encounter and risk encounter. Zhang et al. (Reference Zhang, Feng, Goerlandt and Liu2020) proposed seven levels: impossible, improbable, uncertain, fifty–fifty, expected, probable and certain. Zhao and Fu (Reference Zhao and Fu2021) proposed the margin of projected collision index, a binary judgement of the collision situation consisting of margin of projected collision in angle, margin of projected collision in speed and margin of projected collision in time. After checking the related research, no criteria concerning the collision risk severity levels were found. Herein, to make better comparison, we chose five levels: no risk, low risk, medium risk, high risk and collision risk. The K-means clustering method was used to divide all the CRL values into five groups corresponding to the five levels. The results are presented in Table 5.
Distribution of CRL and encounter numbers

As seen from Table 5, our results are generally in line with the hierarchical pyramid, which has been proved by Majumdar et al. (Reference Majumdar, Manole and Nalty2021) and Debnath and Chin (Reference Debnath and Chin2010). Figure 14 shows the spatial chart of the clustered CRL values, with different colour representing different collision risk severity level.
Distribution of different CRL values

The lowest level, which corresponds to no risk, happens in most areas within the figure boundary, followed by the low risk level. These two levels are regarded as safe and account for the majority of all encounters. This phenomenon corresponds to the real conditions in navigable waters.
The CRL values of medium risk have 13 · 13%, which mostly occurred in fairways to the harbour and the main traffic lanes. This situation is reasonable because the fairways and the main traffic lanes have major traffic flow and limited navigable space. The amount of high risk and collision risk encounters have 1 · 77% and 0 · 12%, respectively. Most of these values occurred in the outer waterway of Tianjin Port, the southern waters of the Cao Fei-Dian Port and their crossing area, and the fairway off Jing Tang Port. Some high-risk spots also appear in the harbour waters, which is understandable, as vessels pass each other at close distances, and the ship domain probably impacts this situation. Almost no encounters are detected in other sea areas because they are far from the main traffic lanes and ther are no harbours nearby. This is consistent well with the previous research of Majumdar et al. (Reference Majumdar, Manole and Nalty2021). Many CRL values of high risk and collision risk were located close to the harbour; this is reasonable because ships have to pass each other at a close distance in this area. Therefore, it is necessary to note that the CRL model is not intended for use in harbour areas but for coastal water and open sea (Hansen et al., Reference Hansen, Jensen, Lehn-Schiøler, Melchild, Rasmussen and Ennemark2013).
5. Conclusions
The framework proposed in this paper to identify the ship collision risk is an improvement over previous research Zhang et al. (Reference Zhang, Goerlandt, Kujala and Wang2016). This model identified the collision risk of encountered ships based on their influencing factors, which include ship domain, safe distance, relative speed and course difference. Adopting the Goodwin domain in this framework has prolonged the reaction time to deal with potential risks. Furthermore, the domain has considered the COLREGs, which is critically important for maritime safety. The Fujii domain used in the previous study (Zhang et al., Reference Zhang, Goerlandt, Kujala and Wang2016) was a symmetrical elliptical structure in the fore-and-aft direction. This arrangement puts the head-on and overtaking situations in equal positions, which is unsuitable for real navigation. The Goodwin domain has a different radius of boundary based on the scope of the vessel's light arcs. This can differentiate the risk level of vessels approaching from different directions. This is beneficial and convenient for VTS and other parties in monitoring waters and implementing effective collision prevention measures.
Although the judgement from the collision risk severity model is not perfect, it is reasonable and can be used as a reference for detecting potential collisions or monitoring traffic information. The results given by the system are based on the hypothesis that all vessels will continue with their present status. This hypothesis, however, is not perfect. Some additional contextual factors, for example good seamanship, machine malfunction and environmental disorder, also have an impact on the situation and should be the focus of future research.
Funding
This research was funded by the National Natural Science Foundation of China, grant number (52101399).
Competing interests
The authors declare that there are no conflicts of interest regarding the publication of this paper.