Introduction
In recent years, frequency of extreme weather events like floods, droughts, and cyclones has increased globally as a consequence of climate change. In the past decade, India frequently witnessed disastrous floods in various cities and towns.Reference Maurya 1 In future, these flooding are predicted to happen more often and with higher intensity across India.Reference Nanditha and Mishra 2 –Reference Samal, Swain and Samantaray 4 The negative impact of the disaster would be more pronounced in low- and middle-income countries like India due to various factors like high population density, unplanned development, poor infrastructure, inadequate responsiveness, and preparedness.Reference Swain and Vyas 5 Development of disaster response, mitigation, and preparedness plans and policies is very important to minimize the negative impact of natural disasters.Reference Parida, Agarwal Goel and Roy Chowdhury 6 Unpredictability and the damaging effects of natural catastrophes disturb the emotional balance of affected people. Adverse and strong negative emotions like fear, sad and disgust which people experience at the time of disaster increase the risk of developing psychological issues in impacted population.Reference Galea, Ahern and Resnick 7 The World Health Organization (WHO) recommends that, as part of the disaster response, psychological services be made available along with public health services to the affected community as soon as possible after disaster. 8 Assessment of emotional and psychological status of the population in real-time during and just after the disaster will aid public health managers in organizing psychological and social support services for affected population at emergencies.
People now utilize social media to discuss, exchange information, and voice their opinions toward any particular incident or facility or product. Especially during disasters, social networking sites such as Twitter and Facebook are used widely by the impacted people to post updates, look for information, and request assistance.Reference Simon, Goldberg and Adini 9 –Reference Muniz-Rodriguez, Ofori and Bayliss 11 Social networking sites also played vital role in different stages of disaster management such as preparedness,Reference Anson, Watson and Wadhwa 12 response,Reference Imran, Ofli and Caragea 13 rescue,Reference Zou, Liao and Lam 14 recovery,Reference Ogie, James and Moore 10 and mitigation activities.Reference Kurniawan, Sutan and Nurmandi 15 Social media messages shared during disasters are very valuable on-the-ground information since they are posted in real time, which cannot be gathered during a crisis by any other conventional data collection methods. The messages posted by the impacted population not only have information regarding the disaster intensity and impacts but also reflect the emotional state of the people.Reference Olteanu, Vieweg and Castillo 16 Previous researches confirm that data obtained from social media platforms can be utilized to comprehend affected people’s psychological states individually or as a group.Reference Wang, Kosinski and Stillwell 17 –Reference Khadraoui, Arous and Ltifi 19 As the social networking sites provide real-time messages at almost no price during disasters, the posts can be processed for mining information for assessing the emotional state of the affected people. Annotated training data that are specific to the particular domain may provide a more effective emotional classification for machine learning techniquesReference Ikonomakis, Kotsiantis and Tampakas 20 , Reference Hailong, Wenyan and Bo 21 because the online environment and the type of social media content may differ between domains and contexts. Consequently, the creation of a domain-specific training corpus adapted to the Indian disaster setting is necessary for efficient supervised emotional classification. The efficient use of social media data to understand the public’s emotions during emergencies in India is restricted by the absence of domain and location-specific emotional classification models. Using Twitter data from the 2015 Chennai floods as an illustrative case, this study fills this gap by creating an emotion classification model tailored to Indian disasters and identifying spatiotemporal patterns of emotional expressions. The objectives of this study are:
-
• To develop a classification model that extracts emotions from Twitter texts specific to Indian disaster scenarios.
-
• To extract emotions from the Twitter data posted by the people in Greater Chennai Corporation pre, during, and post Chennai floods 2015.
-
• To identify hotspots of negative emotional expressions with respect to time and space.
Methods
Twitter (now X) data was selected as the study’s information source because it has Application Programming Interface (API) for data gathering and tweets are short and concise, making them ideal for text mining and emotion analysis.Reference Karami, Lundy and Webb 22 Also, Twitter allows geo-tagging of user posts; although only a small percentage of users enable this feature, it provides precise location data (geographic coordinates) that researchers can integrate with GIS to analyze regional differences and spatial patterns of information extracted.Reference Ghosh and Guha 23 , Reference Nguyen, Larsen and O’Dea 24 Large-scale, ethically compatible data collection in research contexts is less feasible on social media platforms like Facebook and WhatsApp because of their more stringent privacy settings and restricted data accessibility.Reference Verheijen and Stoop 25 This study was done in three stages as shown in Figure 1.
Methodological framework.

Figure 1. Long description
Starting at the left, the first box labeled Classification Model Development contains two bullet points: Training corpus development specific to Indian disaster context, and Building Machine learning models. An arrow points right to the next box labeled Emotional Classification, which includes Subjectivity Classification (Lexicon based) and Emotion extraction (Supervised - Machine learning Model). Another arrow leads to the final box labeled Spatial and temporal analysis, listing Mapping - Q G I S, Identify hotspots of negative emotions spatially, and Temporal variations of emotions.
The first step is to develop a classification model that classifies Twitter texts into emotions specific to Indian context in disaster situations. In the next step emotional classification was performed to extract emotions from Twitter posted by population in Greater Chennai Corporation (GCC) at the time of floods in the year 2015. For emotional classification, combination of lexicon-based classification model and the machine learning model developed was utilized. Final step is to analyze the emotions that are negative with respect to space and time.
Classification Model Development
The development of a training corpus particularly in conjunction with disaster context in Indian setting is required for efficient supervised classification.Reference Karmegam and Mappillairaju 26 As the study aims at emotional classification of Twitter texts posted during disasters in India, tweets posted in different natural emergency scenarios in India were taken into consideration for creating a training data (twitter messages labelled with emotion classes). In this study, among the six primary emotions listed by EkmanReference Ekman, Dalgleish and Power 27 (sad, fear, anger, disgust, surprise, and happiness), surprise and happiness were merged into one as positive emotion class, as they are untimely in a disaster situation, and other four negative emotions were considered. In this study, five emotion classes were considered for classification that includes, sad, fear, anger, disgust, and positive. In order to develop training tweets, manual annotation of messages from different disasters that occurred in close proximity to Chennai floods 2015 was considered and labeled with five emotion categories. The disaster events taken into account for training corpus creation were Gaja cyclone 2018, Kerala floods 2018, Mumbai floods 2017, Vardah cyclone 2016, and Chennai floods 2015. Using Twitter’s advanced search feature, the tweets connected to the above-mentioned disaster situations were filtered by specifying the time frame and disaster-related hashtag. The filtered messages were then examined manually by two authors for emotional content and each tweet was assigned to one dominant emotion class (sadness, fear, disgust, anger, and positive). The objective tweets that only described an event or situation without showing a clear emotional expression were not included in the training corpus. When a post has more than one emotion, the most prominent emotion class was labeled. Twitter messages that are sarcastic or unclear and posts with ambiguous emotional content were not included in the training corpus. The emotional intensity was not considered; tweets were classified only by emotional class category. The tweets were annotated independently by two authors, and any disagreements were resolved through discussion with another author to reach a final consensus class. Since the number of tweets and the distribution of emotions varied across disaster events, a balanced sampling strategy was used when constructing the training corpus. The proportion of each emotion class was maintained between 15% and 30% of the total dataset. The disaster event, time period taken into account for training tweets, the disaster locations, and the related hashtags were given in online Supplementary file 1.
The classification model was trained using the manually labeled Twitter texts after text tokenization, vectorization, n-gram feature extraction, and conversion into frequency-inverse document frequency (TF-IDF) matrix using functions in text2vec R package. Unigrams, bigrams, and trigrams were considered by specifying an n-gram range of (1,2,3). Machine learning techniques, Naïve Bayes, support vector machine (SVM), and random forest were utilized for performing the classification of tweets into five emotional classes. R programming packages text2vec, e1071, caret, and randomForest were used to process the training data, train, test, and tune the classification models. The algorithm that performed the best was considered for emotional classification of Twitter messages posted during Chennai floods 2015.
Emotional Classification
Study Area
Floods in Chennai have been extremely destructive, occurring roughly every 10 years (1976, 1985, 1996, 2005, and 2015). 28 In the past 10 years, severe floods in Chennai have occurred more frequently in 2015, 2021, and 2023 (Cyclone Michaung). Given their intensity and recovery time, the 2015 Chennai floods were considered the worst in more than a century. Hence, in this study, GCC was considered as a study area and Chennai floods 2015 was taken as a disaster scenario. The metropolitan area of Chennai has been divided into 15 zones and these zones were further subdivided into 200 wards. In 2015, November and December, Chennai and the neighboring districts (Kanchipuram, Tiruvallur, and Cuddalore) of Tamil Nadu received heavy rainfall that led to severe flooding and inundation in the low-lying areas of those districts.Reference Seenirajan, Natarajan and Thangaraj 29 Chennai district is one of the most impacted districts that suffered the maximum damage due to flooding. On December 2, 2015, GCC was formally declared a disaster area.Reference Ramasamy, Vijay and Dhinesh 30 State government reported that there were approximately 500 fatalities and 200 million Indian rupees worth of economic losses due to flooding. In Chennai, at the time of floods, supplies of basic necessities such as milk, water, and vegetables, fuel, and travel were highly impacted. 28
Geo-coded Twitter texts posted before, during, and after Chennai floods, 2015, were collected from 01.11.2015 to 30.12.2015 by Twitter API. Twitter messages posted in both English and Tamil languages were gathered from a 25-mile radius surrounding the geo-coordinates of Chennai, which are 13.0827°N and 80.2707°E. Following the collection of tweets, they were pre-processed, which involves removing duplicate messages, translating messages in Tamil to English, removing stop-words, external links, symbols, and special characters. Tamil tweets were translated into English manually by the authors, who are familiar with the language, to better capture the meaning of colloquial expressions, slang, and code-mixed content commonly seen on social media. Stop word removal was carried out using standard English stop word lists from R package “tm”. In this study, two step emotional classification was proposed, i.e., subjectivity classification of text followed by emotional extraction. Subjectivity classification segregates the tweets into factual and opinion messages.Reference Wiebe and Riloff 31 Sentimentr package in R was used for subjectivity classification and this classified the tweets into three categories (Positive, Negative, and Neutral).Reference Rinker 32 Neutral messages are generally facts and they do not contain any emotional content in it. So positive and negative tweets were alone considered for emotional extraction. Mining emotions from the tweets was performed using the classification model developed in the previous step.
Spatial and Temporal Analysis
The messages that expressed negative emotions such as sad, fear, disgust, and anger were taken for further analysis. The negative emotions as a whole and individually were plotted over the base map of GCC using QGIS (Quantum Geographical Information System) software. In order to analyze the emotional expressions with respect to time, the emotional tweets were segregated into pre disaster (1.11.2015 to 20.11.2015), during disaster (21.11.2015 to 10.12.2015), and post disaster (11.12.2015 to 30.12.2015) periods based on the date of message posted. The variations in the negative emotions expressed in the tweets were analyzed with respect to time using Z-proportional test. Spatial clusters of negative emotions during the disaster scenario were identified.
Results
For developing a classification model that classifies the tweets into five classes (sad, fear, disgust, anger, and positive), the first step is training data configuration. The developed training corpus had 542, 450, 348, 354, and 306 tweets corresponding to sad, fear, disgust, anger, and positive classes, respectively. Some example tweets and their corresponding disaster scenario and negative emotion class were provided in online Supplementary File 2. The classification accuracy of Naïve Bayes, SVM, and Random Forest algorithm were estimated as 0.7575, 0.84, and 0.8025, respectively. As the SVM algorithm (bigram, radial kernel) classifies the tweets with best accuracy and the same was used for emotional extraction from the messages posted during Chennai floods 2015. In total 2462, 2210, and 2100 tweets were collected with geographical coordinates in pre disaster, during disaster, and the post disaster time periods, respectively. The results of subjectivity classification, that is, total number of subjective and objective tweets in pre, during, and post disaster periods, are provided in Table 1.
Results of subjective classification

Table 1. Long description
From left to right, columns are labeled Pre disaster period (1.11.2015 to 20.11.2015), During disaster period (21.11.2015 to 10.12.2015), and Post disaster period (11.12.2015 to 30.12.2015). The first row shows the number of Objective (neutral) tweets: 1401 (56.9 percent) pre disaster, 1167 (52.8 percent) during disaster, and 1292 (61.52 percent) post disaster. The second row lists Subjective (positive and negative sentiment) tweets: 1061 (43.1 percent) pre disaster, 1043 (47.2 percent) during disaster, and 808 (38.48 percent) post disaster. The third row gives total tweets: 2462 pre disaster, 2210 during disaster, and 2100 post disaster.
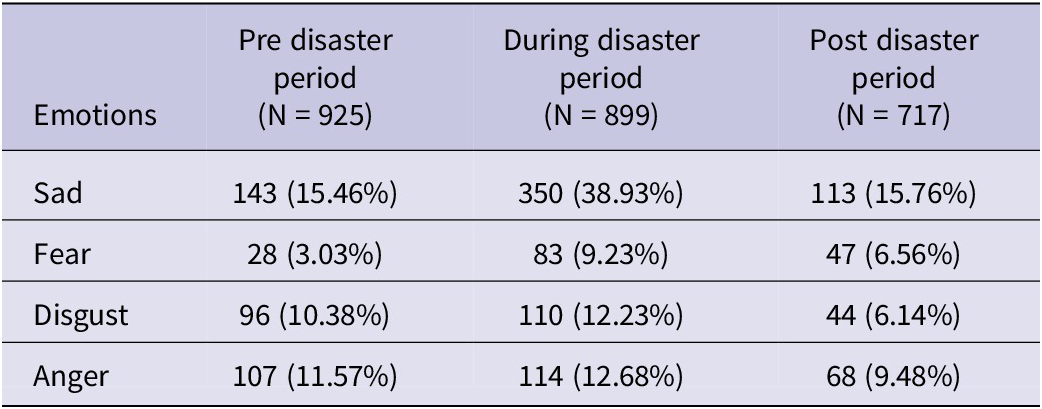
On spatially plotting the tweets collected, few tweets lay outside the geographical boundary of GCC. After removing those, there were 2050, 1864, and 1782 Twitter messages in total. On subjectivity classification, there were 925, 899, and 717 subjective tweets in before, during, and after flood periods, respectively. Among the subjective tweets, on classification of emotions, there were 374, 657, and 272 tweets that expressed any one negative emotion in pre, during, and post disaster time, respectively. It means that there were approximately 40%, 73%, and 38% total negative emotions expressed in Twitter messages before, during, and after disaster periods, respectively. There is an increase of 33% of negative emotions from before disaster to during disaster time periods and the difference is statistically significant (P-value = 0). With respect to total negative emotions, there is a significant decrease from during disaster to after disaster period, but there is no significant difference between before and after disaster period. The number of sad, fear, disgust, and anger tweets and their percentage in all three periods are given in Table 2. The percentage differences in negative emotions with respect to time and their statistical significance are given in Table 3.
Number and percentage of negative emotion tweets in different time periods

Table 2. Long description
The table has four columns labeled Emotions, Pre disaster period N equals 925, During disaster period N equals 899, and Post disaster period N equals 717. The first column lists Sad, Fear, Disgust, and Anger. For Sad, the pre disaster value is 143 (15.46 percent), during disaster is 350 (38.93 percent), and post disaster is 113 (15.76 percent). For Fear, pre disaster is 28 (3.03 percent), during disaster is 83 (9.23 percent), and post disaster is 47 (6.56 percent). For Disgust, pre disaster is 96 (10.38 percent), during disaster is 110 (12.23 percent), and post disaster is 44 (6.14 percent). For Anger, pre disaster is 107 (11.57 percent), during disaster is 114 (12.68 percent), and post disaster is 68 (9.48 percent). Sadness shows the highest increase during the disaster period, with all emotions peaking during the disaster and decreasing post disaster.
Percentage differences in negative emotions with respect to time

Table 3. Long description
The table has three rows for time periods: Pre minus During disaster, During minus Post disaster, and Post minus Pre disaster. Each row contains values for four emotions: Sad, Fear, Disgust, and Anger. For Sad, Pre minus During disaster shows a difference of minus 23.47 percent with P-value 0; During minus Post disaster shows 23.17 percent with P-value 0; Post minus Pre disaster shows 0.3 percent with P-value 0.578. For Fear, Pre minus During disaster shows minus 6.2 percent with P-value less than 0.0001; During minus Post disaster shows 2.67 percent with P-value 0.1435; Post minus Pre disaster shows 3.53 percent with P-value 0.0002. For Disgust, Pre minus During disaster shows minus 1.85 percent with P-value 0.1721; During minus Post disaster shows 6.09 percent with P-value less than 0.0001; Post minus Pre disaster shows minus 4.24 percent with P-value 0.0035. For Anger, Pre minus During disaster shows minus 1.11 percent with P-value 0.5184; During minus Post disaster shows 3.2 percent with P-value 0.0114; Post minus Pre disaster shows minus 2.09 percent with P-value 0.051. Statistically significant changes are observed for Sad and Fear between Pre and During disaster, and for Disgust between During and Post disaster.
There is a significant increase in sadness and fear at the time of disaster when compared to pre disaster period. Even though there is increase in disgust and anger at the time of disaster, the increase is not significant when compared to that in pre disaster period. From during disaster to post disaster time, there is a significant decrease of sad and disgust emotions. When comparing Post and pre disaster period, there is significant difference in fear and disgust. The spatial distribution of pre, during, and post disaster negative emotions in the tweets is given in Figure 2a, b, and c, respectively. The spatial clusters of negative emotions are given in Figures 3a, b and 4a, b.
Spatial distribution negative emotions (a) pre disaster, (b) during disaster, and (c) post disaster.

Figure 2. Long description
From left to right, each panel displays a city map with administrative boundaries and a legend at the lower left. Panel one shows pre-disaster distribution: red dots for anger, green for disgust, blue for fear, yellow for sadness, with most dots clustered in the central and eastern zones. Panel two, during the disaster, shows a denser spread of all emotions, especially anger and sadness, with increased clustering in the central and southern areas. Panel three, post-disaster, shows fewer dots overall, with anger and fear remaining prominent in the central and southern regions, while disgust and sadness are more dispersed. All panels use the same scale bar (0 to 5 km) and coordinate grid (latitude 12.900 N to 13.200 N, longitude 80.200 E to 80.300 E). Legends in each panel clarify color-emotion associations.
Spatial clusters of emotions (a) sad and (b) fear.

Figure 3. Long description
The left panel displays yellow circles representing sad tweet counts, with numbers ranging from 7 to 18, concentrated in central and southern Chennai wards. Larger circles indicate higher tweet counts, notably 18, 17, 13, and 12. The right panel shows blue dots for fear tweet counts, with values from 4 to 5, distributed sparsely across wards, mostly in central Chennai. Both panels use ward boundaries as spatial anchors, and scale bars indicate distances of 2.5 and 5 kilometers. Legends specify marker color and tweet count type.
Spatial clusters of emotions (a) disgust and (b) anger.

Figure 4. Long description
Panel a on the left shows Chennai ward boundaries with green circles representing disgust tweet clusters. The largest cluster, labeled 19, is near the city center, with smaller clusters labeled 9, 8, 5, and 3 distributed throughout other wards. The legend at the bottom left explains green circles as disgust tweet counts and black outlines as Chennai wards. Latitude and longitude are marked along the map edges, and a scale bar indicates distances up to 5 kilometers. Panel b on the right displays anger tweet clusters as red circles, with the largest labeled 7 in the southern region, and other clusters labeled 6, 5, and 4 spread across central and northern wards. The legend at the bottom left of panel b defines red circles as anger tweet counts and black outlines as Chennai wards. Both panels use the same geographic extent and scale for direct comparison.
Maximum number of sad tweets were clustered in the wards of Teynampet zone at central Chennai and wards of Sholinganallur zone at southern Chennai (Figure 3a). Similarly maximum number of disgust tweets were also from wards of Teynampet (Figure 4a). Although the fear and anger tweets that were clustered are not more than the sad and disgust clusters, fear emotions were found maximum at wards of Adyar zone (Figure 3b) and anger tweets were clustered at wards of Perungudi zone (Figure 4b).
Limitations
Every tweet is given a single emotion by the emotional classification model. However, it’s possible that a given social media message can express multiple emotions. As a proof of concept, this study demonstrates the feasibility and effectiveness of using social media content for emotional assessment in the Indian disaster context. However, a more comprehensive model trained on a wider range of disaster scenarios from diverse geographic regions may enhance the accuracy and generalizability of emotional extraction. Only geo-coded tweets were used for the spatial analysis, and these represent a very small proportion of the total tweets available during the flood event. Although the user profiles have location information, most of the time they are incomplete and inaccurate. Hence to avoid uncertainty, only tweets with GPS-based location information were used for analysis. It is possible that messages submitted by individuals who do not provide their location may contain emotional material. During the 2015 Chennai floods, waterlogging caused network problems and power outages in several locations. People in those places were unable to use social media to share their feelings, issues, and status. Hence, the emotional information available on social media may not fully represent the entire affected population. However, during disaster scenarios, there is often a dearth of timely and real-time data. At that situation, social media posts can serve as one useful source of information. Even though it is not representative of the entire population, the information shared on social media platforms can provide quick insights into the situation in real time. Therefore, during emergencies, social media data can be used along with other available data sources to support timely and more effective disaster management decisions.
Discussion
The population’s information-seeking and sharing practices on social media platforms vary depending on demographic, social, cultural, and domain factors.Reference Li, Wang and Lin 33 Therefore, a sentiment and emotional analysis tool or model specifically designed for a particular domain and setting would perform better than a general-purpose classification approach.Reference Denecke and Deng 34 , Reference Islam and Zibran 35 One of the contributions of this study was the formulation of a classification model trained on social media conversations that are particularly pertinent to the emergency situation in India. This study also proposed a two-step classification strategy for text message emotional extraction of social media texts that combines supervised and lexicon-based classification.
The tweets are classified into five emotion classes with the highest overall accuracy when the Bigram and SVM models are combined. The use and high performance of the SVM algorithm for classification of texts in disaster scenarios in various settings have also been confirmed by earlier studies.Reference Glasgow, Fink and Boyd-Graber 36 –Reference Jamil, Hadiyanto and Sanjaya 38 In public health monitoring and surveillance, SVM is one of the most common and effective machine learning techniques for classification of texts.Reference Gupta and Katarya 39 –Reference Kour and Gupta 41 The classification model’s performance and accuracy may be further improved by adding more features and with a deep learning or neural network model.Reference Anthony, Hoi Ki Wong and Joyce 42 , Reference Krishna, Srinivas and Prasad Reddy 43
While social media content classification and information extraction have been researched a lot,Reference Gupta and Katarya 39 , Reference Wahdan, Hantoobi and Salloum 44 –Reference Aziz, Chowdhury and Kabir 46 research that studies the usefulness and applicability of the information that has been collected was limited. In this study, emotions expressed in Twitter texts during floods were extracted, and utilization of the data that was retrieved was also demonstrated. The emotions that were identified from the social media content were examined both geographically and temporally to determine which regions were at risk of experiencing maximum negative emotions. Certain regions with a high likelihood of negative emotions suggest that their residents require social and psychological support to cope with the unforeseen circumstance.
Based on analysis of social media data posted at the time of 2015 Chennai floods, it was found that there were more negative emotions expressed during the floods than there were before or after the disaster. It was evident that the negative emotions were nearly equal before and after the floods, but they only increased during the disaster. Sad and fear emotions were significantly higher during floods when compared to that in pre-disaster period. The more unexpected the flood or disaster, the larger the risk and, consequently, the more intense the emotions. The sudden, sharp rise in water levels brought on by the intense rains that hit Chennai between November 30 and December 2, 2015,Reference Esther and Devadas 47 may have contributed to an increase in fear and sad expression.
All the negative emotional (fear, sad, disgust, and anger) expressions reduced in post disaster period in comparison with during disaster period and among that sad and disgust emotions significantly reduced. During and after the Chennai floods, people volunteered for search and rescue tasks, supported in rebuilding efforts in the most severely damaged regions, and assisted one another.Reference Yadav and Rahman 48 , Reference Mukkamala and Beck 49 Also, volunteers found those in need by using social networking sites as a communication tool. They then made contact with these individuals by putting them in touch with those who stepped forward to provide assistance.Reference Arathi, Pugazhenthi and Arulprakash 50 This social connectedness and assistance among and within the community may be the reason for reduction in negative emotions after disaster.
Clusters of maximum sad and disgust emotions were found to be at regions of Sholinganallur and Teynampet zones. A field assessment study at the time of Chennai floods reports that there was significant flooding in many wards of Teynampet zone, and residential structures suffered significant damage. The situation in the Sholinganallur zone was dire since flood water stagnation persisted for about 20 days in the areas that are in close proximity to Old Mahabalipuram Road. Those who were impacted were left stuck at home without access to basic utilities like power, food, or water. 51 Hence, with respect to space, these clusters (maximum negative emotion expression) were connected with the floods’ intensity and extent of destruction. In the future, the regions that require rapid emotional support can be identified if cluster maps and the spatial distribution of emotions are accessible in real time during the disaster. This would undoubtedly assist public health stakeholders in organizing their rescue and recovery efforts, as well as managers responding to emergencies. Effectively managing the psychological effects of the crisis will also be greatly aided by an understanding of the emotional needs of the impacted population. Previous studies confirmed that patterns in emotional expression and information-sharing behavior during emergencies might vary across different demographic groups.Reference Ikae and Savoy 52 –Reference Thakur, Cui and Khanna 54 Therefore, future study shall explore diversity-based analysis by examining how emotions vary among different demographic groups. This can assist in providing more useful information for risk communication and public health actions.
Conclusion
This research confirms and establishes that social media can serve as a cost-effective tool for identifying and monitoring emotions of affected population during disasters in India. Social media sites like Twitter can assist in identifying emotional distress and its spatial distribution by collecting real-time expressions of sadness, fear, anger, and disgust. Health authorities can use this information to better plan for targeted mental health support, allocate resources effectively, and enhance response and recovery plans. Thus, incorporating social media analytics into digital health frameworks can improve community-centered disaster response and resilience.
Supplementary material
To view supplementary material for this article, please visit http://doi.org/10.1017/dmp.2026.10373.
Availability of data and materials
The datasets analyzed in this study consist of publicly available tweets; however, due to ethical considerations regarding user privacy, they cannot be shared in a public repository. Data are available from the corresponding author on reasonable request.
Author contribution
Conceptualization and methods: BM, SR, RV, and DK. Data collection and analysis: DK and RV. Supervision: BM and SR. Writing draft: DK and RV. Review and editing draft manuscript: BM and SR. All authors read and approved the final manuscript.
Funding statement
No funding was received for conducting this study.
Competing interests
The authors have no relevant financial or non-financial interests to disclose.
AI tools usage declaration
The authors used AI-based tools (ChatGPT and QuillBot) solely for grammar and language refinement. These tools did not contribute to the study design, data analysis, interpretation of results, or conclusions.
IRB approval
Not applicable.
Consent to participate
Not applicable.