1 Introduction
Sibilant systems have recently gained large interest in sociophonetic research, in particular with regard to links between its variation and linguistic and social patterns (e.g. Eckert & McConnell-Ginet Reference Eckert and Sally2003, Stuart-Smith Reference Stuart-Smith2007, Levon, Maegaard & Pharao Reference Levon, Marie and Nicolai2017). The focus is mainly on varieties with /s/ and /ʃ/, which have been explored in particular for English. But also varieties with additional sibilants (e.g. /ç/ or /ɕ/) raise interesting questions as to the sociolinguistic foundations of sound changes, in particular of the merger of fricatives. Such changes have been documented in many Middle German dialects (e.g. those of the cities of Speyer, Wittlich, and the Upper Saxon region, see Herrgen Reference Herrgen1986) or recently in ‘Kiezdeutsch’ (an urban multi-ethnic variety of young speakers in German cities, see Jannedy & Weirich Reference Jannedy and Melanie2014, Reference Jannedy and Melanie2017). Luxembourgish, a Continental West Germanic language of Moselle-Franconian origin with approximately 400,000 speakers, has recently seen a very similar development in its sibilant system. Post-alveolar /ʃ/ (as in Fësch /fəʃ/ ‘fish’) and palatal /ç/ (as in ech /əç/ ‘I, 1sg’) merged to alveolopalatal /ɕ/ (Newton Reference Newton, Flood, Paul, Olive and Wells1993, Gilles Reference Gilles1999, Gilles Reference Gilles, Sasha, Paola, Marija and Paul2019). The voiced counterparts /ʒ, ʝ/ as in Pijen [ˈpiː.ʒən] ‘peaches’ or Ligen [ˈliʝ.ən] ‘lie’ seem to have undergone a similar development (see Gilles & Trouvain Reference Gilles and Jürgen2013: 68–69; Hall Reference Hall2013), but have only rarely been investigated (e.g. Newton Reference Newton, Flood, Paul, Olive and Wells1993).
While the literature agrees that the shift from both /ʃ/ and /ç/ to /ɕ/ closely correlates with speaker age, the reasons for the merger remain so far unclear and somehow speculative. This paper aims to provide further clues as to its origin. A first study (n = 48 speakers) compares speakers from the Centre of the country (more conservative in terms of linguistic change) with the South (more innovative). The second, small-scale study (n = 6 speakers) compares data from the East and the North of Luxembourg (in both cases rural villages). The small-grained sociophonetic analysis of a controlled data set enables an in-depth description of the synchronic situation of this important part of the sibilant system in present-day Luxembourgish. As such, the present paper is a contribution to the sociophonetic description of a small language (in terms of speaker numbers) in a dynamic multilingual context – every Luxembourger is usually fluent in Luxembourgish and in the additional administrative (standard) languages French and German – which has only recently started to attract the attention of the linguistic community. Following the literature about the phenomenon in Luxembourg cited above, different patterns are expected to emerge: First, the merger is hypothesized to be complete in the young generation in all the analysed regions, with mainly the old generation still maintaining a distinction – or at least a larger acoustic difference – between the fricatives. Second, concerning the origin of the sound change in Luxembourg, differences between the regions are expected, namely an advanced development in the South compared to the Centre, the East and the North of the country, related to language contact with Romance.
The overall structure of the paper is as follows: An overview of the phonetics and phonology of the phenomenon and its geographical and temporal distribution is given in Section 2, and the review of the Luxembourgish literature about the merger is summarized in Section 3. The subsequent section describes the data sample and the methodological framework both of the larger (first study) and of the smaller investigation in the rural villages (second study) (Section 4). The results are discussed in Section 5, while a summary and a discussion close the article (Section 6).Footnote 1
2 Phonetic-phonological description of the phenomenon
Similar to many German varieties, the Luxembourgish phoneme /ç/ has two allophones in complementary distribution (Herrgen Reference Herrgen1986: 226; Gilles & Trouvain Reference Gilles and Jürgen2013: 68). [ç] is articulated after front vowels, sonorants and the diminutive suffix -chen (e.g. Dicher [ˈdiç.ɐ] ‘towels’, munch [munç] ‘some’, Meedchen [ˈmeːt.çən] ‘girl’), while the allophone [χ] appears after back vowels (e.g. Duch [duχ] ‘towel’, Broch [bʁɔχ] ‘fracture’). Alveolopalatalization describes the change of the voiceless palatal dorsal fricative [ç] to the voiceless alveolopalatal coronal fricative [ɕ]. Also, the voiceless post-alveolar fricative [ʃ] gradually changes to the alveolopalatal fricative [ɕ] via delabialization (Hall Reference Hall2013), leading to a merger of both fricatives (many authors use the term ‘coronalization’ instead, e.g. Herrgen Reference Herrgen1986, Kreymann Reference Kreymann1994, Ziegler Reference Ziegler1996, Gilles Reference Gilles1999, Lenz Reference Lenz2003; see Hall Reference Hall2013 for a critical discussion of this term). As instances of both shifts, and even confusion of both sounds, are found since studies dating from the middle of the 19th century, it seems plausible that they are inter-related, although /ç/ > /ɕ/ presumably precedes /ʃ/ > /ɕ/ (see Hall Reference Hall2013, Gilles Reference Gilles, Sasha, Paola, Marija and Paul2019).
In Hall’s (Reference Hall2013) phonological account, this merger is the final point of a four-step development. Middle High German /x/ (stage 1) developed into /ç/ (stage 2) and further to /ɕ/ (stage 3). In the fourth step, /ʃ/ finally merges with this new sound, thus reducing the fricative system (diagonal slashes refer to a phonological representation, ‘either an underlying representation or a representation derived by synchronic processes at the relevant historical stage’, Hall Reference Hall2013: 1):
(1) Alveolopalatalization in certain dialects of Central German (following Hall Reference Hall2013: 10)

One common explanation for the merger is the reduction of markedness, the drop of the features [dorsal] and [labial] simplifying the ‘complex’ sounds [ç] and [ʃ], respectively (Herrgen Reference Herrgen1986: 10–13; Gilles Reference Gilles1999: 241–242; Hall Reference Hall2013). They are replaced by a middle sound (‘Zwischenlaut’, Herrgen Reference Herrgen1986: 1) with the unmarked features [coronal, –labial], thus being a ‘minimal consonant’ in terms of articulatory effort needed in production (Herrgen Reference Herrgen1986: 12–13).
While labialization of [ʃ] includes lip rounding and protrusion of the lips (Herrgen Reference Herrgen1986: 8), the lack of these features in [ɕ] is the ‘most striking and easily noticeable difference to [ʃ]’ (Herrgen Reference Herrgen1986: 10). At the same time, both sounds are auditorily very close (Herrgen Reference Herrgen1986: 10, 21–24). In his articulatory account, Dogil (Reference Dogil1992: 65–66) assigns the variation in the articulation of [ɕ] to the lower incisors cavity (LIC) – a free space below the tongue and the main resonator for turbulences produced at the teeth. As long as the LIC is maintained, the precision of the tongue and the lips plays only a minor role and the sound produced is still perceived as phonological /ɕ/.
The areal distribution of the phenomenon includes numerous regions of the Middle German dialect area, see the cards of the Middle-Rhinean language atlas MRhSA, Lenz (Reference Lenz2003) and König (Reference König1989: 247) for Wittlich, König (Reference König1989: 247), Kreymann (Reference Kreymann1994) and Heike (1964) for Ripuarian/Cologne, Herrgen (Reference Herrgen1986) for the Palatinate and Dogil (Reference Dogil1992) for the Saarland. Further evidence is found in other regions, e.g. Grosse (Reference Grosse1957) for Leipzig, Spangenberg (Reference Spangenberg1978) for Thuringian and Remacle (Reference Remacle1944) for Southern Belgium. Herrgen (Reference Herrgen1986: 79) also mentions Alsatian. Recent accounts stem from ‘Kiezdeutsch’ in Berlin (Jannedy & Weirich Reference Jannedy and Melanie2014, Reference Jannedy and Melanie2017) and even the Low-German dialect area bordering Middle German dialect areas (Elmentaler & Rosenberg Reference Elmentaler and Peter2015).
The literature mainly speaks of a polygenetic (and parallel) development (e.g. Gilles Reference Gilles1999, Hall Reference Hall2013), the sound shift probably spreading from urban centres to the surrounding areas (Herrgen Reference Herrgen1986: 97). The first traces of the phenomenon appear in the literature of the 19th century, thus suggesting this to be a rather recent development (Herrgen Reference Herrgen1986: 97–101). As described below, some authors (e.g. Bruch Reference Bruch1954, Gilles Reference Gilles1999) suggest a development due to language contact with Romance in various regions, especially in Luxembourg.
Different phonetic symbols are used in the literature to represent the voiceless alveolopalatal fricative in a variety of dialects (see also Gilles Reference Gilles1999: 236, for discussion), amongst others ʃ* (LWB 1950–1977, Newton Reference Newton, Flood, Paul, Olive and Wells1993), ʃ (Dogil Reference Dogil1992, Ziegler Reference Ziegler1996), ʆ (Herrgen Reference Herrgen1986, Kreymann Reference Kreymann1994) and ɕ (Gilles Reference Gilles1999, Lenz Reference Lenz2003, Gilles & Trouvain Reference Gilles and Jürgen2013, Hall Reference Hall2013). As the symbol ɕ represents the dominant one in the most recent studies, it is chosen also for the present paper. The historical phonemic transcriptions, i.e. /ç/ and /ʃ/, are used for all diachronic analyses, although the sound [ç] is hardly found in the data.
3 Previous research on the merger in Luxembourgish
As for many linguistic phenomena in Luxembourgish, descriptions of alveolopalatalization are rare. A hint of the sound change appears already in Bertrang’s (Reference Bertrang1936) description of the language situation in the ‘Areler Land’ (the area around the Belgian town Arlon at the Western border of Luxembourg, formerly part of the Duchy of Luxembourg and with a dialect very similar to present-day Luxembourgish). Bertrang describes a ‘sizzling pronunciation of the sound ç’ (‘zischelnde Aussprache des Lautes ç’, Bertrang Reference Bertrang1936: 141), which he relates to the inability of the Walloon teachers to pronounce ich (= [ç]), instead using iš (= [ʃ]). In his view, this pronunciation is thus due to language contact with French. Bruch (Reference Bruch1954: 23–24), who also postulates language contact as the main reason for the shift including possible Romance substrate, situates Luxembourg – including the (North-)Eastern, South-Eastern and Western territories as well as the aforementioned ‘Areler Land’ in Belgium – more broadly in an ‘area of palatalization’ (‘Palatalisierungsraum’) of Eastern Romance. He even reports cases of hypercorrection in speaking and spelling, e.g. Haut freche [ç] Botter ‘today fresh butter’ instead of frësche [ʃ], or duːçt for Duuscht ‘thirst’ instead of duːʃt (see Herrgen Reference Herrgen1986 for hypercorrection in the German Palatinate). In recent synchronic descriptions of Luxembourgish, such hypercorrection has not been documented, except for the written domain (Gilles Reference Gilles1999: 239).
The Luxemburger Wörterbuch (LWB 1950–1977, data mainly from 1925–1947 and 1949) represents a broader empirical investigation of Luxembourgish. For some areas in the (North-)East and South-West of the country, the postalveolar and palatal sounds in cited words are marked with ‘*’, indicating a ‘diffusion and commixture’ (‘Trübung und Vermengung’) that most probably represents [ɕ] (e.g. Fierschter [ʃ*] ‘forester’). Robert Bruch’s Luxemburgischer Sprachatlas (LSA 1963) shows a precise distribution of the new sound in specific words and in different villages and cities, which, depending for most parts on the same data, correspond in most cases with those of the LWB (see the maps at www.regionalsprache.de/luxsa.aspx).
Newton (Reference Newton, Flood, Paul, Olive and Wells1993: 636), who bases his investigation mainly on the aforementioned data of the LWB and LSA, claims that the phenomenon is mainly found in non-standard Luxembourgish varieties, while in the standard variety the opposition between /ʃ/ and /ç/ is more strongly observed. This view is in line with descriptions of Middle German regions, where the shift began in the ‘new substandard’ (Herrgen Reference Herrgen1986: 101, 122–123), i.e. in a variety between standard and dialect, starting in urban centres. In Newton’s view, Esch-Alzette, a former mining town in the South-West of Luxembourg with a highly mixed population since the end of the 19th century and a high percentage of new fricatives in the data of 1949 (66.6%), seems a plausible starting point for the innovative pronunciations. High numbers of the new fricative in the small towns of Ingeldorf (62.9%) and Echternach (55%), both in the (North-)East, point to a possible pluricentric genesis (see the map of the occurrences in Luxembourg in Newton Reference Newton, Flood, Paul, Olive and Wells1993: 650). Newton dates the genesis due to lack of further evidence vaguely ‘as being found in the speech of generations preceding that of the 1949 informants’ (Newton Reference Newton, Flood, Paul, Olive and Wells1993: 637).
Gilles’ (Reference Gilles1999: 236–242) acoustic investigation of the phenomenon includes a spectral analysis of three young speakers from three different dialect areas (Centre, South and East). He suggests that the shift from [ç] to [ɕ] has ‘dramatically spread’ (Gilles Reference Gilles1999: 239) in the entire Luxembourgish territory and that in parallel [ʃ] also approximated [ɕ]. Unlike the West Middle German area, where the phenomenon has the status of a ‘secondary’ feature, Gilles (Gilles Reference Gilles1999: 242) claims that in Luxembourg it has become a ‘constitutive feature of all the regiolects and thus also of the National language [= Luxembourgish, F.C.]’. In their depiction of the Luxembourgish sound inventory Gilles & Trouvain (Reference Gilles and Jürgen2013: 68–69) no longer mention palatal [ç], but only the allophones [ʃ] and [ɕ] or [ʒ] and [ʑ], respectively. Schanen & Lulling (Reference Schanen and Jérôme2003: 27), on the other hand, claim that the ‘difference between [ç] and [ʃ] is not always easy to determine, but is in most cases still maintained’. They do not offer empirical support for this claim.
Finally, in a recent account based on crowed-sourced data of more than 1300 speakers for the minimal pair frech/Fräsch ‘mean, cheeky/frog’, Gilles (Reference Gilles, Sasha, Paola, Marija and Paul2019) establishes speaker age as central factor explaining the merger. Only the group of persons ≥ 65 years (slightly under-represented in the sample for methodological reasons related to the mobile application necessary to collect the data) still differentiates both fricatives. On the other hand, speaker sex and regional background do not appear as explaining factor in his analysis, indicating that the change has already reached most of the Luxembourgish population below the age of 65 using the mobile application.
As stated above, the literature mentions different theories as to the genesis of the phenomenon in Luxembourgish, namely a polycentric genesis (Newton Reference Newton, Flood, Paul, Olive and Wells1993, Gilles Reference Gilles1999) and above all language contact with French, mainly in the South-West of the country (Bertrang Reference Bertrang1936, Bruch Reference Bruch1954, Newton Reference Newton, Flood, Paul, Olive and Wells1993). Newton (Reference Newton, Flood, Paul, Olive and Wells1993: 640) even mentions the starting of radio broadcasting in the 1920s in Luxembourg as a possible source, as many broadcasts were given in French (lacking the palatal fricative). As the phenomenon is widespread in other Middle German territories close to the Luxembourgish border, a possible spread from these areas to the Grand Duchy is considered as well (Newton Reference Newton, Flood, Paul, Olive and Wells1993). Finally, a combination of some or all of these factors seems also possible (Newton Reference Newton, Flood, Paul, Olive and Wells1993; Gilles Reference Gilles1999: 241).
All of these investigations are helpful to understand the phenomenon on Luxembourgish territory. Still, many questions as to the origin, spread and sociodemographic variation remain open, mainly due to unbalanced or impressionistic data sets, often lacking acoustic analysis. In both data subsets of the present investigation, the sociophonetic analysis of fricatives from three different generations, including one generation with speakers > 65 years of age (underrepresented in Gilles Reference Gilles, Sasha, Paola, Marija and Paul2019) and speakers from different regions, allows further insights into apparent-time developments and the possible origin of the merger. The next sections present the methodology in detail.
4 Methodology
To answer the research questions as to the origin and the evolution of the merger, in a first study fricatives from 48 persons from two regions of Luxembourg (Centre and South) were collected in an experimental setting. Five minimal pairs were acoustically analysed (first spectral peak and centre of gravity) and the results statistically correlated with sociodemographic factors. In addition to this investigation, an exploratory study with smaller sample sizes (speakers: n = 6, minimal pairs: n = 2) in two further regions of Luxembourg (East and North, n = 3 persons for each region) were carried out. This second study allows insights into the evolution of the sound change in wider parts of the country. The recordings took place in the years 2012–2013 using a Sennheiser HSP 2 microphone with a Sony PCM-D50 audio recorder. Mainly for methodological reasons that have to do with a lack of clear minimal pairs, the present paper focusses only on the voiceless fricatives. The next sections describe word and speaker samples of the first investigation (Section 4.1.) and the exploratory study (Section 4.2). Sections 4.3 gives an overview of the acoustic measurements (both data sets) and the statistical analysis of the data (only first study).
4.1 Sample I: Words and speakers of the first study (Centre and South)
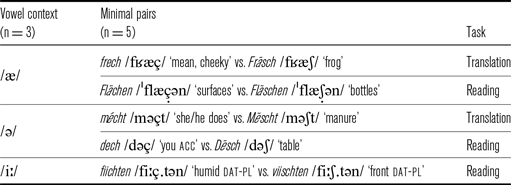
The word sample of the first study consists of the five minimal pairs shown in Table 1.
Vowel context, IPA transcription (historical form) and context of utterance (task) of the five minimal pairs under investigation.

In order to both level and analyse the influence of the preceding vowel context, the target fricatives followed half-open front /œ/ (two minimal pairs), centralized stressed /ə/ (which shows optional light lip rounding, Gilles & Trouvain Reference Gilles and Jürgen2013: 70; two minimal pairs), or long closed front /iː/ (one minimal pair). Four words (two minimal pairs) were uttered during a translation task, in which German sentences read by a native speaker of German and played on an audio interface were orally translated into Luxembourgish. As all Luxembourgers are fluent in German, this task is very useful for the analysis of manifold phenomena in the Luxembourgish sound system (see also Gilles Reference Gilles, Sasha, Paola, Marija and Paul2019: 1591). Six other words were uttered during a subsequent reading task, where a set of Luxembourgish sentences was read aloud. This task allows examining the influence from orthography, namely the different spellings of the token words, i.e. /ʃ/ <sch> or /ç/ <ch>, respectively. The words of each minimal pair occur in the same prosodic context, with only the pair mécht/Mëscht slightly differing in phrasal stress pattern (Mëscht having sentence stress, while mécht has not; for all the sentences see Appendix A). In both tasks, each sentence was repeated twice by the speakers, leading to a total number of n = 960 analysed fricatives. The present investigation was embedded in a broader study about contact-induced variation in Luxembourgish, covering various phonetic and phonological phenomena (Conrad Reference Conrad2017). As such, additional sentences (translation and reading task) carrying further variants (not discussed in this paper) served as distractors. Only the sentences containing the minimal pairs were analysed. The speakers were not aware of the subject of the investigation.
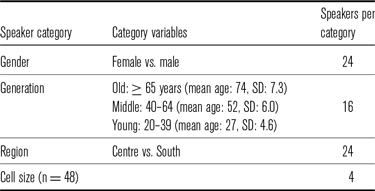
The sociodemographic characteristics of the 48 speakers are listed in Table 2. The different categories were equally balanced, resulting in a cell size of n = 4 (e.g. four old male speakers from the South vs. four young male speakers from the South, etc.).
Overview of the speaker categories by gender, generation, and region.

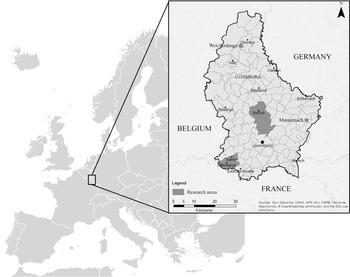
The youngest person was aged 20 years, the oldest person was aged 91. Except for the exploratory study discussed below, the speakers stem from two different regions (marked dark grey in Figure 1).Footnote 2 To take part in the investigation, it was obligatory for the speakers to be born and to have lived in the same region for most of their life, especially in the years before the recordings.
The location of Luxembourg in Western Europe (source: Wikimedia commons), the regions ‘Centre’ and ‘South’ (in dark grey), and the villages of Weicherdange (North) and Manternach (East) from the exploratory study, where speakers were selected for the investigation.

These regions differ in terms of language contact. The central area north of the capital city (Luxembourg-City) is an area considered the cradle of standard Luxembourgish (Gilles & Moulin Reference Gilles, Claudine, Ana and Wim2003) and has no direct border with the neighbouring countries and thus no direct regional language contact. The South(-East) of the country is bordering French-speaking territories in France and Belgium and is thus suspected to have direct regional contact with Romance. It is also part of the former mining area – the so-called ‘Minett’ region – with a highly mixed population and many Romance speaking inhabitants.
4.2 Sample II: Words and speakers of the second study (East and North)
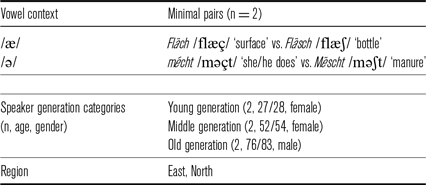
In an exploratory study, additional data from the rural villages of Weicherdange (North) and Manternach (East) was collected (see Figure 1). Including these regions in the analysis allows a broader (regional) picture of the sound change in Luxembourg. The three speakers of each region stem from the same family and represent in both cases grandfather, mother and daughter. The words and speaker characteristics of this data are depicted in Table 3. Like in the first study, every sentence was uttered twice, resulting in n = 48 analysed fricatives. The task was an oral translation from German (the sentences are found in Appendix B).
Compared to the data from the South and the Centre of the country, speaker numbers (n = 6) and minimal pair numbers (n = 2) are low. Also, both Manternach (East) and Weicherdange (North) are small villages in rural areas, while the merger was documented mainly in urban areas (see Sections 2 and 3).
Word and speaker sample of the exploratory study in the North and East of Luxembourg.

4.3 Acoustic measurements
Acoustic measurements for both studies were carried out with PRAAT (Boersma & Weenink Reference Boersma and David1992–2020, version 5.4.17). To reduce co-articulation effects, a part of 40 milliseconds centred around the middle of each fricative was extracted (following Jongman, Wayland & Wong Reference Jongman, Wayland and Wong2000: 1255). While some good results concerning some sibilants in German varieties were recently gained using the Discrete Cosine Transformation (Jannedy & Weirich Reference Jannedy and Melanie2017, see also Gilles Reference Gilles, Sasha, Paola, Marija and Paul2019), for this investigation both the spectral peak (SP) and the centre of gravity (COG) were chosen as principal acoustic measurements. As the results will show, both are adequate to capture the merger of /ʃ/ > /ɕ/ < /ç/ in Luxembourgish (other studies using these values include: for the SP, e.g. Herrgen Reference Herrgen1986, Forrest et al. Reference Forrest, Weismer, Milenkovic and Dougall1988, Gilles Reference Gilles1999, Jongman et al. Reference Jongman, Wayland and Wong2000; for the COG, see e.g. Gordon, Barthmaier & Sands Reference Gordon, Barthmaier and Sands2002, Żygis & Hamann 2003, Boersma & Hamann Reference Boersma and Silke2008, Gilles Reference Gilles, Sasha, Paola, Marija and Paul2019; for a critical discussion of the values in the German context see Jannedy & Weirich Reference Jannedy and Melanie2017).
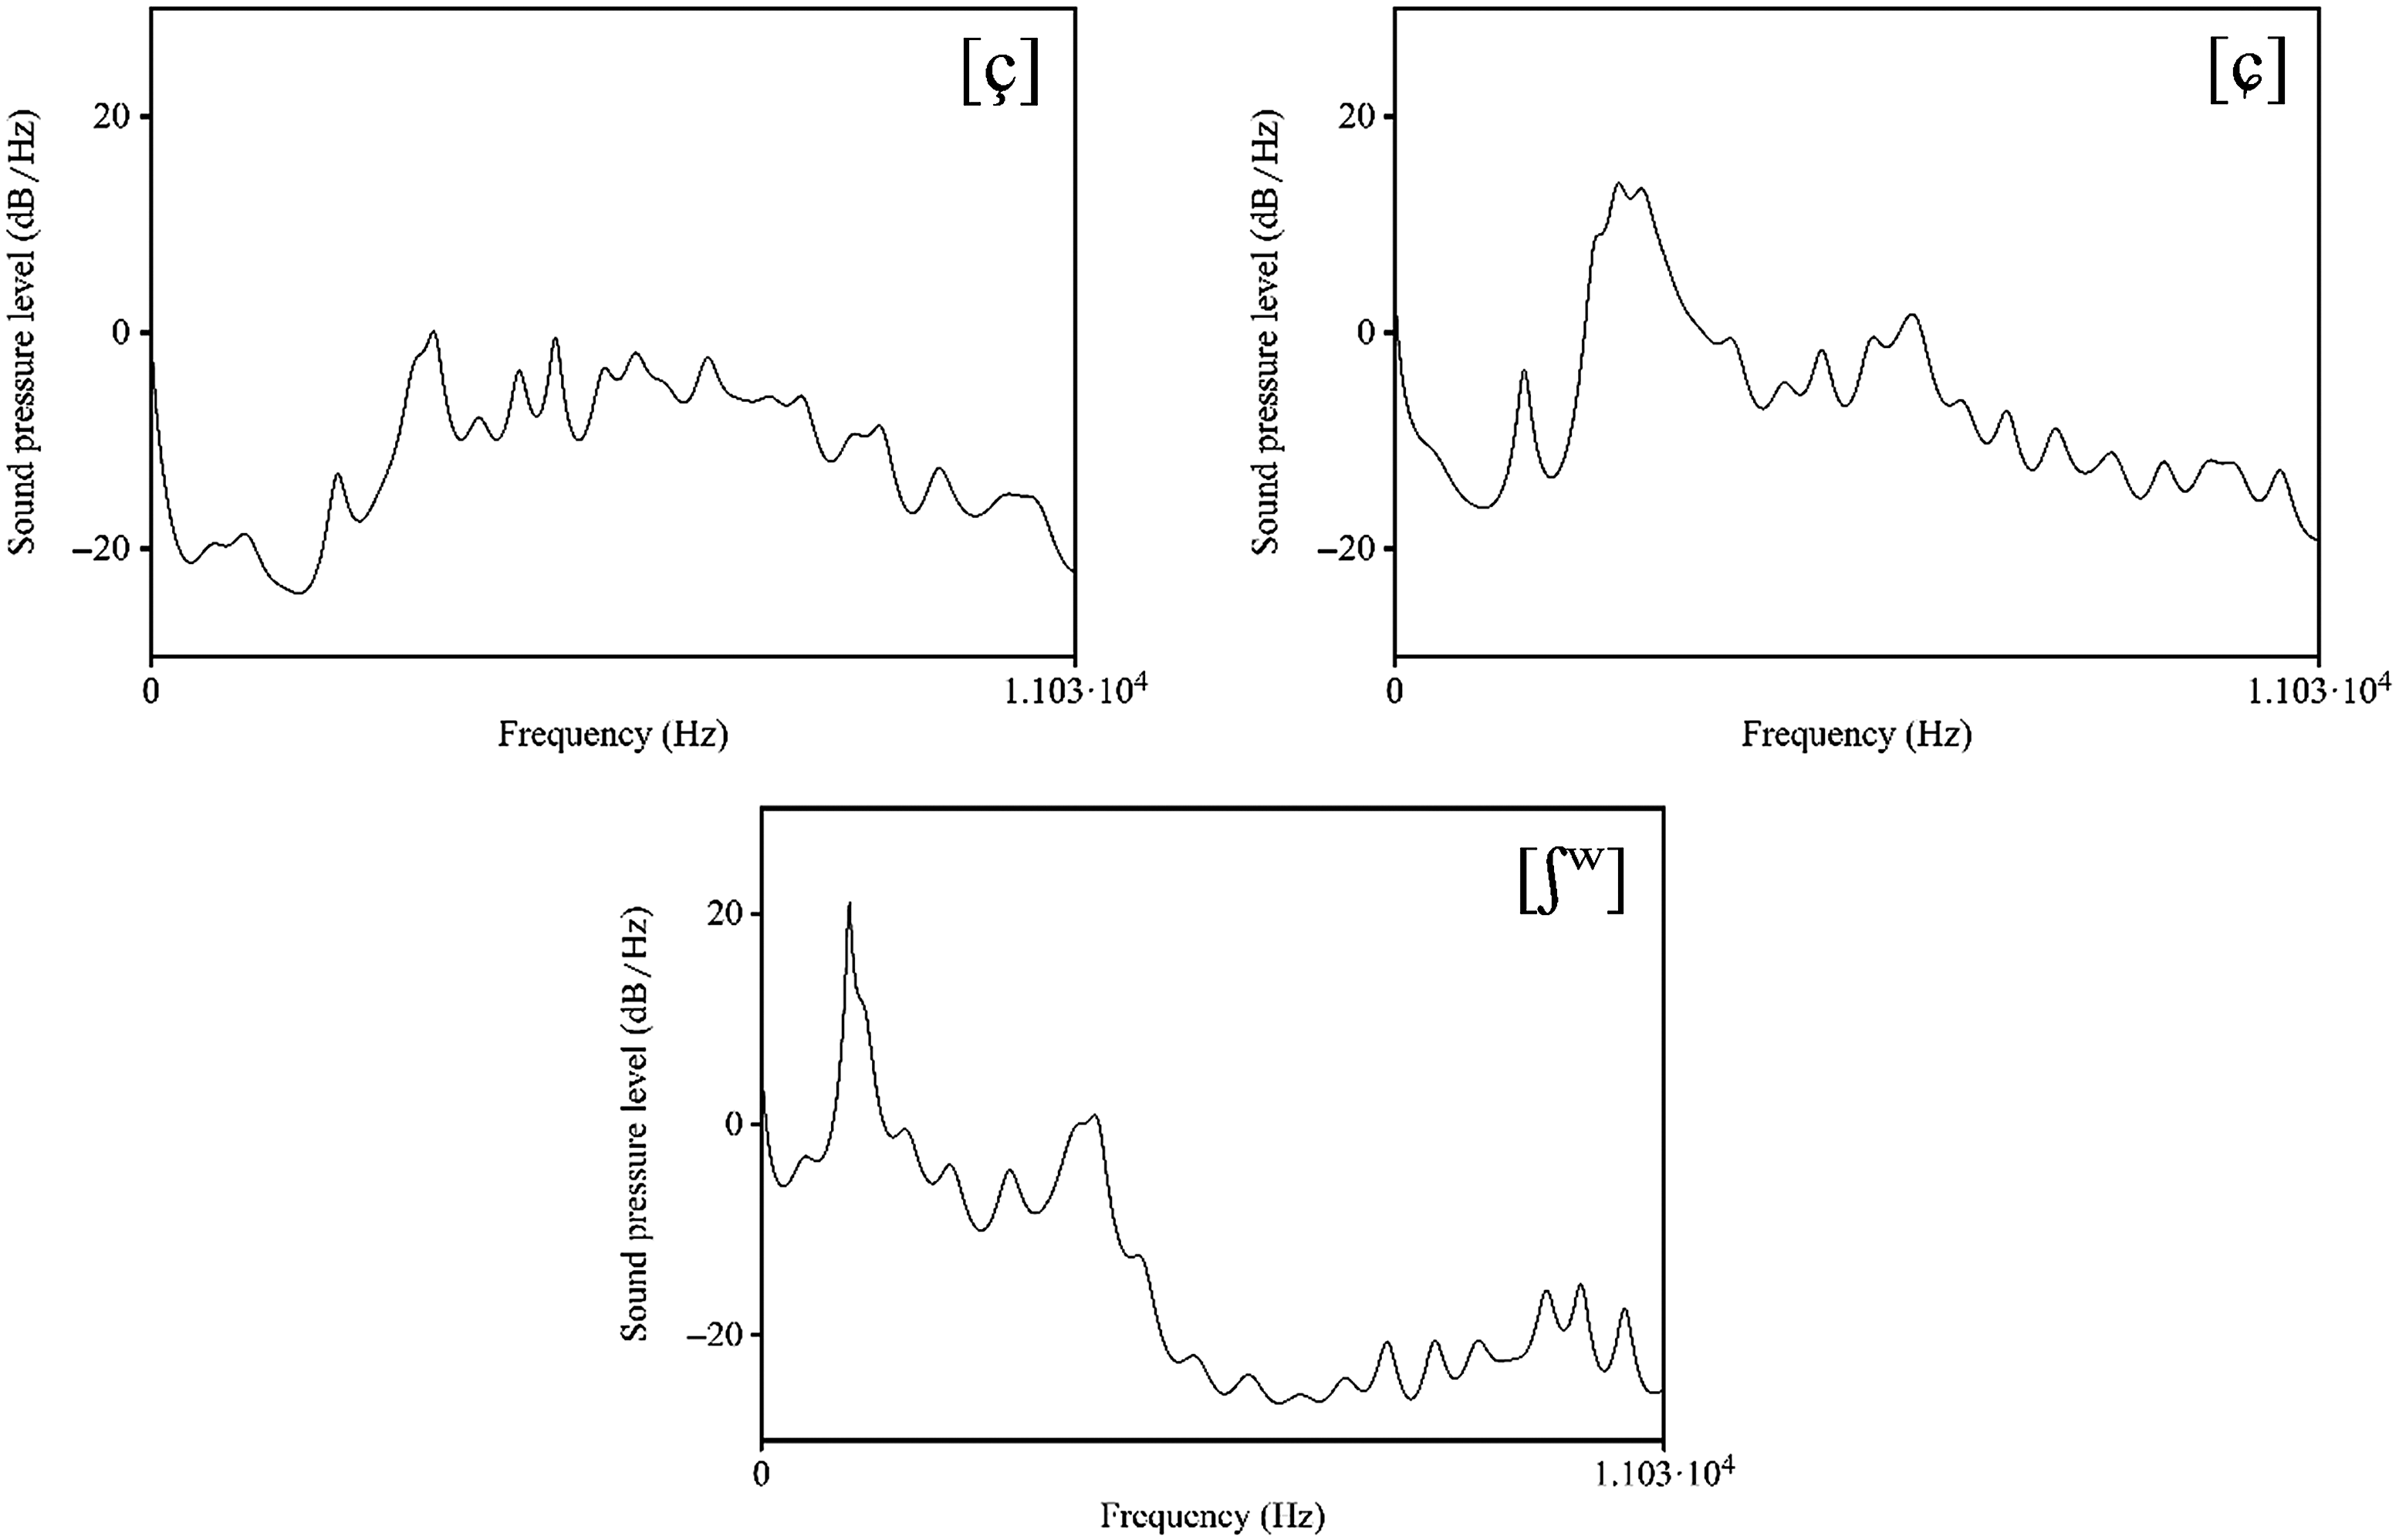
The SP is the frequency in the spectrum with the highest amplitude and correlates with the length of the vocal tract. While the latter increases when the sound source moves to the front, the SP decreases in this case (Pompino-Marschall Reference Pompino-Marschall2009: 196–197). For this reason, SP measurements for the palatal fricative [ç] are highest, followed by alveolopalatal [ɕ] and the lowest values for post-alveolar [ʃ]. Very low SP values indicate lip rounding and protrusion of the lips, as these features lengthen the vocal tract (Herrgen Reference Herrgen1986: 21; Ladefoged & Maddieson Reference Ladefoged and Ian1996: 149, 173–177). Examples of smoothed LPC (= Linear Predictive Coding) spectra for [ç], [ɕ] and [ʃw] are visualized in Figure 2.
Examples of smoothed Linear Predictive Coding spectra (24 peaks): peak for [ç]: 3352 Hz (dech, old female speaker from the Centre), peak for [ɕ]: 2663 Hz (Dësch, young male speaker from the South), and peak for [ʃw]: 1075 Hz (Dësch, old male speaker from the Centre).

The SP was computed using the LPC-smoothing algorithm in PRAAT. Tests with 5, 12, 24 and other number of peaks computed by PRAAT revealed that 24 was the best number to compare the Luxembourgish fricatives (same number chosen by Jongman et al. Reference Jongman, Wayland and Wong2000: 1255). The one with the highest amplitude was taken as basis for comparison of the fricatives. The measurements were manually controlled. To prevent misinterpretation in cases where the highest peak had outlying values, the amplitude of the highest three peaks were calculated for each fricative. If the highest amplitude peak clearly outranged in its Hz value, usually the second or third peak fell into one of the fricative specific ranges and was selected as actual relevant peak (this was the case in 9% of the data, n = 85). Words with odd values for all computed fricative peaks and misarticulated words were marked NA and excluded from the analysis (4%, n = 38). The measurements for both realizations of each word were averaged, resulting in one SP value for each word per speaker. Averaged over the 48 speakers in the first study, both measurements differ only in 11 Hz for the words with /œ/ (standard deviation: 111 Hz), 27 Hz for the words with /ə/ (SD: 83 Hz) and 18 Hz for the words with /iː/ (SD: 84 Hz).
The COG is the average frequency of a specific frequency domain. It was computed from the spectrum of the same extracted 40 milliseconds of each fricative than for the SP, using the standard command ‘Get centre of gravity’ in PRAAT. Like the SP, the COG ‘correlates [articulatory] with frontness of the tongue and with frontness of the place of articulation’ (Boersma & Hamann Reference Boersma and Silke2008: 229) and is thus lower for [ʃ] than for [ɕ] (and [ç]). In contrast to the COG, the SP can be manually corrected, which reduces the amount of data loss in case of idiosyncratic values. For this reason and due to the fact that the results of the COG analysis are very similar to those of the SP, the latter is chosen as default in the following tables and figures, while COG values are reported only for the main results.
Statistical analysis (mixed-effects regression, only first study, as sample numbers in the second study are too small) was carried out using the R-based statistics software RBRUL (Johnson Reference Johnson2009, version 3.1.3). As the main research question is whether the speakers differentiate two fricatives or not, the dependent variable for the mixed-effects analysis as for most of the statistical tests and comparisons in this paper is the difference in the SPs/COGs for /ʃ/ – /ç/ in Hz measured for each speaker and each minimal pair. As independent factors, the RBRUL analysis included the fixed factors gender, generation, region, task and vowel context, as well as all relevant two-way interactions. ‘Speaker’ was chosen as random factor (inter-speaker variation). Additional t-tests following the mixed model (not included in RBRUL) were carried out with the statistics software SPSS (version 24). The coefficient of determination r2 represents the proportion of the variance in the dependent variable explained by the model, while the log-likelihood represents the overall accuracy of fit of the model to the data. The alpha level of significance for all the tests was set as p < .05.
5 Results
5.1 Results of the first study (Centre and South)
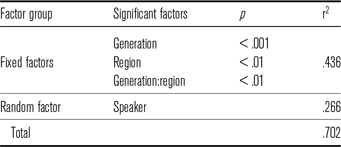
Table 4 presents the results of the best fitting mixed-effects regression model (step-up/step-down modeling function in RBRUL) for the overall differences between the SPs of /ʃ/ and /ç/ (for the COGs: same significant factors and p-values, r2 fixed factors: .395, r2 random factor: .181; total r2: .576).
Significant factors of the best fitting mixed-effect regression model with RBRUL for the differences between the spectral peaks of /ʃ/ and /ç/ in the first study (Centre and South), including p-value and r2.

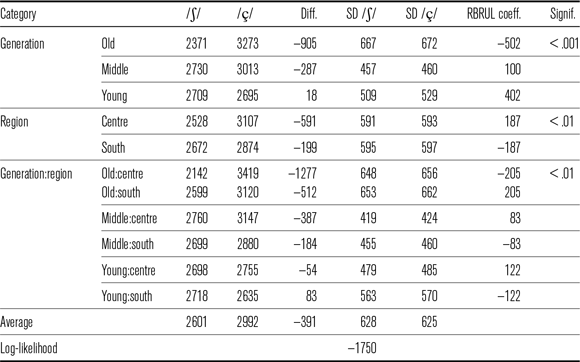
Details of the RBRUL analysis for spectral peaks, including significant factors, values (in Hz) for /ʃ/ and /ç/ and the difference between both (Diff.), standard deviation (SD), RBRUL-coefficients, significance level and log-likelihood (first study, Centre and South).

The model reveals significant differences between the generations as well as between the two regions. Most importantly, there is a significant interaction between both. Table 5 lists the corresponding details (main results for COG differences: old generation: –762, middle gen.: 152, young gen.: 12; Centre: –507, South: –100; old:Centre: –1205, old:South: 262, middle:Centre: –191, middle:South: –112; young:Centre: –83, young:South: 98; log-likelihood: –1778; average COG for /ʃ/: 3551 Hz, average COG for /ç/: 3860 Hz).
Of the variation (expressed by r2), 70% are explained by the model (43.6% by the fixed factors and 26.6% by inter-speaker variation as random factor). No main effect is found for gender, task or vowel context, nor for their interactions. As far as the factor ‘task’ is concerned, this reveals that it makes no difference whether the words are orally translated or read aloud. In other words, there is no significant influence from orthography.
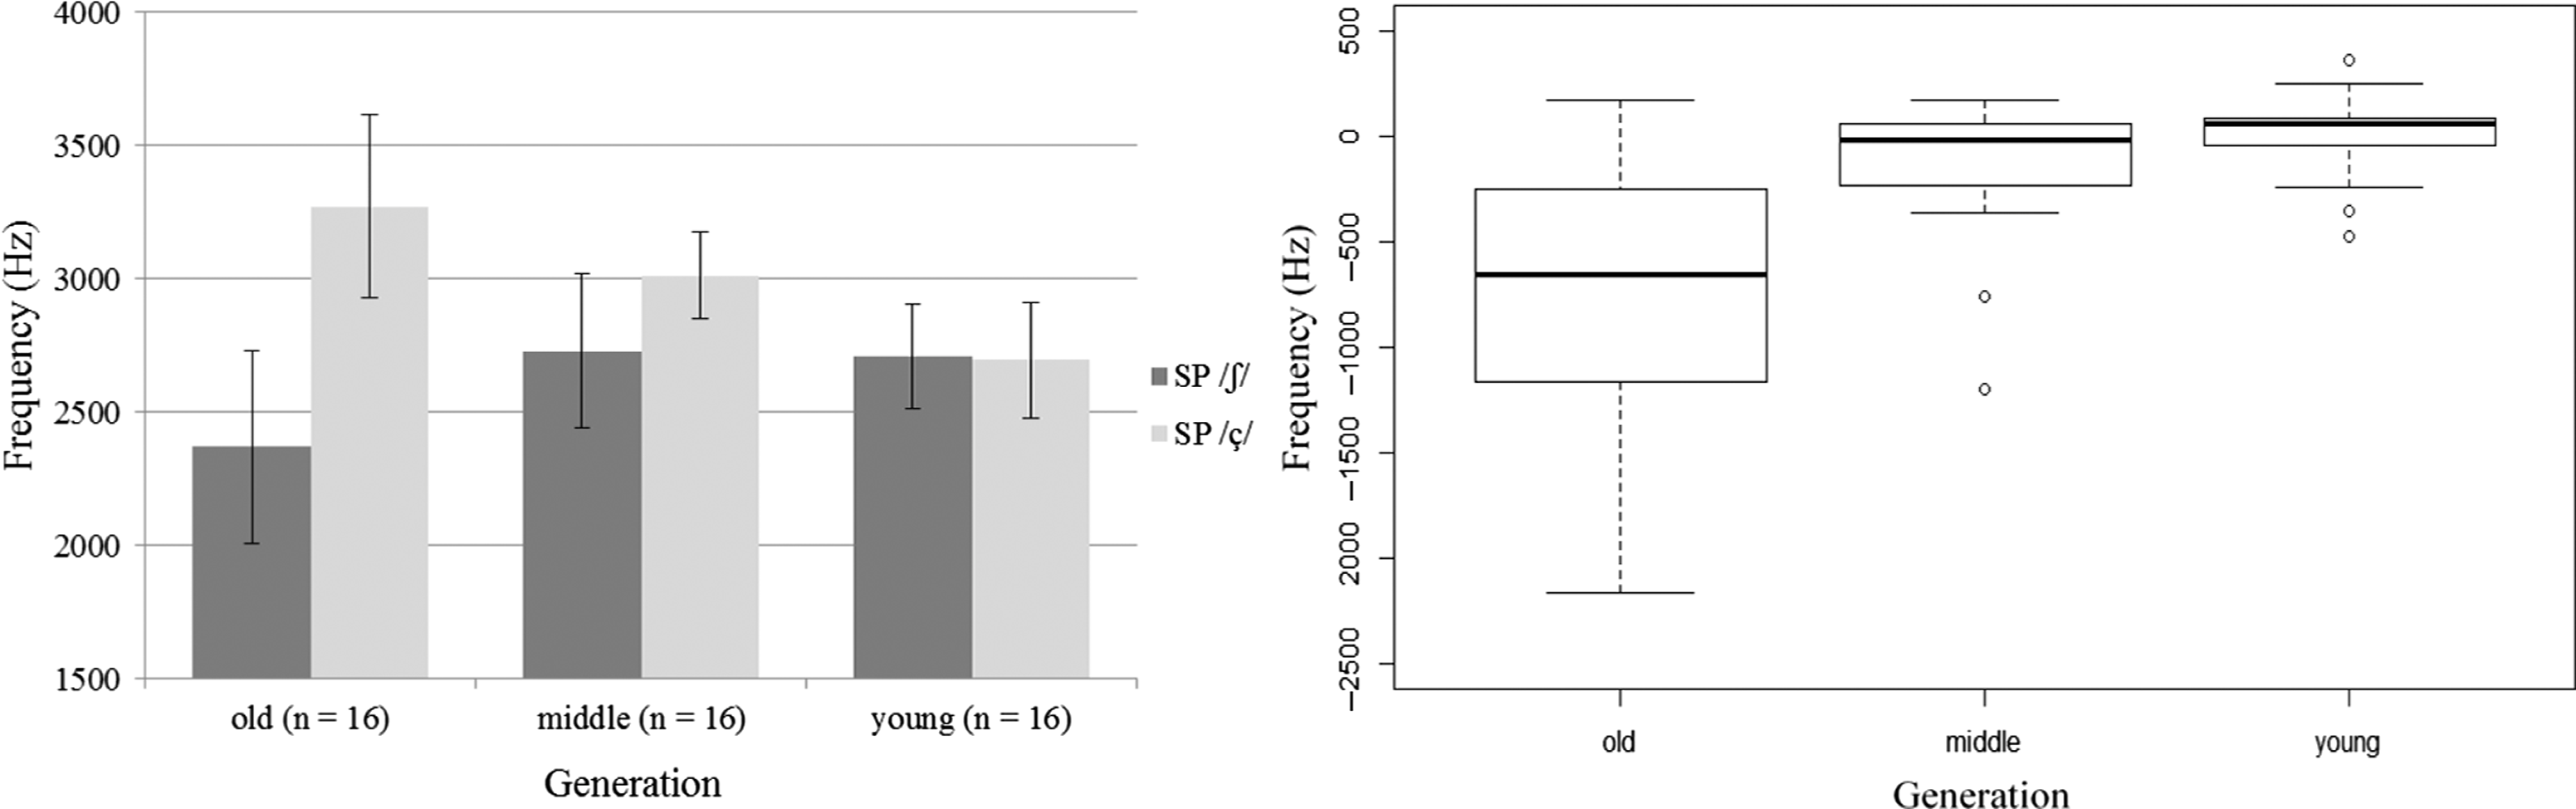
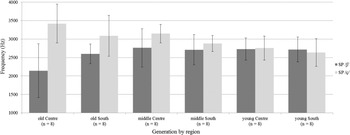
As Figure 3 shows, the young generation does not significantly differ its fricative articulations, while the middle and old generation do.
Average spectral peaks (in Hz) of /ʃ/ and /ç/ for the three generations, including confidence interval (left), and range of the average difference in spectral peaks (in Hz) between /ʃ/ and /ç/ for each speaker in the three generations (Hz), including median for each generation (right) (first study, Centre and South).

Average spectral peaks (in Hz) of /ʃ/ and /ç/ for the three generations and the two regions, including confidence intervals (first study, Centre and South).

The SP values for /ʃ/ and /ç/ in the old generation show an average difference of 905 Hz, indicating that both fricatives are distinguished (paired t-test, t(15) = 5.41, p < .001, r = .56). In the middle generation, the values are much closer together while still significantly different (paired t-test, t(15) = 2.4, p < .05, r = .3). Interestingly, the SPs for both fricatives have changed in this generation. Although there is no additional articulatory data, this can be related to the aforementioned delabialization of [ʃ], on the one hand, and to alveolopalatalization of [ç], on the other. In the young generation, both fricatives have nearly identical average values for the SPs, evidence for a merger of the sounds (paired t-test, t(15) = –.66, ns.).
Very high SP values for /ç/ (> 3500 Hz) in some words for some of the older speakers – e.g. frech (3914 Hz), female speaker from the South aged 76 – reveal that occasionally the palatal fricative [ç] is still realized. On the other hand, the very low SP values (< 1500 Hz) in some words mainly found in speakers from the old generation – e.g. Fläschen (1329 Hz), male speaker from the Centre aged 76 years – can be related to labialization and strong lip protrusion (generally also auditory perceptible in the data), which lowers the SP (see Section 4.3). The values in the younger generations indicate loss of these features. The very similar average SP values for /ʃ/ in both the middle and the young generation could indicate that the change from [ʃ] > [ɕ] via delabialization is rather categorical (drop of the feature) and complete earlier compared to the one from [ç] > [ɕ] (alveolopalatalization), which is gradual.
Figure 4 shows the difference between the age groups in relation to the regions (significant interaction). Unsurprisingly, the young generation shows no difference between the SPs of /ʃ/ and /ç/ in any region. While differences are not statistically significant for the middle generation either, in the old generation speakers from both regions differ between /ʃ/ and /ç/ (paired t-test: Centre: t(7) = 6.13, p < .001, r = .63; South: t(7) = 3.01, p < .05, r = .43; p-values corrected for multiple testing). With average differences of –1277 Hz in the Centre (South: –512 Hz), the old speakers from the Centre are the most conservative speaker group of the investigation in relation to the sound change.
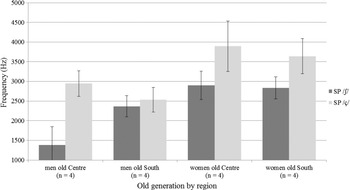
A closer look finally reveals that the men are leading this sound change (Figure 5). While the old women show no significant contrast between the regions – the higher overall Sp values compared to the men are in line with, e.g. Jongman et al. Reference Jongman, Wayland and Wong2000 – the old men differ a lot. The SP values between /ʃ/ and /ç/ for old men in the South differ on average only by 177 Hz, indicating that the merger in this speaker group is already far developed. Old men in the Centre, on the other hand, have the lowest average value for /ʃ/ (1381 Hz) of all the speaker groups and a comparably high value for /ç/ (2944 Hz), resulting in the biggest difference between both values of all the speaker groups (1563 Hz).
Average spectral peaks (in Hz) of /ʃ/ and /ç/ for male and female speakers in the old generation in the two regions, including confidence intervals (first study).

Finally, although the phonological (vowel) context did not show up as a significant factor, some values for SP in the /ə/-context are interesting. In the young generation, the values for /ʃ/ are on average slightly higher than those for /ç/ (positive average SP difference /ʃ/ – /ç/ of 161 Hz; middle generation: –286 Hz; old generation: –951 Hz). Out of the total 48 persons, twelve pronounced the fricative in mécht /məçt/ ‘he/she makes’ with lower SPs than Mëscht /məʃt/ ‘manure’ (two for dech /dəç/ ‘you acc’). Six of these persons belong to the young or middle generation, respectively, while none stems from the old generation. In some cases /ç/ is articulated close to historical /ʃ/, including slight lip rounding (auditory perceivable). Numbers are smaller for context /œ/ (n = 6 tokens) and context /iː/ (n = 2 tokens), including only one person from the old and one from the middle generation (young generation: n = 7).
5.2 Results of the second study (East and North)
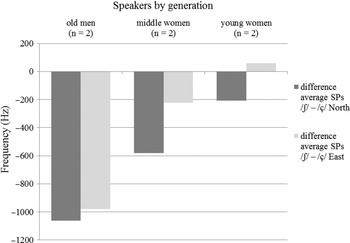
Figure 6 shows the difference between SPs of /ʃ/ and /ç/ from the exploratory study in the East and the North of the country (n = 3 persons per region, belonging in each case to the same family).
Spectral peak difference (in Hz) between /ʃ/ and /ç/ for the three generations in the North and the East (second study).

The parallels to the overall differences in the Centre and the South are striking. For both male old speakers, differences between the SPs of /ʃ/ and /ç/ are around –1000 Hz, indicating a separation in the articulation of both fricatives. In the middle generation, the fricatives approximated each other, while the young generation shows the expected merger. No difference was found between the two minimal pairs (i.e. vowel context). While for further sociodemographic comparisons speaker numbers are too small, the analysis revealed that the merger develops in one and the same family the same way than in Luxembourgish speaking society overall.
6 Summary and discussion
The present paper analysed two data sets of Luxembourgish fricatives with sociophonetic methods, describing the evolution of a sound change in a complex sibilant system. Overall, the investigation of a controlled and highly comparable data set from 48 speakers (Centre and South of Luxembourg) and additional data from 6 speakers from villages in the East and the North of the country confirm the descriptions of Bruch (Reference Bruch1954) and Newton (Reference Newton, Flood, Paul, Olive and Wells1993) and the measurements of Gilles (Reference Gilles1999, Reference Gilles, Sasha, Paola, Marija and Paul2019) as to neutralization of historical post-alveolar /ʃ/ and palatal /ç/ to alveolopalatal /ɕ/ in modern Luxembourgish. The present sociophonetic analysis adds further evidence to the evolution of this merger and its relation to language contact, as discussed below. The comparison of clear minimal pairs in three generations and different regions shows that the merger can be considered complete for the young generation, which again correlates with the results of the crowd-sourced data in Gilles (Reference Gilles, Sasha, Paola, Marija and Paul2019). The experimental setting (oral translation vs. reading task) plays no role in the explanation of the values, indicating that there are no graphematic influences (although graphemes for /ʃ/ and /ç/ are different). Neither does gender (as main factor) nor the vowel context – except for some idiosyncratic phenomena mainly in the young generation (positive differences in SPs mainly for /ə/). This observation is in line with the findings of Gilles (Reference Gilles, Sasha, Paola, Marija and Paul2019: 1592), who discovered a possible ‘new divergence’ of the fricatives in the data of young speakers, needing further investigation. Overall, in accordance with Hall (Reference Hall2013), the merger can synchronically be considered phonologically ‘context free’.
Although sample numbers at this level of investigation are small (n = 4), the data of the old men (≥ 65) from the South are striking in two ways: First, they strengthen the hypothesis of a start of the merger in the South(-East) of the Grand Duchy in the mining areas in and around Esch-Alzette (Bruch Reference Bruch1954, Newton Reference Newton, Flood, Paul, Olive and Wells1993). Language contact with Romance in these areas was strong due to proximity to French speaking territories and a big amount of (male) steel workers in the mining industry in this area at the end of the 19th and the first half of the 20th century. These workers stemmed mainly from Belgium, France and Italy and thus from Romance speaking countries. Since these languages only know /ʃ/ and not /ç/, it is plausible that contact between Luxembourgish and Romance speaking steel workers was the starting point or at least a catalyser of the sound change. Additional evidence for this claim stems from Lorraine and Wallony, mining areas with high contact between Romance and Germanic as well, for which the merger is also documented (Herrgen Reference Herrgen1986: Section 2.2). Second, it is the men that are leading this sound change. The old women from the South do not differ from their peers in the other regions. While the reason, as just discussed, is probably language contact at work, this result figures as a counter-example of the pattern found in numerous sociophonetic and sociolinguistic studies, namely women leading (sound) changes as a driving force (Labov Reference Labov2001).
As the old male speakers in the South recorded for this investigation already neutralized the contrast between the fricatives, the sound change must have started earlier, dating back to the end of the 19th or the beginning of the 20th century (see Newton Reference Newton, Flood, Paul, Olive and Wells1993: 637 for a similar view). In contrast, their peers from the Centre, the North and the East as well as the old women from the South still (clearly) differentiate between [ʃ] and [ɕ] (sometimes [ç]), while most of the younger speakers show (near-)merger between the fricatives. The merger seems indeed to have taken place on the whole territory of the Grand Duchy of Luxembourg. At least for the two old male speakers in the North and the East, regional contact with German (East) or German and French (North) do not seem to play a role in the evolution of the merger, which might indeed have spread from the South to the other parts of the country. As in the middle of the 20th century further parts of the country (mostly small towns in the North-East) show instances of the neutralisation as well, a polygenetic explanation seems also possible (Newton Reference Newton, Flood, Paul, Olive and Wells1993, Gilles Reference Gilles1999). For lack of comparable data in further regions and due to low sample numbers for the rural villages in the East and the North – presumably also less innovative in this sound change compared to urban areas (Herrgen Reference Herrgen1986) – these points cannot be addressed more deeply in this paper. Whatever the internal (reduction of markedness, Hall Reference Hall2013) or external (language contact with Romance) reasons for the start of the sound change are, the data of the present analysis points to the South(-East) as most innovative area and possibly the cradle of the merger in the Grand Duchy.
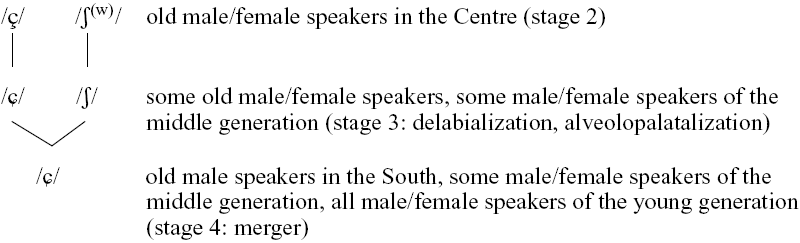
As a result of the documented development, the Luxembourgish fricative system is simplified. The palatal fricatives – assuming that the voiced palatal fricative [ʝ] changed to alveolopalatal [ʑ] as well (Gilles & Trouvain Reference Gilles and Jürgen2013: 68) – are on the verge of disappearing. Only few fricatives of the old men in the Centre show strong labialization of the postalveolar fricative [ʃw]. In line with Hall (Reference Hall2013), both marked features [dorsal, labial] are thus reduced in the concerned Luxembourgish fricatives. This markedness reduction can be followed in situ in the recorded Luxembourgish data. As in the study of Gilles (Reference Gilles, Sasha, Paola, Marija and Paul2019) with crowd-sourced data, the controlled and sociodemographically balanced material in the present investigation allows the documentation of an ongoing sound merger where three stages still appear in the speech community. With reference to the four stages of alveolopalatalization by Hall (Reference Hall2013: 10) this can be summarized for the data set in the Centre and the South of Luxembourg, as in example (2) (for the North and the East, sample numbers are too low for generalizations):
(2) Alveolopalatalization in the Centre and South of Luxembourg
In methodological terms, both the spectral peak (chosen as default in this paper) and the centre of gravity are valid parameters to account for the changes in the sibilant system of Luxembourgish. It represents a usable alternative to the discrete cosine transformation chosen by Gilles (Reference Gilles, Sasha, Paola, Marija and Paul2019).
Not much is known about saliency and awareness of the merger by the speakers themselves. A small self-judgment test at the end of the recordings for this investigation asked the speakers if they pronounced the minimal pairs frech–Fräsch and fiicht–viischt presented on separate sheets of paper the same or different. The comparison of the answers with the spoken data of the same persons revealed 12% mismatches between self-judgment and data. In these cases, speakers either stated not separating the fricatives, while in fact they did (average difference between the fricatives in the spoken data of 662 Hz) or they stated separating the fricatives, while in fact they did not (average difference between the fricatives in the spoken data of 86 Hz). Only a broader investigation on attitudes towards Luxembourgish pronunciation norms in combination with perception tests, also investigating the perceptual boundaries of the sounds in Luxembourgish (following, for instance, Jannedy & Weirich Reference Jannedy and Melanie2014, Reference Jannedy and Melanie2017), could shed further light on this matter.
To conclude, the expected patterns mentioned in the introduction eventually emerged in this fine-grained sociophonetic analysis of an important part of the Luxembourgish sibilant system. First, the fast pace of the sound change to /ɕ/ was again documented, with a reduction of the system in only a few decades. Second, regional (proximity to French speaking territories in the South) and above all social (direct contact with Romance speakers in the mining industry) language contact with Romance appears indeed as important explaining factor in the merger of /ʃ/ > /ɕ/ < /ç/ in Luxembourgish. The old men leading the sound change is interesting compared to manifold studies revealing women to lead (Labov Reference Labov2001). Overall, the analysed fricatives of Luxembourgish seem to be as strongly constrained by social and linguistic factors, as are the thoroughly investigated sibilants /s/ and /ʃ/ in varieties of English. Language contact, as shown in this paper, is a relevant factor worth considering in further sociophonetic research about sound changes in sibilant inventories.
Acknowledgments
For valuable comments on former versions of this paper, I thank Jane Stuart-Smith, Peter Gilles, Uta Reinöhl, Patrick Honeybone, the Associate Editor of the Journal of the International Phonetic Association and two anonymous reviewers. For methodological support, I especially thank Jeanin Jügler (PRAAT scripts) and Silke Hamann.
Appendix A. Sentences of the first study
In the examples, the letters realised as fricatives are underlined; tt = translation task, rt = reading task.
déi nei Generatioun ass frech
‘the new generation is mean’ (tt)
op dem Steen sëtzt ee Fräsch
‘on the rock sits a frog’ (tt)
hie mécht eng Expeditioun an Afrika
‘he’s on an expedition in Africa’ (tt)
op der Mëscht sëtzt deen eenzegen Hunn vum Haff
‘on the manure sits the only rooster of the farm’ (tt)
Hie kann de Film am Kino guer net genéissen, well d’Kanner op de viischte Plazen ze haart sinn.
‘He’s not able to enjoy the movie, the children on the front seats being too loud.’ (rt)
Bei eisem neien Noper doheem ass d’Loft net gutt wéinst de fiichte Planzen an der Wunneng.
‘At our new neighbour’s home the air is not good due to the humid plants in the apartment.’ (rt)
Dës penibel Affär betrëfft nëmmen hatt an dech: Kee soss brauch eppes dovunner ze wëssen.
‘This fastidious affair concerns only her and you: Nobody else needs to know something about it.’ (rt)
De Finanzminister leet d’Fakten elo op den Dësch: Den Euro ass wierklech a Gefor.
‘The finance minister now lays the facts onto the table: The Euro is really endangered.’ (rt)
Aus logistesche Grënn leien am Lager vun dëser Entreprise just nach eidel Fläschen.
‘Due to logistic reasons there are only empty bottles lying in the storage of this company.’ (rt)
De Minister klot iwwert e quantitative Problem beim Bauland an der Haaptstad: Et gi fir nei Wunnenge kaum nach eidel Flächen.
‘The minister laments a quantitative problem concerning building land in the capital city: There are scarcely empty surfaces for new homes.’ (rt)
Appendix B. Sentences of the exploratory study
In the examples, the letters realised as fricatives are underlined (translation test).
déi eidel Fläsch war um Balkon
‘the empty bottle was on the balcony’
déi ganz Fläch war veräist
‘the whole surface was icy’
de rouegen Tourist mécht Fotoe vum Palais
‘the quiet tourist takes pictures of the palace’
an der Mëscht wunnt eng sympathesch Seechomes
‘in the manure lives a friendly ant’