

Introduction
Self-rated health is a widely used measure in gerontology and is a consistently strong predictor of survival, functional deterioration, morbidity, and health service utilization in older adults (Goldman et al., Reference Goldman, Glei and Chang2004). Self-rated health was employed in several investigations of older adults with schizophrenia (OAS) (Bankole et al., Reference Bankole, Cohen, Vahia, Diwan, Kehn and Ramirez2007; Cohen et al., Reference Cohen, Mani and Ghezelaiagh2019; Vahia et al., Reference Vahia2008). In two of these studies, self-rated health was found to be significantly associated with higher quality-of-life ratings in a regression analysis (Bankole et al., Reference Bankole, Cohen, Vahia, Diwan, Kehn and Ramirez2007) and greater illness awareness in bivariate analysis (Cohen et al., Reference Cohen, Mani and Ghezelaiagh2019). Other studies include self-rated health as part of broader instruments such as the Short-Form 36 Health Survey (Depp et al., Reference Depp, Davis, Mittal, Patterson and Jeste2006; Sciolla et al., Reference Sciolla, Patterson, Wetherell, McAdams and Jeste2003).
In light of worldwide demands to address the needs of the rapidly rising number of OAS (Cohen et al., Reference Cohen, Freeman, Ghoneim, Vengassery, Ghezelaiagh and Reinhardt2018), self-rated health provides an attractive research and clinical tool for assessing this population. It has been conceptualized as the global result of the influences of physical health, psychological well-being, and perceived quality of life. Ratings are easily obtained via a single question, typically categorized as “poor,” “fair,” “good,” or “excellent.” It is an indicator significantly associated with a population’s state of health and possibly with mortality, and it can be used by policymakers to guide healthcare needs and services, and identify at-risk individuals (Abuladze et al., Reference Abuladze, Kunder, Lang and Vaask2017; Hambleton et al., Reference Hambleton, Clarke, Broome, Fraser, Brathwaite and Hennis2005; Ocampo, Reference Ocampo2010). However, there are no studies comparing factors that influence self-rated health in OAS with those of persons in the general aging population. Therefore, the aim of this study was to determine the utility of the self-rated health measure for OAS compared with nonschizophrenic adults in the community by (1) examining whether the self-rated health model for elderly adults developed by Ocampo (Reference Ocampo2010) attains significance for community dwelling OAS; (2) identifying those factors in the model that are associated with self-rated health, and (3) contrasting these findings with a community comparison (CC) group.
Method
Details of the initial study methods are provided elsewhere (Diwan et al., Reference Diwan, Cohen, Bankole, Vahia, Kehn and Ramirez2007). Using a stratified sampling method, we recruited subjects aged 55 years and over living in the community who developed schizophrenia before the age of 45 years. We attempted to recruit approximately half of the subjects from outpatient clinics and day programs and the other half from supported community residences. We included persons with a Diagnostic and Statistical Manual of Mental Disorders, Fourth Edition, Text Revision (2000), who met the criteria for the diagnosis of schizophrenia or schizoaffective disorder, as assessed by clinical agency staff and by a lifetime illness review adapted from Jeste and associates (Jeste et al., Reference Jeste, Symonds, Harris, Paulsen, Palmer and Heaton1997). We excluded those with cognitive impairment who were too severe to complete the questionnaire, i.e. those with scores of less than 5 on the Mental Status Questionnaire (Kahn et al., Reference Kahn, Goldfarb, Pollack and Peck1960).
We recruited the CC group by using Wessex Census STF3 files for Kings County and randomly selected block groups as the primary sampling unit. We attempted to interview all persons aged 55 years and over in a selected block group by knocking on doors. In order to increase the response rates, we also recruited subjects from the selected block group at houses of worship, senior centers, and through personal references. We excluded those with histories of treatment for schizophrenia or schizoaffective disorder.
The rejection rate was 7% in the schizophrenia group and 48% in the community group. The low rejection rate among the former reflected the high level of receptivity to the project among individuals within community residential and clinic programs in conjunction with remuneration for participation ($75 for persons in either OAS or CC group). We obtained written informed consent from all subjects. The final schizophrenia sample consisted of 249 persons; 39% lived independently in the community and 61% lived in supported community residences. From the original community sample (n = 206), we selected 113 persons who more closely matched the schizophrenia sample for age, gender, race, and income. Forty-nine percent of both groups were women. The racial distribution was African American (34%), Caucasian (55%), Latino (9%), and Other (2%) in the OAS group versus African American (36%), Caucasian (60%), Latino (2%), and Other (2%) in the CC group. Median income for both groups fell within the same category ($7000-$12,999). The absolute difference in the mean ages between groups was small (OAS group: 61.4 years; CC group: 63.0 years), although this difference attained statistical significance (Table 1). (Note: we have provided statistical tests for only those comparisons that attained significance; other analyses are available from the authors.)
Correlations of predictor variables with self-rated health schizophrenia and community comparison groups, using Ocampo’s model

Note: For correlations, Spearman’s rho and point-biserial correlations were used for continuous/ordinal and dichotomous independent variables, respectively. For groups’ comparisons, t tests and chi square tests were used for continuous and categorical variables, respectively. For t tests, the unequal-variance t test was used when findings of the Levine test were significant.
ADL = activities of daily living; PANSS = Positive and Negative Syndrome Scale; CES-D = Center for Epidemiological Studies−Depression; DRS = Dementia Rating Scale.
* P <.05.
** p <.01.
*** p <.001.
Instruments
We used an adaptation of Ocampo’s (Reference Ocampo2010) theoretical model of factors affecting self-rated health in older people. The advantage of using a theoretical model was that it allowed for the rational inclusion of multiple variables, as well as the potential for generalization of the results across sites. We consolidated Ocampo’s predictors into five dimensions: sociodemographic, biological, psychiatric, functional, and health perception of past self (temporal comparison) and age peers (social comparison). These dimensions were examined using 12 variables (Table 1). The dependent variable was a self-rated health scale that was based on subjects’ response to the query “How would you rate your overall health at the present time?” The choices were “poor” (1), “fair” (2), “good” (3), or “excellent” (4). The variables used in our analyses were derived from the following instruments: Positive and Negative Syndrome Scale (PANSS; Kay et al., Reference Kay, Opler and Fiszbein1992), Dementia Rating Scale (DRS; Coblentz et al., Reference Coblentz, Mattis, Zingesser and Peck1973), Center for Epidemiological Studies−Depression Scale (CES-D; Radloff, Reference Radloff1977), Community Integration Scale (Abdallah et al., Reference Abdallah, Cohen, Sanchez-Almira, Reyes and Ramirez2009), and the Multilevel Assessment Inventory and the Physical Self-Maintenance Scale (Lawton et al., Reference Lawton, Moss, Fulcomer and Kleban1982). The latter generated the Activities of Daily Living (ADL) Scale (higher scores indicate better functioning) and the number of physical disorders. We used items on the general questionnaire to determine various sociodemographic characteristics, the number of prescribed medications, the frequency of medical services, alcohol use, level of psychiatric illness awareness, perceived health versus age peers (“better” [3], “same” [2], and “not as good” [1]), and current perceived health versus 3 years ago (“better” [3], “same” [2], and “not as good” [1]).
The internal reliability (Cronbach’s alpha) scores of the scales were all greater than 0.70. The project staff trained interviewers with the assistance of audiotapes and videotapes. Interviewers were periodically monitored using audiotapes of their interviews. The intraclass correlations ranged from 0.79 to 0.99 on the various scales.
Statistical analysis
Initially, for both the OAS and CC groups, we conducted a bivariate analysis with respect to self-rated health and various predictor variables using Spearman’s rho and point-biserial correlations for continuous/ordinal and dichotomous independent variables, respectively. In addition, we compared each of the predictor variables between groups using t tests and chi square analyses for continuous and categorical variables, respectively. For t tests, we used the unequal-variance t test when findings of the Levine test were significant. Next, we examined the predictive model separately for each group by using linear regression analyses. The dependent variable, self-rated health, met assumptions of normality, and there was no evidence of collinearity among the predictor variables. Finally, using the methods of Clogg and colleagues (Reference Clogg, Petkova and Haritou1995), we assessed whether there were any significant differences between groups in the regression correlation coefficients of the predictor variables. (Note: the regression correlation coefficient represents the mean change in the dependent variable given a one unit change in the predictor variable.)
Results
No significant differences were observed in self-rated health ratings between the OAS group and the CC group. Self-rated health ratings were as follows: excellent (OAS: 17%; CC: 16%), good (OAS: 48%; CC: 51%), fair (OAS: 27%; CC: 28%), and poor (OAS: 9%; CC: 6%). We compared other physical health items between the two groups and found no significant differences for possible alcohol misuse (OAS: 5%; CC: 10%), number of physical illnesses (Table 1), heart disease (OAS: 23%; CC: 14%), diabetes (OAS: 26%; CC: 19%), hypertension (OAS: 40%; CC: 38%), problems with walking (OAS: 11%; CC: 16%), three or more medical visits to physicians in the previous year (OAS: 60%; CC: 56%), mean number ± standard deviation of nonpsychiatric medications (OAS: 2.2 ± 2.5; CC: 2.2 ± 2.6), and reporting that health never got in the way of doing things (OAS: 56%; CC: 63%). There was a significant difference between groups in ADL scores, although the absolute difference was small (Table 1).
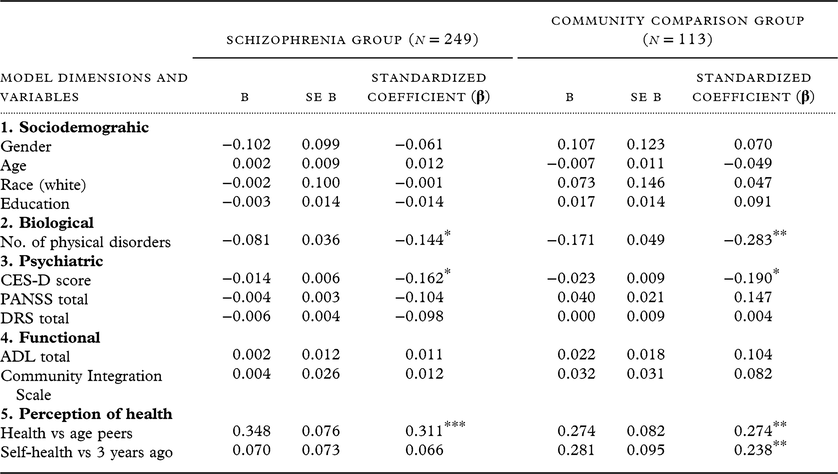
Among the 12 variables in the model, 6 were significantly correlated with self-rated health in both groups: number of physical disorders, ADL score, CES-D score, perception of their health versus age peers, perception of current health versus 3 years ago, and the Community Integration Scale score (Table 1). Education was correlated significantly with self-rated health only in the CC group, and the total PANSS score correlated significantly with self-rated health only in the OAS group. When the predictor variables were entered into separate linear regression analyses for each group, three variables were significantly associated with self-rated health in both groups: CES-D score, number of physical disorders, and perception of health versus age peers. The perception of current health versus 3 years ago was significant in the CC group but not in the OAS group. We found no significant differences between the two groups in the regression coefficients for the four significant variables (z-scores ranged from 0.66 and 1.78). The overall model attained statistical significance in both groups, although R2 was higher in the CC group (0.55) than in the OAS group (0.31) (Table 2); both groups met Cohen’s criterion for a “large” effect size (Cohen, Reference Cohen1976). Although the pattern of correlations between self-rated health and the predictor variable was similar between the groups, the mean values differed between the groups with respect to 8 of the 12 variables in the model: age, education, PANSS total, CES-D, DRS, ADL, Community Integration Scale, and perception of current health versus 3 years ago (Table 1).
Linear regression analysis of predictors of self-rated health using Ocampo’s model

Overall model: Schizophrenia group: R2 = .31; F = 8.02, df = 12, 219; p <.001.
Community comparison group: R2 = .55; F = 9.85; df = 12, 96; p <.001.
B = Unstandardized β; SE = Standard Error; ADL = activities of daily living; PANSS = Positive and Negative Syndrome Scale; CES-D = Center for Epidemiological Studies−Depression; DRS = Dementia Rating Scale.
* p <.05.
** p <.01.
*** p <.001.
In the OAS group, when we substituted PANSS positive or PANSS negative scores for the PANSS total score in the regression analysis, neither was significantly associated with self-rated health. When psychiatric illness awareness (i.e. “Would you say that you have a mental psychiatric or mental problem?”) was entered into the regression analysis, it did not attain significance.
Discussion
Our findings support the use of self-rated health as a legitimate clinical and research measure in OAS. First, we showed that the utility of self-rated health assessment was not affected by an association with serious psychiatric symptoms such as positive or negative symptoms or lack of mental illness awareness; none of these variables were significantly correlated with self-rated health.
Second, we found that Ocampo’s model for self-rated health in older persons in general was significant for the OAS group and that three variables attained independent significance, viz, depression (CES-D scores), number of physical disorders, and perception of how health compared with one’s age peers. Of note, several variables identified previously in the aging literature as associated with self-rated health were significant in bivariate analysis in the OAS group (Table 1), but they did not retain significance in the regression analysis (Table 2). With respect to the significant variables in the regression analyses, our finding that the number of physical disorders was associated with self-rated health was consistent with the literature that older people’s perception of their health corresponds fairly well with more objective physical measures and clinician’s judgment of their health (Blazer, Reference Blazer2008; Olawa et al., Reference Olawa, Adebayo, Mokuolu, Umeh and Omolayo2018). On the other hand, depression in older adults has been found to diminish more favorable self-perceptions of health (Han, Reference Han2002; Mulsant et al., Reference Mulsant, Ganguli and Seaberg1997), and our findings confirmed these earlier findings. Lastly, our data supported Ocampo’s model regarding the subjective relativity of self-rated health. That is, perceived health versus age peers (social comparison) and perceived health versus past (temporal comparison) can affect the self-rated health assessment. We found that the former was significant for both the OAS and CC groups, whereas the temporal comparison was significant only for the CC group. In the literature, older adults tend to show a stronger preference for social comparisons than for temporal comparisons (Robinson-Whelen and Kiecolt-Glaser,Reference Robinson-Whelen and Kiecolt-Glaser1997), which is consistent with our findings for both groups (see β values in Table 2); although it was more pronounced in the OAS group.
Third, three of the four variables in the model that attained significance among the OAS group were identical to those in the CC group, and the regression coefficients of the significant variables in each group did not differ significantly between the two groups. Moreover, the nearly identical self-health ratings between the groups did not seem to reflect misperceptions among the OAS but rather similarities in the scores for various health and functional measures.
This study has several strengths. It is the only systematic study of self-rated health in OAS living in the community. We used a large multiracial sample and a CC group, and we employed a theoretical model that allowed for the rational inclusion of predictor variables in the regression analyses and for the determination of the independent effects of each of the these variables. However, our study has several limitations, and consequently, our findings should be considered provisional. First, all functional and physical items were based on self-report rather than clinical examination. Second, our findings demonstrated associations only at one point in time, and longitudinal data will be needed to determine the predictive validity of self-rated health. Third, our study is restricted to one geographical area, and the OAS group is a convenience sample recruited from various outpatient programs and supported residences, thereby excluding persons who were not in treatment or living in institutions. Finally, our use of multiple comparisons in the data analyses increased the possibility of type 1 errors.
In summary, factors affecting self-rated health in OAS were strikingly similar to those affecting self-rated health in their community counterparts. Our findings were consistent with previous studies in the gerontology literature and with Ocampo’s conceptualization (Ocampo, Reference Ocampo2010) that self-rated health is the global result of various influencing factors (biological, psychological, and social elements), as well as subjective percepts regarding the health of their age peers. It is an easily obtainable measure that can be incorporated readily into the clinical assessment of OAS, as well as provide an indicator of well-being in research studies. Future prospective studies must determine whether self-rated health has predictive validity with respect to subsequent mortality, morbidity, and functioning in OAS.
Conflict of interest
None
Funding
The National Institutes of Health (NIGMS SO6GM54650 and SO6GM74923) supported this work.
Description of authors’ roles
Dr. Cohen designed and carried out the original study, analyzed the data, and supervised the writing of the manuscript. Dr. Vengassery conducted the review of literature and assisted with the data analysis and writing of the paper. Dr. Reinhardt assisted with the data analysis and writing of the paper.