1. INTRODUCTION
When Mercator decided to construct a world map ad usum navigantium emendate accomodata, he had to face two different and unrelated technical problems: first, to conceive a map projection in which rhumb lines were represented as straight segments making with the meridians the same angle as in the spherical surface of the Earth; and second to depict the places of the world according to their latitudes and longitudes. We know how successful he was in solving the first problem: using a table of rhumbs and forcing the corresponding lines to be represented by straight segments, he was able to construct a graticule very close to the exact solution, to which he obviously had no access. The process has been already explained in two previous articles and will not be discussed here (Gaspar and Leitão, Reference Gaspar and Leitão2013; Leitão and Gaspar, Reference Leitão and Gaspar2014).Footnote 1
Concerning the second problem – to depict places according to their geographical coordinates – the title of the world map sheds some light on Mercator's approach: Nova et aucta orbis terrae descriptio ad usum navigantium emendate accomodata, that is, ‘New and enlarged description of the Earth properly adjusted for the use of navigation’. The key expression is emendate accommodate, which means ‘properly adjusted, or accommodated’. What Mercator meant with this wording is that his novel description of the world was not created from the void but compiled and adapted from the information available in the form of maps, charts and travellers’ reports. How he did it and how successful he was are the topics that will be dealt with in the present article. Owing to the well-known difficulties in determining longitudes during the sixteenth century, as well as to the complex geometry of contemporary nautical charts, the problem was not easy to solve. On the one hand, the accuracy of the coordinates that could be retrieved from the existing world and terrestrial maps was not good enough for navigational purposes; on the other hand, nautical charts were drawn on the basis of latitudes, magnetic courses and estimated distances, and converting this kind of information into a list of latitudes and longitudes was a nearly impossible task at the time.
In this article an assessment of the navigational accuracy of Mercator's world map is presented and discussed, in the light of the navigational and cartographic methods of the Renaissance. The text is organised as follows: in Section 2 (The latitude chart of the Renaissance) a brief overview is given of the geometry of the nautical charts used at Mercator's time, from which part of the information used in his world map may have been compiled (Section 3). In Section 4 (How accurate is the world map of Mercator?) an assessment of the planimetric accuracy of Mercator's world map is presented and discussed, taking into account its likely cartographic sources; in Section 5 (Final remarks: was the Mercator world map really adapted to navigation?), the possible use of Mercator's world map, at the time it was proposed, is discussed in the light of contemporary navigational methods.
2. THE LATITUDE CHART OF THE RENAISSANCE
At the time Gerard Mercator presented his novel world map, nautical charts used by pilots at sea were constructed on the basis of observed latitudes, magnetic courses and estimated distances between places. The information collected at sea and on land was transferred directly to the plane of the chart on a constant scale, with no concern for the curvature of the Earth's surface. Not because cartographers and pilots were ignorant about the shape of our planet, but owing to the limitations imposed by the contemporary navigational methods – most particularly the impossibility of determining longitude at sea. The price paid for such simplification was geometric inconsistency, in the sense that the position of the places on each chart was strictly dependant on the particular set of routes used in its construction. While this problem could be ignored when representing relatively small regions like the Mediterranean, that was not the case of large oceanic areas like the Atlantic or Indian Oceans, where only the routes used to construct the charts were correctly represented, and the directions and distances between any other places were often subject to considerable errors. Although pilots and cartographers were aware of the problem and frequently complained about the inadequacy of the charts, they continued to use them as if the north-south direction were always aligned with the vertical lines on the charts – which was not usually the case – and rhumb lines between places were represented by straight segments correctly oriented relative to the meridians.Footnote 2
A critical point to recall for a correct understanding of the technical problems faced by Mercator, when retrieving the coordinates of the places from the extant cartography, is that the charts of the Renaissance were not based on the longitudes of the places, which could not be determined at the time with the required accuracy. As a matter of fact, east-west distances measured on the charts did not usually reflect either accurate distances or accurate differences of longitude, and the apparent distortions varied from place to place and from chart to chart. Moreover all nautical charts of the sixteenth century and beyond were hybrid representations where two distinct cartographic models coexisted: the latitude chart, which was constructed on the basis of latitudes and magnetic courses, and was used to represent most of the Atlantic and Indian Oceans; and the portolan chart, based on magnetic courses and estimated distances, used to represent the Mediterranean and the Black Sea (up to c.1600), the Caribbean Sea (up to c.1525) and, in some cases, Newfoundland.
Despite the fact that the methods used to construct the charts were common knowledge among seamen, Renaissance cosmographers and pilots wrongly assumed that a square grid of meridians and parallels was somehow implicit to their geometry. This assumption, shared by Gerard Mercator and other cosmographers, led directly to the conclusion that approximate values of latitude and longitude could be read directly from the charts, which was obviously false.Footnote 3
Figure 1 depicts an anonymous Portuguese chart of the Atlantic Ocean (1550), now kept in the Bibliothèque nationale de France. Its most interesting feature is the depiction of a secondary latitude scale to the east of Newfoundland (near the top margin), only applicable to that area. The presence of this auxiliary scale indicates that the region was located on the chart, unlike the other regions, on the basis of a magnetic course and a distance measured from some origin (probably the Azores). This ad-hoc expedient, shared with some other charts of the sixteenth century, aimed at preserving the three elements of navigational information in the same chart – the latitudes in Newfoundland (as measured in the secondary latitude scale), as well as the magnetic course and distance of the region, measured from the Azores. Owing to the effect of magnetic declination on the direction of the course connecting the two regions, these three elements of information would be mutually incompatible if the main latitude scale were used.
Anonymous Portuguese chart of the Atlantic Ocean, 1550. The grid of meridians and parallels was estimated on the basis of a sample of control points of known geographical coordinates (red circles). Notice how parallels are everywhere approximately horizontal and equally-spaced, except in the north-western Atlantic, owing to the northward displacement of Newfoundland. Bibliothèque nationale de France, Ge B 1148 Rés.

Figure 1 also shows the grid of meridians and parallels implicit to the representation, which was determined using a sample of places of known geographical coordinates. Notice how parallels are everywhere approximately east-west oriented and equally-spaced – an indication that the latitudes of the places were used to construct the chart – except in the northwest Atlantic, owing to the northward displacement of Newfoundland. Also notice how the spacing between adjacent meridians decreases with latitude, as in the spherical surface of the Earth. This feature contradicts the assumption that meridians and parallels form a regular square grid on the charts, and is a sign that linear scale applies to the whole charted area.
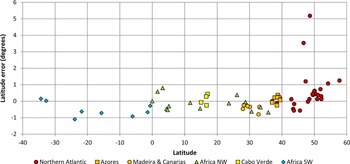
Suppose that one wants to retrieve from this chart the latitudes and longitudes of a number of places, in order to use them in the construction of a Mercator chart. Assuming, for now, that all regions have been depicted according to their latitudes, all one would need to do to determine their values would be to use the latitude scale (which is composed of two separate segments, running northward and southward from the equator). That was done for the control points shown in Figure 1 as small circles, and the retrieved latitude values where then compared with the exact ones, in order to assess their accuracy. The distribution of the corresponding errors with latitude is illustrated in Figure 2. Notice how almost all error values are less than 1°, except in the north-western Atlantic (Newfoundland), where they reach more than 5°. However, if the secondary scale were used to assess the latitudes in this region, the corresponding errors would also be small. This confirms the conclusion, already drawn by visual inspection of the geographical grid, that astronomically-observed latitudes were incorporated into this chart.
Distribution of the latitude errors with latitude in the anonymous Portuguese chart shown in Figure 1 (1550). Notice that nearly all values are less than 1°, except near Newfoundland, where they reach more than 5°. If the latitude values in Newfoundland were read in the secondary latitude scale, the corresponding errors would also be less than 1°, which confirms that this scale was intended to be applied to the region.

A possible way to retrieve the longitude values would be to first overlap a square grid on the chart, graduated in equatorial degrees, and then use this grid to read the longitude values relative to some arbitrary origin. By doing so one would be assuming that the chart was constructed according to the principles of the cylindrical equidistant projection centred on the Equator, the so-called square chart or plate carrée. However such an exercise would be superfluous given the fact that the grid implicit to this representation is obviously not square (see Figure 1): not only does the spacing between adjacent meridians decrease with latitude but also varies with longitude. For example, the spacing between meridians along the parallel of 30° N increases markedly from east to west.
This assessment of a sixteenth century chart served to illustrate the kind of technical problems that Mercator had to face in order to retrieve geographical information from the contemporary nautical charts. Which approach did he choose to overcome the difficulties – assuming that he was aware of them – and how well he did the job: those are the questions to be addressed next.
3. MERCATOR'S CARTOGRAPHIC SOURCES
At the time Mercator was preparing his world map of 1569, European explorers had reached most parts of Africa, Asia and the Americas. These regions were already depicted in numerous Portuguese and Spanish nautical planispheres, as well as in printed world maps of Italian and Dutch origin, such as the Typus Orbis Terrarum of Abraham Ortelius, engraved and published in 1564. However nothing is known about the specific cartographic sources used by the cosmographer to compile the information, aside from his own words in a Latin legend of the map (Mercator, Reference Mercator1932, 7–45):
The second object at which we aimed was to represent the positions and the dimensions of the lands, as well as the distances of places, as much in conformity with very truth as it is possible so to do. To this we have given the greatest care, first by comparing the charts of the Castilians and of the Portuguese with each other, then by comparing them with the greater number of records of voyages both printed and in manuscript. It is from an equitable conciliation of all these documents that the dimensions and situations of the land are given here as exactly as possible, account being taken of all observations made till now which have come into our hands.
Which Castilian and Portuguese charts those were is uncertain. Considering the fact that virtually all Iberian nautical cartography of the time was manuscript, having access to up-to-date charts was certainly not easy for someone who did not live near a sea port and was not directly involved in chart making or navigation. A survey of place names in the map reveals the use of, at least, five different languages, sometimes in the same region: Latin, to name some important places (e.g. the Cape of Good Hope) and most inland locations; Italian, used in most parts of the Mediterranean and also in the Atlantic Islands; Spanish, prevailing in Africa, South America, Central America and North America; Portuguese, used mainly in the coast of Brazil; and French, used in the northern part of North America (which was colonised by the French in the sixteenth century). Surprisingly, in most of the areas surveyed by the Portuguese during the sixteenth century, such as the western and eastern coasts of Africa, place names are often written in Spanish. This suggests that no manuscript Portuguese charts of the region were available to Mercator and that he may have collected the information from printed maps. Although no direct connection can be established between the sources used by Mercator and those mentioned by Ortelius in his 1570 atlas, Theatrum Orbis Terrarum, the fact that no manuscript chart is listed in the atlas's Catalogus Auctorum is a confirmation that such charts were not easily available.Footnote 4 In this respect it is significant that the only work of the prolific Portuguese cartographer Diogo Homem mentioned by Ortelius is a printed chart of Europe and the Mediterranean engraved in Venice, in 1569.
In general, the difficulty of access to up-to-date information resulted in poor representations of some areas, which were either based on inadequate sources or in pure conjecture. Significant examples are the Pacific Ocean coasts of North and South America, with their westward bulges.
4. HOW ACCURATE IS MERCATOR'S WORLD MAP?
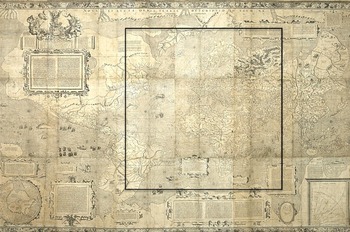
Mercator's world map is composed of eighteen printed sheets that measure, when assembled, 203 × 125 cm (Figure 3). At the time it was engraved most parts of the world had already been visited by European pilots and were more or less properly depicted in the contemporary cartography. Notable exceptions are Australia, Antarctica and the Arctic Sea, which were not represented at all, or whose representations were conjectural. Moreover, the shape of the continents, especially the Americas, was still affected by poor or non-existent geographical knowledge. Contrarily to most nautical charts and planispheres produced by Portuguese and Spanish cartographers, who used to leave blank the non-surveyed parts, Mercator used his imagination – or the imagination of his sources – to fill those blanks. That is the case of the western coast of South America, the western coast of North America to the north of California and of the Arctic and Antarctic land masses, which are entirely conjectural.
Mercator's world map of 1569. Notice the absence of Australia, and the incorrect depiction of Antarctica, Arctic Sea and the eastern coasts of North and South America. Cartometric analysis of the map was only done inside the framed area. Bibliothèque nationale de France, département Cartes et plans, GE A-1064 (RES).

None of the areas whose representations were affected by poor geographical knowledge were considered in the present study. That is because I was mostly interested in the errors associated with the process used by Mercator to transfer the geographical information from the charts to the new world map, not in its overall accuracy. The area that was subjected to cartometric analysis is framed in Figure 3 with a rectangle. Two complementary processes were used. First, the geographical grid of meridians and parallels implicit to the representation was determined. The visual inspection of this grid has permitted a first qualitative assessment of the accuracy of the chart in the various regions. Then the accuracy of the latitudes and longitudes in two chosen areas was determined directly by comparing the values read directly on the scales of the chart with the correct ones.
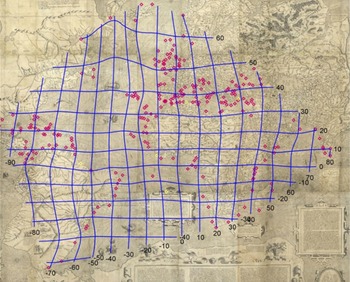
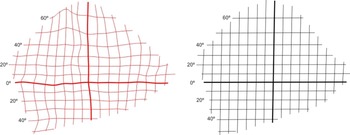
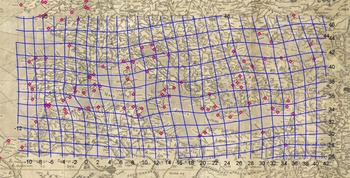
Figure 4 shows the grid of meridians and parallels that was interpolated from the map, using a sample of control points of known geographical coordinates. If the Mercator map was 100% accurate then this grid would be coincident with its own graticule of meridians and parallels, which is not the case. When we put the interpolated grid side by side with the graticule of the map (Figure 5), several errors can be spotted by visual inspection: the convergence of meridians, especially in the northern hemisphere, which is not supposed to occur in a Mercator projection; errors in the latitudes, especially in the northern Atlantic and Mediterranean; errors in the longitudes, apparent in the irregular spacing of meridians; and various other distortions in South America, the northern Atlantic and the eastern coast of Africa. We will ignore the errors of latitude in the northern Atlantic, as well as the longitude errors in South America, which are likely caused by lack of good geographical information, and focus on those affecting the representation of three regions: the Mediterranean, where the parallels appear rotated anticlockwise; the eastern coast of Africa, where the meridians are distorted; and a latitudinal belt between the western coast of Africa and the Caribbean, where the spacing between meridians increases from east to west.
Grid of meridians and parallels implicit in Mercator's world map of 1569, determined on the basis of a sample of control points with known coordinates (circles). Notice the convergence of meridians in the northern Atlantic and the distortion of meridians and parallels in South America, the northern Atlantic and the Mediterranean. Bibliothèque nationale de France, département Cartes et plans, GE A-1064 (RES).

Grid of meridians and parallels implicit in Mercator's world map of 1569 (left) compared with the geographic grid of the same map (right). The bold lines represent the Equator and the meridian of 10° W, passing west of Lisbon. Notice the large latitude errors in the north-western region and the convergence of meridians in the northern hemisphere.

Figure 6 represents the interpolated grid of meridians and parallels for the Mediterranean and Black Sea, overlaid on Mercator's representation. Once again, this grid does not reflect an accurate Mercator projection. While the distances between adjacent parallels slightly grow with latitude, as expected, these same parallels are not straight and east-west oriented, and there is a scale exaggeration in the eastern part of the region. In order to better understand these qualitative results, we will go deeper into the analysis, by determining the latitude and the longitude errors of the same points.
Grid of meridians and parallels implicit in Mercator's world map of 1569 for the Mediterranean and Black Sea. Notice the tilt of both meridians and parallels in the eastern part of the representation and the scale exaggeration in the Black Sea, reflected on the larger size of the quadrilaterals. Bibliothèque nationale de France, département Cartes et plans, GE A-1064 (RES).

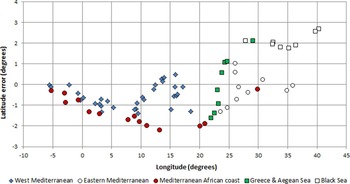
Figure 7 illustrates the variation of the latitude errors along the Mediterranean basin and Black Sea, from west (left) to east (right). Notice how the values vary from about −2° to +1°, except in the Black Sea (the white squares at right), where they are larger. Also notice how the counter-clockwise tilt of the Mediterranean, which is a typical feature of all earlier charts and world maps, was partially corrected. When we compare this error distribution with the corresponding one in the anonymous Castiglione planisphere of 1525 (attributed to the cartographer Diogo Ribeiro), the earliest known source in which the tilt of the Mediterranean was corrected, the similarity is obvious. Although the latitudinal accuracy in Mercator's chart is better, especially for the Black Sea, the differences are small. Notice how the error values concentrate in more or less well-defined clusters, which is a sign that different sources of information were used to map the region.
Variation of the latitude errors with longitude for the Mediterranean and Black Sea, in Mercator's world map of 1569. The values vary between −2° to 1°, except in the Black Sea, where they reach almost 3°. Notice how the error values concentrate in clusters, not necessarily coincident with the data classes of the graph, revealing that different sources were used to represent the region.

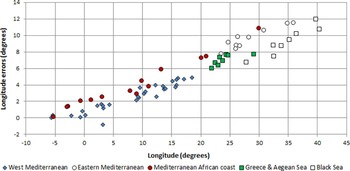
Much more revealing is the variation of longitude errors along the Mediterranean basin (Figure 8). Notice how they steadily increase from the Strait of Gibraltar, where the longitude error was set to zero, to about 12°, in the Black Sea. This regular trend means that the representation of the whole region was stretched in the east-west direction by about 25% relative to the correct scale, which is not supposed to occur in a Mercator projection. As shown in a previous work, this is the result of an adjustment applied to nautical planispheres in the second half of the sixteenth century, with the purpose of cosmetically correcting the exaggerated size of the Isthmus of Suez. Apparently Mercator did no better than reproducing such a feature, unaware of its purpose and implications (Gaspar, Reference Gaspar2013, 66–67).Footnote 5
Variation of the longitude errors with longitude in the Mediterranean and Black Sea, in Mercator's world map of 1569. Notice how the values steadily increase from zero, at the Strait of Gibraltar (left) to about 12°, in the eastern Mediterranean and Black Sea. This is the result of a longitudinal stretching of the region, a common feature of the nautical cartography of the sixteenth century.

So far these results should not come as a surprise because Mercator clearly stated in one of the Latin legends of the map that “on the navigators’ charts the degrees of longitude, as the various parallels are crossed successively towards the pole, become gradually larger with reference to their length on the sphere, for they are throughout equal to the degrees on the equator, whereas the degrees of latitude do not increase at all” (Mercator, Reference Mercator1932). This text unambiguously demonstrates that Mercator shared with his contemporaries the false idea that, at least in some approximate way, the meridians and parallels that were implicit on the charts formed a square grid. This misconception is unexpected, given the fact that Mercator was an attentive reader of the mathematician Pedro Nunes, who had already demonstrated otherwise in his treatises of 1537 and 1566.Footnote 6
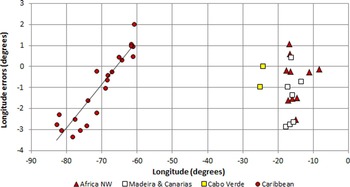
Figure 9 illustrates the longitudinal distribution of longitude errors across the Atlantic in Mercator's world map, inside a latitudinal belt between about 10° N and 25° N. This belt includes part of the western coast of Africa, the archipelagos of Madeira, Canaries and Cape Verde, and part of the Caribbean Sea. Two clusters of data are apparent in the figure: one containing the longitude errors near the eastern margin of the Atlantic (right); and the other the errors in the Caribbean and the north coast of South America (left). Although the dispersions of the errors in both clusters are similar, their distributions with longitude are very different. In the eastern group the values vary from about −3° to 1°, but no correlation with longitude is apparent; in the western group, they vary between about −3·3° and 2° and there is a strong correlation with longitude. This is the effect of a scale exaggeration of about 20% affecting the whole area, a reminiscence of the very first depictions of the region, in the planispheres of Juan de la Cosa (1500) and Cantino (1502). While the latitude errors in the Caribbean Sea were corrected in the Spanish and Portuguese nautical charts from about 1525 on, that was not always the case for the longitude errors, which remained for a long time in most non-Spanish depictions of the region.Footnote 7 Thus the persistence of such errors in Mercator's world map suggests that the representation of the Caribbean Sea was copied either from a more primitive depiction of the region or from a non-Spanish source, which supports the previous conclusion that few up-to-date nautical charts were probably available to him.
Mercator's word map of 1569: distribution of longitude errors across the Atlantic, in the latitudinal belt between about 10° N and 25° N. The longitudes are counted from the meridian of Lisbon. Notice how the errors in the Caribbean Sea (cluster on the left) vary with longitude, which is the effect of a scale exaggeration of about 20% in the representation of the region.

A question one may finally ask is whether Mercator could have done better with the available information, assuming that he was aware of its distortions. The answer is a clear no, given the fact that he had no way of correcting the coordinates collected from the sources. In order to make those corrections he would need to know, assuming (falsely) that latitudes were free of error, how exactly the position of each place was plotted on a chart – either with latitude and a course, or a course and a distance – and how magnetic declination affected those courses. Considering that longitudes could not be determined accurately at the time, calculating their values indirectly from the charts would be an impossible task: not only was the spatial distribution of magnetic declination unknown (necessary to correct courses) but also the particular set of routes used to construct each nautical chart was not documented by the cartographers. This difficulty is one of the main reasons why the old latitude chart took so long to be definitively replaced by the Mercator projection. Rather than using the information available in the traditional cartography, new and extensive surveys were needed to accurately determine the coordinates of the places, which only became feasible after the longitude problem was solved. This means that the proposal of a new projection by Mercator, while responding to the needs of navigation in theoretical terms, was much ahead of its time owing to the limitations imposed by the navigational methods.
5. FINAL REMARKS: WAS THE MERCATOR MAP TRULY ADAPTED TO NAVIGATION?
An assessment of the planimetric accuracy of Mercator's world map of 1569 was presented, with the purpose of better understanding how its geographic information was adapted from contemporary cartography. The results suggest that the coordinates of the places were imported directly from the available sources without corrections, and that Mercator was not fully aware of the complexity of nautical cartography of the time, which was based on latitudes, magnetic courses and estimated distances.
Was Mercator's world map of 1569 truly adapted to navigation at the time it was constructed, as suggested by its title? It has been shown in this article that, as a matter of fact, it was not. In order to understand why, we should recall that a nautical chart is not, and does not intend to be, a faithful description of the Earth. Arthur Robinson wrote, in his well-known ‘Elements of Cartography’, that while “maps are to be looked at, charts are to be worked on” (Robinson et al., Reference Robinson, Morrison, Muehrcke, Kimerling and Guptill1995, 15). In that sense a nautical chart should be regarded as a diagram, or a paper nomogram, conceived in such a way as to support the practice of navigation and facilitate graphical calculations, with little concern for the way land masses are represented. In order to be effective, the geometry of such a diagram should be strictly compatible with the navigational methods it is supposed to serve. That was the case of all pre-Mercator nautical charts, which were constructed on the basis of magnetic courses, estimated distances and, from about 1500 on, the latitudes of the places. This is a different paradigm from the one adopted by Mercator in his world map, which was constructed on the basis of the latitudes, longitudes and true geographic directions. The critical point to note is that the two cartographic models – the pre-Mercator chart and the Mercator projection – are different and hardly compatible with each other in so far as the practice of navigation is concerned. Even if the latitudes and longitudes in Mercator's world map were accurate (which is not the case), it could not have been used to support navigation at the time it was proposed. The reason is that courses were measured relative to the magnetic north, not to the geographical north. In order to convert compass courses into geographic courses and vice versa one would need to know the value of magnetic declination in the area of interest.
Suppose that this difficulty was solved by carrying out a systematic survey of the magnetic declination in the Atlantic. Assuming that the charts were free of any other errors, would this improvement allow the pilots to effectively use the Mercator projection? Yes, on the condition that all magnetic courses measured with the marine compass were corrected before being transferred to the chart and that the geographic courses retrieved from the chart were converted to magnetic courses before being used to steer the ship. However this hypothetical situation could not be met at the time Mercator proposed his projection: no accurate Mercator chart existed and none could be constructed because the longitudes of the places were not known with the necessary accuracy.
In this light the long delay between Mercator's proposal of a new projection, in 1569, and its full adoption in navigation, from the second half of the eighteenth century on, is easily explained: not because of the pilot's stubbornness or conservatism but owing to difficult technical reasons, which were unsolvable at the time. Stated in bold terms, Mercator's world map of 1569 was useless for navigation at the time it was created because navigation was something different from his idealised concept.
ACKNOWLEDGMENT
This research was made possible by the fellowship awarded by the Fundação para a Ciência e Tecnologia (SFRH/BPD/69715/2010).