Introduction
Fields exhibit spatial heterogeneity for several soil characteristics that influence soil water content (SWC), such as soil type and topography (Groeteke et al., Reference Groeteke, Dotterer and Shanahan2014). Common agricultural practice is to adjust the irrigation rate for the driest region of the field, to ensure that no part of the field is under-irrigated (Peters et al., Reference Peters, Desta and Nelson2013). This practice results in suboptimal utilization of water in many other parts of the field. Available water-holding capacity (AWC) of soil is the maximum amount of water accessible to crops in the root zone (Schmitz and Sourell, Reference Schmitz and Sourell2000). Hence, a precise delineation of sub-field areas possessing homogeneous characteristics such as delineating site-specific management zones (SSMZ) (Fleming et al., Reference Fleming, Westfall, Wiens, Rothe, Cipra and Heermann1999; Khosla et al., Reference Khosla, Fleming, Delgado, Shaver and Westfall2002) is key to precise irrigation management (Hedley et al., Reference Hedley, Yule, Tuohy and Vogeler2009). For the purpose of precision irrigation, delineating SSMZ relies on soil hydraulic properties, which define the optimal soil water parameters for each zone (Hedley et al., Reference Hedley, Yule, Tuohy and Vogeler2009). Variable Rate Irrigation (VRI) systems have made it technologically feasible to vary the amount of water applied across a field (Groeteke et al., Reference Groeteke, Dotterer and Shanahan2014).
Currently, variable rate irrigation strategies are extensively based on measuring apparent soil electrical conductivity ECa (Hedley and Yule, Reference Hedley and Yule2009; LaRue, Reference LaRue2011; Martin et al., Reference Martin, Smith, Kranz, Irmak, van Donk and Shanahan2014). However, the soil properties that most influence ECa vary depending on the particular field being studied (Corwin and Lesch, Reference Corwin and Lesch2003). Furthermore, research has shown that a single study area can include different soil ECa controlling factors (Paine et al., Reference Paine, Goldsmith and Scanlon1998). To characterize SWC, commercial agricultural retailers in the USA are solely employing soil ECa measurements without accounting for possible influence of other soil properties. An accurate characterization of spatial variability in SWC is pivotal for management of water using precision irrigation systems. In addition, potential interactions with other variables should not be ignored. The objectives of this study were (1) to assess how consistently soil ECa derived management zones characterize SWC and (2) to determine whether apparent soil electrical conductivity coupled with additional soil properties could further improve the characterization of SWC.
Materials and methods
Study sites
This study was conducted during 2012 on a 4.8 ha field located at the Agricultural Research Development & Education Center (ARDEC), Fort Collins, CO, United States (40°39'57.4'' N, 104°59'53.1'' W). This site corresponds to the south portion of a field under pivot irrigation system. The soil type is a Kim loam, classified as fine-loamy, mixed, active, mesic Ustic Torriorthents (Soil Survey Staff, 2000). Based on corresponding soil samples, the texture was classified as sandy clay loam. The slope of the field is 0.9% in a single plane gradient. The field was under conventional tillage continuous maize (Zea mays L.) cropping system for the past 10 years.
Soil water content data collection
Soil water content data were collected utilizing a neutron probe (Model 503 DR Hydroprobe, CPN International, Martinez, CA). A total of 41 neutron probe (NP) access tubes were installed. Every access tube was geo-located using a differentially-corrected TrimbleTM Ag 114 global positioning system unit (DGPS). Soil water data were collected at five soil depths (15, 45, 75, 105, and 135 cm). Data were acquired 13 times during the growing season, on a weekly basis, from June 1 to September 24, 2012.
Soil sampling and analysis
Soil samples were taken to a depth of 60 cm and collected at 84 locations (not co-located with NP access tubes) on April 8, 2012. Agvise laboratories (Benson, NE) performed routine soil tests and texture (clay, silt and sand) analysis. Soil tests included organic matter (%), soluble salts (dS m−1) and CEC (meq 100 g−1). Minimum, mean and maximum values of chemical and physical properties analyzed are shown in Table 1.
Soil samples collected at 0–60 cm soil depth with the minimum (min.), mean and maximum (max.) values for Sand, Silt, Clay, Organic matter, Soluble salts, Calcium, Magnesium and Cation Exchange Capacity

Soil apparent electrical conductivity data collection
Sensor EM38MK2 (Geonics Limited., Mississauga, ON, Canada) was combined with a DGPS and data loggers mounted on an all-terrain vehicle were used to acquire high-resolution soil ECa readings when the soil was at field capacity. For maneuverability, the vehicle traveled in the direction of crop rows in a series of parallel transects spaced at 8 to 12 m intervals. The total number of observations was slightly below 2900, approximately one observation at every two meters. The EM38 was in vertical mode and collected datasets at two depths. The depths corresponded to a “deep” reading (i.e. 0–150 cm), and a “shallow” reading (i.e. 0–75 cm).
Statistical Analysis (ECa classification)
Management Zone Analyst (MZA) software (University of Missouri-Columbia) was used to determine the optimum number of zones (Fridgen et al., Reference Fridgen, Kitchen, Sudduth, Drummond, Wiebold and Fraisse2004). In addition to the suggested optimal number of zones determined by MZA, three zone maps were calculated for every soil ECa reading for comparison with the approach practiced by the commercial agricultural retailers.
ECa to assess SWC
The soil ECa zones derived from the deep ECa reading (0–1.5 m) were evaluated with the average SWC for the soil depth down to 1.35 m, and the ECa zones derived from the shallow ECa reading (0–0.75 m) were evaluated with the average SWC for the soil depth down to 0.75 m. Linear mixed models (LMM) were used to explain the relationship between SWC values and ECa derived management zones. The temporal SWC variations throughout the season were considered in the LMM as “random effects”, that is to say, different model intercepts between each NP and SWC. The function “lmer” from the “lme4” package (Bates et al., Reference Bates, Maechler, Bolker and Walker2015) of the R statistical software (R Core Team, 2016) was used to create the LMM. Separation of the mean SWC among the ECa zones was performed using least squares means with the function “lsmeans” from the “lsmeans” package (Russell V, Reference Russell2016). In order to detect statistical differences in SWC and ECa derived zones, least-squares means of SWC across each ECa management zones maps were calculated (p value<0.05).
Soil ECa coupled with soil properties
To evaluate any increase in the SWC estimation accuracy, interpolated (ordinary kriging) ECa values (before classification) were combined with organic matter, soluble salts, cation exchange capacity and clay content as SWC predictors. Analysis included only the ECa values from the derived ECa zones depths that significantly explained SWC in the previous analysis. The “dredge” function, from the “MuMIn” package for R statistical software (Barton, Reference Barton2016), was used to test addition of soil properties as explanatory variables to the interpolated ECa values. The ratio of the sample size to the number of predictors was less than 40. Hence, the corrected version of the Akaike Information Criteria (AICc) guided (Burnham and Anderson, Reference Burnham and Anderson2003) the automatic ranking of the models by the SWC explanatory power. ANOVA was used to determine significant differences between the first and second model with the function “anova” from the package “stats” (R Core Team, 2016).
Results and discussion
ECa derived management zone maps
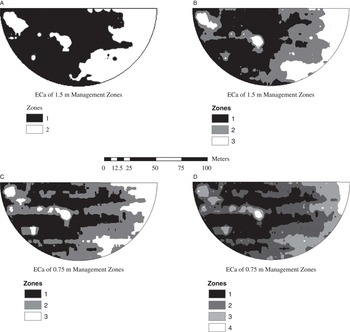
At the neutron probe access tube locations across the field, the mean value of deep ECa was 71 mS m−1, and it ranged from 64 to 81 mS m−1. The mean value of shallow ECa was 20.49 mS m−1, and it ranged from 16 to 30 mS m−1. According to the MZA software, the optimal number of zones were two and four at ECa measurement depths of 1.5 m and 0.75 m, respectively. As previously mentioned, to compare with the approach practiced by commercial retailers, three zones were also calculated for each soil ECa depth (Figure 1).
ARDEC management zones derived by ECa measurements at 1.5 m soil depth presented in sub-figure A and B and zones derived by ECa measurements at 0.75 m soil depth in sub-figure C and D.

ECa derived management zones to assess SWC
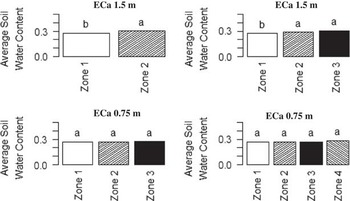
Across all dates and depths of soil moisture measurements, the volumetric SWC ranged from 0.09 to 0.45 m3 m−3. Only the deep ECa-zones demonstrated differences in SWC (p value<0.05), and the two-zone map performed better than three-zone map, as recommended by MZA (Figure 2).
Mean SWC across ECa derive management zones for ARDEC. Different letters are significantly different (p value<0.05).

The results of this study showed that with an inappropriate number of zones, there could be a confounded characterization of the spatial variability of SWC due to the creation of an unneeded management zone, or the lack of creation of a needed zone. Forcing the classification from two to three zones seemed to create a transitional zone that overlapped values from other zones, thus not representing a logical soil water management zone. This means that values of the neutron probes within the transitional zone were similar to another zone and an equivalent water management for both would be more logical. MZA software appears to be a useful tool to determine the number of zones to be delineated for precision irrigation purposes. Hezarjaribi and Sourell (Reference Hezarjaribi and Sourell2007) used a similar software to successfully determine accurate number of ECa zones to characterize SWC.
The lowest quantity of zones from the shallow ECa readings showed higher fuzziness index values. This suggests that shallow sensing seemed to have a higher noise (i.e. soil properties affecting ECa other than SWC) to signal ratio compared to the deeper configuration. Even though Hezarjaribi and Sourell (Reference Hezarjaribi and Sourell2007) also reported a higher sensitivity of the shallow ECa measurements to near-surface material, the depth that best fitted their field was also the shallow ECa reading. In sum, results from this study suggest that the ECa relationship with SWC depends on the horizontal nature of the field characteristics, and on its variability in soil depth as well, suggesting that zones should reflect depths where bulk of the roots are located. Hence, zones may change along the season.
Previous studies showed significant correlation between SWC and soil ECa, and the estimation of AWC using regression models (Hedley and Yule, Reference Hedley and Yule2009; Hezarjaribi and Sourell, Reference Hezarjaribi and Sourell2007). Likewise, Sheets and Hendrickx (Reference Sheets and Hendrickx1995) demonstrated the feasibility of the soil ECa simple linear models to assess SWC over time. Results from this study suggested that the soil ECa measurements could provide useful information to characterize in-field SWC variability, consistently throughout the season. Nonetheless, management zone delineation should be supervised when using soil ECa, i.e. one zone delineation procedure may not be suitable for all fields.
ECa coupled with other soil properties to enhance the delineation of SWC management zones
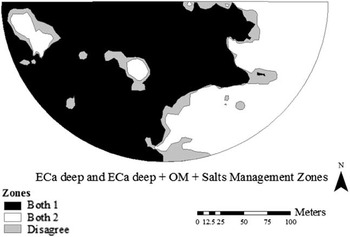
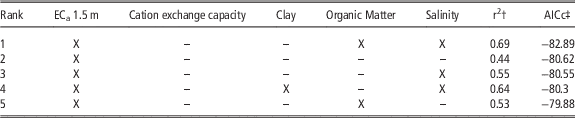
The deep soil ECa map of two zones was the best to explain the differences in SWC across NP locations. Therefore, the “full model” consisted of the interpolated soil ECa values of 1.5 m depth combined with the soil properties as predictors in the automated model selection. Results of the automated model selection are shown in Table 2. By combining soil properties with the base model, SWC assessment was improved (ANOVA test, p value<0.05). The best model (lowest AICc value), included organic matter and salt content. The second best was the simplest model (base model), which utilized only the interpolated soil ECa values of 1.5 m depth as the predictor of the SWC. Management zone boundaries using only ECa or using ECa plus organic matter and salinity are juxtaposed in Figure 3.
Comparison of management zones delineated with using ECa measured up to 1.5 m depth and management zones delineated using ECa measured up to 1.5 m depth in addition to organic matter and soil salinity for ARDEC. Differences are presented in the two techniques are presented as gray color referred to as “disagree” in the legend.

Automated model selection output for the first five models ranked by AICc. Full model consisted of the interpolated ECa values of 1.5 m depth combined with soil properties to explain soil water content. Selected variables for each best model are indicated with an X

† coefficient of determination.
‡ corrected Akaike Information Criterion.
Results from this study suggest that organic matter and salt content should be incorporated, even with low organic matter values (1.6%) and salt concentration (0.59 dS m−1) levels that are below yield-impacting levels as observed in that field. The spatial distribution of the soil properties influencing ECa may be different from SWC’s spatial distribution, making the ECa interpretation more difficult. For example, high pH, salt or sodium levels are commonly heterogeneously distributed across the fields (Waskom et al., Reference Waskom, Bauder, Davis and Cardon2003). In order to provide wider technical recommendations, it may be necessary to do further research on scenarios with different quantities of soil organic matter and soluble salts, as well as scenarios with different soil properties affecting the ECa against SWC relationship. Benefits from improving the SSMZ for the purpose of precision irrigation by incorporating other soil properties have to be compared with the cost of sampling for those soil components. Even though remote sensing has been proven to estimate superficial salinity (Mehrjardi et al., Reference Mehrjardi, Mahmoodi, Taze and Sahebjalal2008; Yong-Ling et al., Reference Yong-Ling, Peng and Zhi-Liang2010) and organic matter content (Bhatti et al., Reference Bhatti, Mulla and Frazier1991), yet they are not quantitatively precise enough (Yong-Ling et al., Reference Yong-Ling, Peng and Zhi-Liang2010).
The results from this study showed that soil ECa derived management zones were associated with macro-scale spatial variations in SWC along the crop season. However, it is worth noting that this was only true for the average SWC values within zones. Longchamps et al. (Reference Longchamps, Khosla, Reich and Gui2015) reported the existence of dynamic water management zones throughout the season, i.e., a continuous variability in the SWC patterns in time. To address this finer scale variability in the SWC, hence achieve better VRI practices, more detailed information about the SWC status would be necessary. De Lara et al. (Reference de Lara, Khosla and Longchamps2016), suggested the use of vegetation indices (i.e. Normalized Difference Vegetation Index, Red Edge Chlorophyll Index and Red Edge Normalized Difference Vegetation Index) for the real-time assessment of the SWC within each soil ECa derived water management zone. Combining the advent of new remote sensing technologies, such as drones and high spatial resolution satellite data, with new precision irrigation technologies (capable of varying irrigation rates at every nozzle), shows promise for the future of variable rate irrigation practices. However, more research combining these different technologies for crop production is needed for an accurate management at the field level.
Conclusion
The soil ECa derived management zones showed to be an effective method to characterize macro-scale in-field SWC variability between zones throughout the crop season. The Management Zones Analyst (MZA) software recommendations were more accurate than the fixed number of three zones typically proposed by commercial retailers. The deep ECa readings (0 to 150 cm) outperformed the shallow ECa readings (0 to 75 cm) in the assessment of SWC. Interpolated soil ECa readings coupled with organic matter and salt content data significantly improved the SWC assessment according to the ANOVA test. The soil ECa zones could potentially be used for precision irrigation which consists in applying specific rates of water based on the requirements of each zone. However, the process of deriving the management zones from the ECa should be determined based on the study of the ECa values distribution and descriptive statistics, which vary along with the variability in soil hydraulic properties existing across farms.
Acknowledgements
This project was partly funded by Colorado State University Agricultural Experiment Station, Colorado Corn Growers Administrative Committee, the 21st Century Equipment Inc., John Deere-Water Inc., the Fluid Fertilization Foundation and the USDA-Natural Resource Conservation Services-Conservation Innovation Grant.