Introduction
In recent years, legislation in the European Union has restricted the number and use of herbicides in cropping systems (Barzman and Dachbrodt-Saaydeh Reference Barzman and Dachbrodt-Saaydeh2011; European Council 1991; European Parliament 2009) as well as tillage frequency (Kutter et al. Reference Kutter, Louwagie, Schuler, Zander, Helming and Hecker2011), thus limiting weed control options for growers. These restrictions have made it more difficult to control troublesome weeds and have led to an increase in the occurrence of lesser-known weeds, such as North African knapweed (Centaurea diluta Aiton) in southern Spain.
Centaurea is a genus in Asteraceae that has a worldwide distribution and comprises a diverse group of about 250 species (Susanna and Garcia-Jacas Reference Susanna, Garcia-Jacas, Kadereit and Jeffrey2007). Some of the species, such as red star-thistle (Centaurea calcitrapa L.) and Iberian knapweed (Centaurea iberica Trevir. ex Spreng.) (Nosratti et al. Reference Nosratti, Abbasi, Bagheri and Bromandan2017) are considered troublesome weeds, while others, including diffuse knapweed (Centaurea diffusa Lam.) and Maltese star-thistle (Centaurea melitensis L.), are of minor agronomic importance. Some Centaurea species have also evolved resistance to several herbicide families, including yellow star-thistle (Centaurea solstitialis L.) to acetolactate synthase inhibitors in the United States, spotted knapweed [Centaurea stoebe subsp. australis (Pančić ex A. Kern.) Greuter] to synthetic auxins in Canada, and garden cornflower (Centaurea cyanus L.) populations to both herbicide families in Poland (Heap Reference Heap2018).
A total of 94 Centaurea species have been described in the Iberian Peninsula (Valdes et al. Reference Valdes, Talavera and Fernandez-Galiano1987), including the increasingly troublesome annual herb, C. diluta. This species is becoming a major agronomic weed, primarily because of its large size and high competitive ability (Saavedra et al. Reference Saavedra, Sánchez-Gamonoso, Carranza, Fuentes and Alcántara2018). In recent years, it has spread into southern Spain and is of increasing concern to farmers in the region (Ortiz et al. Reference Ortiz, Contreras, Ruiz, Sanz, Romero, Gordillo, Taberner and Urbano2015). The first reference to this species as a weed was in the early 1980s, when it was found in wheat (Triticum aestivum L.), sunflower (Helianthus annuus L.), pea (Pisum sativum L.), and beet (Beta vulgaris L.) fields (Castroviejo et al. Reference Castroviejo, Valdés-Bermejo, Rivas-Martínez and Costa1980; Pujadas-Salvá and Hernández-Bermejo Reference Pujadas-Salvá and Hernández-Bermejo1986; Saavedra Reference Saavedra1997). Since then, its impact has increased, largely because its seeds can easily contaminate cereal grains at harvest and can also be mistakenly seeded with cereal grains at planting. These dispersal pathways (Domínguez-Borrero et al. Reference Domínguez-Borrero, García-Regal, González-Andújar and Bastida2015) may explain its irregular distribution in the region (Vázquez Reference Vázquez2008).
Centaurea diluta is an annual dicot native to North Africa and southwestern Europe, including Spain. It is a vigorous plant that can reach up to 350 cm in height and produce a large number of capitula and hairy achenes (3 mm) that can be easily dispersed (Saavedra Reference Saavedra1997; Valdes et al. Reference Valdes, Talavera and Fernandez-Galiano1987). To our knowledge, there are no published data on the number of seeds produced by C. diluta plants or their dormancy status. But stands of similar annual herb congeners such as C. solstitialis can produce nearly 28,000 seeds m−2 (Gutierrez et al. Reference Gutierrez, Pitcairn, Ellis, Carruthers and Ghezelbash2005). Anecdotal reports and studies from similar species suggest that seeds of C. diluta exhibit limited dormancy (Joley et al. Reference Joley, Schoenig, Casanave, Maddox and Mackey1997, Reference Joley, Maddox, Schoenig and Mackey2003)
There is also relatively little published information on methods for controlling C. diluta, except for several technical reports (Saavedra et al. Reference Saavedra, Fuentres, Carranza, Sanchez-Gamonoso and Álcantaea2017, Reference Saavedra, Sánchez-Gamonoso, Carranza, Fuentes and Alcántara2018). The availability of such information is critical for the development of integrated weed management programs for this species. To develop and implement effective management strategies, a better understanding of its seedling emergence pattern and the ability to accurately predict emergence and growth are required.
Seed germination is largely dependent on three key biological parameters related to temperature (Bradford Reference Bradford2002). The first is the base temperature (Tb), which is the minimum temperature for a seed of a given species to germinate such that thermal degrees are not accumulated below this temperature; the second is the ceiling temperature (Tc), which is the maximum temperature for germination, such that no thermal degrees above this temperature are accumulated; and the third is optimum temperature (To), which is the temperature at which seed germination occurs most rapidly. These parameters aid in estimating the thermal time (TT) and the hydrothermal time (HTT) for describing the emergence pattern of weeds. Thermal time models only use soil temperature to describe emergence, while HTT models correct TT accumulating degrees when soil moisture is above a base level (Grundy Reference Grundy2003). In dryland cropping systems, HTT-based models are more precise than TT models, because they also take into account the water content of soils (Royo-Esnal et al. Reference Royo-Esnal, Torra, Conesa and Recasens2012). However, accurately determining soil moisture within a field can be difficult, because many soil properties can vary widely within a single field (Finch-Savage Reference Finch-Savage, Benech-Arnold and Sánchez2004). For this reason, TT-based models with good accuracy may be more practical and useful. The ability to accurately predict the emergence pattern of a target weed or weeds can be valuable to crop managers, because it allows them to implement control tactics when weeds may be most vulnerable (Barros and Freixial Reference Barros and Freixial2010; Kropff and Spitters Reference Kropff and Spitters1991; Zimdahl Reference Zimdahl2007). Increasing the efficacy of a given weed control strategy is likely to also result in improved economic and environmental outcomes, as lower quantities of herbicide or cultivations are needed to achieve the same level of control than later applications or cultivations when plants may be larger and more difficult to control (Shaner and Beckie Reference Shaner and Beckie2014).
Thermal time has been widely used to develop emergence prediction models for a number of weed species. In Spain, the emergence patterns of some of the most problematic weeds in dryland cereals have been modeled and shown to have fair accuracy, including sterile oat (Avena sterilis L.) (Leguizamón et al. Reference Leguizamón, Fernández-Quintanilla, Barroso and González-Andújar2005), rigid ryegrass (Lolium rigidum Gaudin) (Izquierdo et al. Reference Izquierdo, Bastida, Lezaún, Sánchez del Arco and Gonzalez-Andujar2013; Sousa-Ortega et al. Reference Sousa-Ortega, Chamber, Urbano, Izquierdo, Loureiro, Marí, Cordero, Vargas, Saavedra, Lezaun, Paramio, Fernández, Torra and Royo-Esnal2019), ripgut brome (Bromus diandrus Roth) (García et al. Reference García, Recasens, Forcella, Torra and Royo-Esnal2013), corn poppy (Papaver rhoeas L.) (Izquierdo et al. Reference Izquierdo, González-Andújar, Bastida, Lezaún and del Arco2009), and prostrate knotweed (Polygonum aviculare L.) (Royo-Esnal et al. Reference Royo-Esnal, García, Torra, Forcella and Recasens2015).
Certainly, knowledge of the phenological stages of target weeds is essential for implementing appropriate management tactics, particularly during early growth, as it can facilitate determining the critical period of weed control (Knezevic and Datta Reference Knezevic and Datta2015), the most effective method of control (Royo-Esnal et al. Reference Royo-Esnal, Torra, Conesa and Recasens2012), and also potentially provides important information on whether a given species may be adapted to a particular habitat or region (Holt Reference Holt1991).
Until recently, C. diluta was not considered a major agronomic weed in Spain and, as such, no research has been performed to determine or predict its emergence pattern. However, the increasing importance of this weed in southern Spain and the possibility of invasion into northern Spain as climate changes make C. diluta an important weed species to target for further study. Thus, the objective of this research was to develop a model to predict the emergence pattern of C. diluta and describe its early growth stages under Mediterranean semiarid conditions. This research is critical, because the ability of this species to expand its range into new regions will depend largely on the likelihood of its seeds germinating and its seedlings emerging and establishing in these novel environments.
Material and Methods
Plant Material
Seeds of C. diluta were collected from more than 20 individual plants in June 2016 in Los Molares, Sevilla, in southern Spain (37.15°N, 5.72°W) from a commercial wheat field. Seeds were cleaned and dry-stored in a refrigerator at 4 C until needed for field trials in September 2016.
Experimental Design
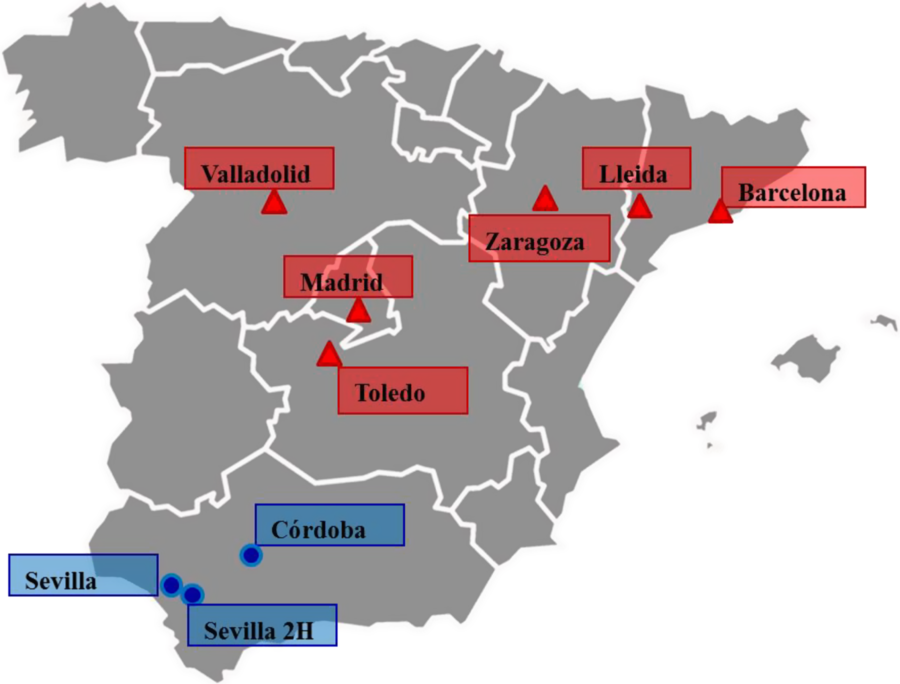
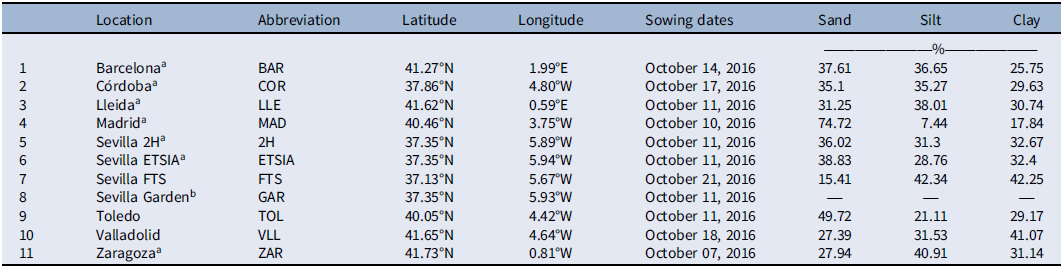
The experiment was established in 2016 to 2017 in 11 locations across Spain (Figure 1), and in 7 of the locations, C. diluta emergence was monitored both in 2016 to 2017 and for a second season in 2017 to 2018 (Table 1). The experiment was conducted under rainfed conditions with no supplemental irrigation, similar to conditions in cereal fields where this weed species is problematic. Four 0.25 by 0.25 m quadrats were established as experimental replications in each location. In each quadrat, a total of 100 C. diluta seeds were sown in the top 2 cm of soil by gently mixing the soil. The same sowing procedure was followed in all locations, except at the Sevilla Garden site, where the experiment was conducted using 35-L pots containing a mixture of 50% sand and 50% peat moss. Seeds were only sown during the first season between October and November 2016, depending on field and weather conditions (Table 1). Seedling emergence in each quadrat was recorded weekly from October until May, except during emergence flushes, when data were collected every 2 to 3 d. In three northern sites and three southern sites during the first year, the first two seedlings to emerge from each replicate quadrat were recorded and allowed to grow until mid-February to assess establishment success and early growth under different environmental conditions. All other seedlings that emerged at these six sites as well as all seedlings emerging at the other six sites were recorded and removed from quadrats at each sampling. The BBCH scale (Meier Reference Meier2001) was used to assess seedling phenology for the two plants per quadrat that were allowed to grow. In each location, a data logger with a thermometer DS18b20 sensor (Maxim, San José, California, USA) and conductivity LM393N sensor (ON Semiconductor, Phoenix, Arizona, USA) were placed at a 2-cm soil depth within the experimental area.
Locations showed as circles indicate areas in Spain where Centaurea diluta is considered a troublesome weed, whereas locations showed as triangle indicate areas where this weed is present but currently not considered problematic.

Location, sowing date, and soil texture for the 11 experimental field sites in Spain.

a In these locations, the experiments were conducted during an additional season (2017 to 2018).
b The Sevilla Garden experiment was conducted using 35-L pots containing a mixture of 50% sand and 50% peat moss.
Estimation of Thermal and Hydrothermal Time
Temperature and moisture data from each location were used to estimate cardinal temperatures: base (Tb), optimum (To), and ceiling (Tc). These values were obtained through an iterative process using the following steps: several combinations of these three cardinal temperatures were used to develop the TT or HTT; then, a nonlinear regression between TT or HTT and observed data (field-emergence data) was tested using three biological growth equations (Equations 1 to 3); and finally, the best-fit combination for the initial parameters was selected. Base water potential (Ψb) was calculated using a similar procedure. In the first year, the sowing date was considered as the zero moment, while in the second year, the zero moment was considered the first day when >10 mm of rain were received.
Water content was estimated using conductivity values, given the high correlation between these two variables (Brevik and Fenton Reference Brevik and Fenton2002), and then was used to calculate the water potential following the equations described in Saxton and Rawls (Reference Saxton and Rawls2006).
Once the cardinal temperatures were fixed, both cumulative thermal (TT) and hydrothermal times (HTT) were calculated by summing the daily TT and HTT as follows:
If the soil temperature was between Tb and To: TT = T − Tb
If the soil temperature was between To and Tc: TT = (Tc − T)
and if T < Tb or T > Tc, then TT = 0
where T is the mean daily temperature.
Hydrothermal time was estimated by including soil moisture in the TT calculations.
HTT = TT * (Ψ − Ψb)
where Ψ − Ψb = 0, if Ψ < Ψb; otherwise, Ψ − Ψb = 1.
To develop this TT, a reduction in daily TT was established when the temperature was above To, because a slight reduction between To and Tc makes more biological sense than a drastic reduction when the temperature is above Tc. This approach to determining TT was used by Roman et al. (Reference Roman, Murphy and Swanton2000) and Sousa-Ortega et al. (Reference Sousa-Ortega, Chamber, Urbano, Izquierdo, Loureiro, Marí, Cordero, Vargas, Saavedra, Lezaun, Paramio, Fernández, Torra and Royo-Esnal2019) with good results. Moreover, as the three cardinal points were established by an iterative process using numerous combinations of them, a possible result with similar To and Tc would suggest that this slight reduction in TT is not necessary.
Modeling Seedling Emergence and Statistical Analysis
Three sigmoidal models were fit to the results: Gompertz (Equation 1), three-parameter log-logistic (Equation 2), and three-parameter Weibull (Equation 3) (Ritz et al. Reference Ritz, Baty, Streibig and Gerhard2015):
 $$Y = 100*{e^{\left\{ { - {e^{\left[ { - b\left( {TT - m} \right)} \right]}}} \right\}}}$$
where Y is the cumulative emergence; b is the emergence rate; TT is the thermal time (HTT, if using this scale); and m is the inflection point, which is the time to reach 50% emergence (Onofri et al. Reference Onofri, Gresta and Tei2010).
 $$Y = \;d/\left\{ {1 + {e^{\left[ {b\;*\;logTT - {\rm{log}}\left( m \right)} \right]}}} \right\}$$
 $$Y = d*{e^{\left\{ { - {e^{\left[ {b*\left( {\log TT - \log m} \right)} \right]}}} \right\}}}$$
where Y is the cumulative emergence, d is the maximum emergence, b is the slope (emergence rate) at m, and m is the inflection point.
The accuracy of these models was tested with the root mean-square error prediction (RMSEP) (Equation 4), where greater model accuracy is indicated by lower RMSEP values (Izquierdo et al. Reference Izquierdo, Bastida, Lezaún, Sánchez del Arco and Gonzalez-Andujar2013).
 $${\rm{RMSEP}} = \sqrt {1/n\sum\nolimits_{i = 0}^n {{{\left( {{x_i} - {y_i}} \right)}^2}} } $$
where x i represents the actual cumulative percentage emergence, y i is the predicted cumulative percentage emergence, and n is the number of observations. Testing was performed for 13 of 18 data sets, because data from sites with low emergence percentages (<10%) were excluded, as they were considered not representative of the emergence behavior of this species (Guillemin et al. Reference Guillemin, Gardarin, Granger, Reibel, Munier-Jolain and Colbach2013).
Practical Use of the Model
The model selected was tested with independent data to evaluate its predictive ability. The independent validation was conducted in two additional experiments. The first of these experiments was carried out in Morón (37.26°N, 5.75°W) following the same procedure described earlier and sowing C. diluta seeds on December 17, 2018. The soil was a sandy loam (68% sand, 14% silt, and 18% clay), and weather data were recorded with the same data logger described earlier. In the second experiment, the model was fit to a natural seedbank of C. diluta in Montoro (38.01°N, 4.41°W) in 2019 to 2020. The soil at this site was a clay composed of 5% sand, 31% silt, and 62% clay. Weather data were collected from the nearest weather station (Adamuz), and water content was estimated using the equations described in Fuentes-Yaguë (Reference Fuentes-Yaguë1998).
To further evaluate the accuracy of the model under different weather conditions, temperature and rainfall data for two seasons from the past 10 yr at the Córdoba site were selected to run the model. The weather data were taken from a weather station (37.86°N, 4.80°W) adjacent to the Córdoba experimental site. The first season was selected, because of an early first rain event (September 8, 2013), while the second season was selected for its relatively late first rain event (October 27, 2011). A linear regression based on experimental years was used to estimate the soil temperature for these two seasons.
Statistical Analysis
Differences in total seedling emergence among locations were analyzed by one-way ANOVA for each season. Differences among means were determined using Tukey’s test at P = 0.05.
Results and Discussion
Weather Conditions
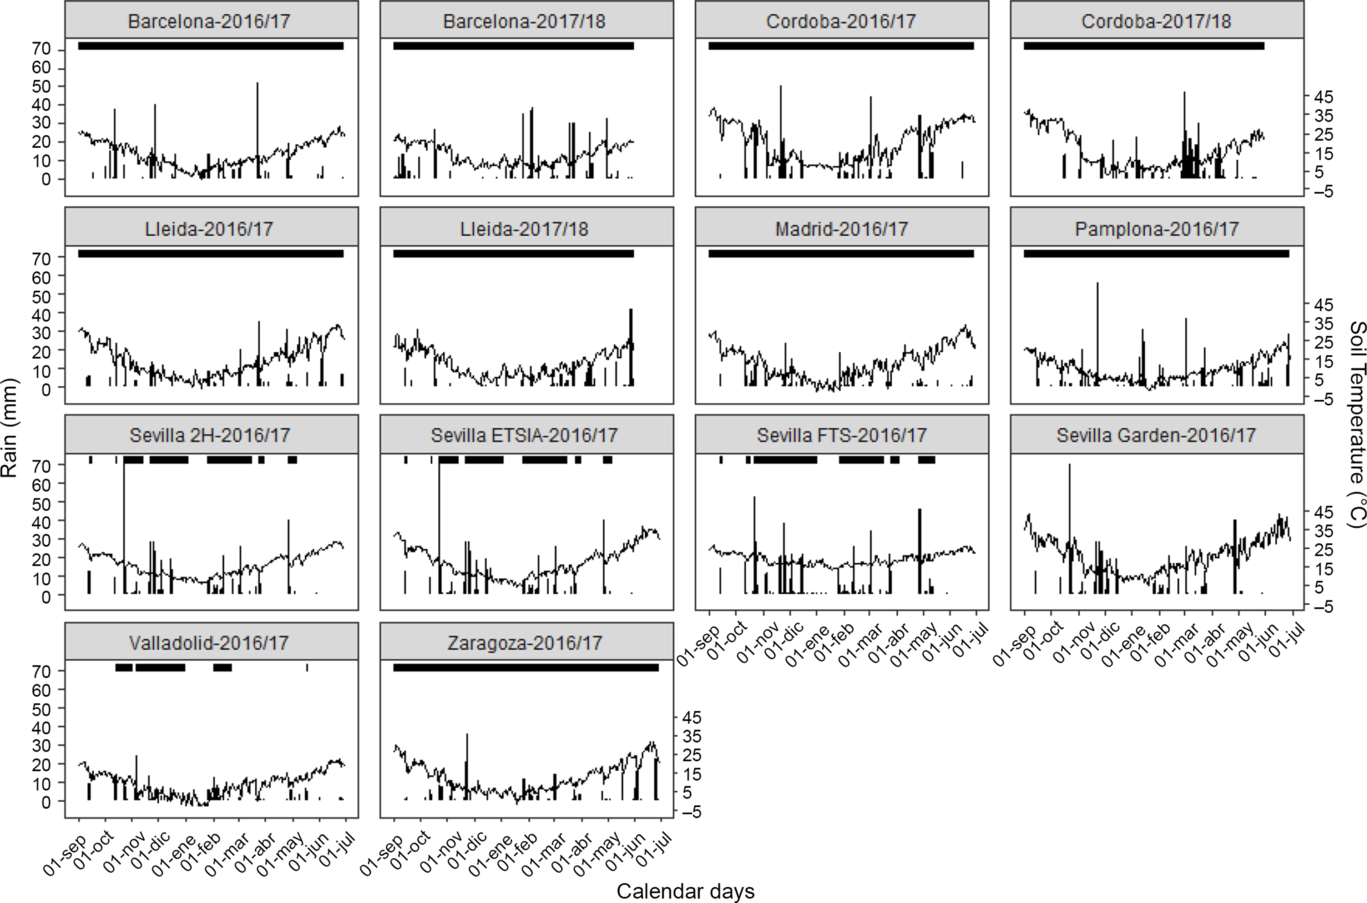
Weather conditions differed substantially between locations and seasons. These differences should provide robustness to any mathematical model that fits the emergence pattern. According to the model, moisture levels were adequate for the accumulation of hydrothermal degrees in all cases, with the exception of Sevilla ETSIA (both years), Sevilla FTS, and Valladolid (Figure 2).
Precipitation (vertical bar) and daily mean soil temperature (line) at the locations where more than 10 Centaurea diluta seedlings were recorded. The horizontal black bar at the top of each graph represents the period for adequate hydrothermal degree accumulation according to the model.

Emergence Pattern
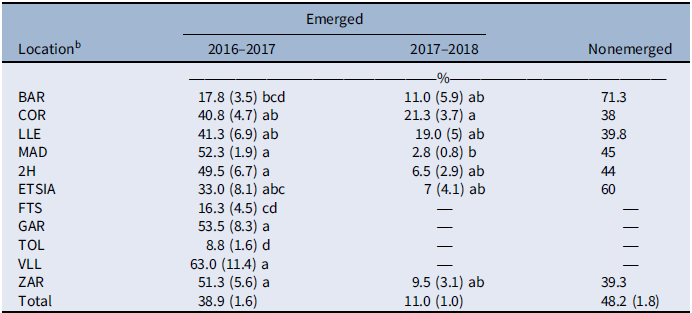
During the first season, the average percentage of emergence among all locations was 38.9% (Table 2), with significant differences between locations (P < 0.0001). Emergence of C. diluta was higher (52% to 63%) in Valladolid, Sevilla Garden, Madrid, Zaragoza, and Sevilla 2H than in Barcelona, Sevilla FTS, and Toledo. The average percentage of C. diluta emergence based on all locations during the first year was lower than that reported for other Centaurea species. The highest emergence values of 52% to 63% are below emergence values reported for other Centaurea species, including C. cyanus (68% to 79%) (Guillemin et al. Reference Guillemin, Bellanger, Reibeil and Darmency2017) and C. iberica (>75%) (Nosratti et al. Reference Nosratti, Abbasi, Bagheri and Bromandan2017). However, these studies were conducted under controlled environmental conditions and under more ideal germination and emergence conditions than likely occurred under the variable field conditions in our study.
Average percentage emergence (±SE) of Centaurea diluta across 11 experimental locations in Spain during two growing seasons.a

a Values within a column followed by the same letter are not significantly different according to Tukey’s test (α = 0.05). Data for 2016–2017 were transformed (x 0.1) to meet requirements for ANOVA, but nontransformed means are shown.
b See Table 1 for list of abbreviations for sites.
During the second season, the average total emergence (11%) at the seven sites where data were collected was lower than during the first year. Significant differences in total emergence were only found between the Córdoba and Madrid locations (P-value < 0.031) (Table 2). An average 48.2% of C. diluta seeds sown in this study did not result in the production of seedlings. The percentage of seeds not producing seedlings ranged between 39.3% and 71.3% depending on location. This trend of decreasing seedling emergence (Table 2) was also observed in C. cyanus, for which seed viability was found to decrease at the end of the first year (Guillemin et al. Reference Guillemin, Bellanger, Reibeil and Darmency2017). However, the fate of seedlings that did not emerge (i.e., seeds remained dormant in the soil, died, or were predated) was not determined in our study. The emergence observed during the second season was on average less than one-third (11%) of that in the first year (39%), and this tendency is likely to continue in the forthcoming seasons; thus, if the seed rain of C. diluta can be curtailed during two seasons, the seedbank of this species is likely to be substantially reduced. Certainly a more in-depth understanding of the fate and viability of C. diluta seeds in the soil would be most valuable for accurately assessing the soil seedbank and resulting seedling emergence levels.
The emergence pattern of C. diluta in 2016 to 2017 was similar in all locations, with a single main flush (50% of the emergence) occurring within 20 d after sowing (DAS), except at the Toledo site, where a drastically different emergence pattern was observed. The low proportion of seedlings emerging at this site (8.8%; Table 2), may not be representative of the typical emergence levels for this species (Guillemin et al. Reference Guillemin, Gardarin, Granger, Reibel, Munier-Jolain and Colbach2013). In general, emergence patterns across experimental locations were similar for the first 13 DAS, but differences were observed after 75% emergence was achieved.
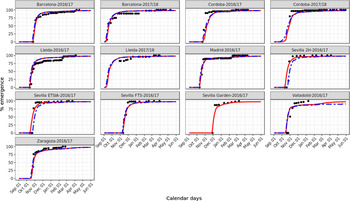
Centaurea diluta emergence flushes occurred early in the season and were concentrated over a few days (Figures 3 and 4). Thus, control of these seedlings is likely to be easier and more effective at these early growth stages than at later stages (Cardina et al. Reference Cardina, Herms, Herms and Forcella2007). Moreover, this timing is also likely to be more cost-effective as 80% to 90% of the weed management effort in this region occurs early in the growing season.
Predicted emergence of Centaurea diluta using the three-parameter Weibull model based on thermal time (red solid line) and hydrothermal time (dotted blue line) for all locations where more than 10 Centaurea diluta seedlings were recorded. Observed seedling emergence is shown by the black dots.

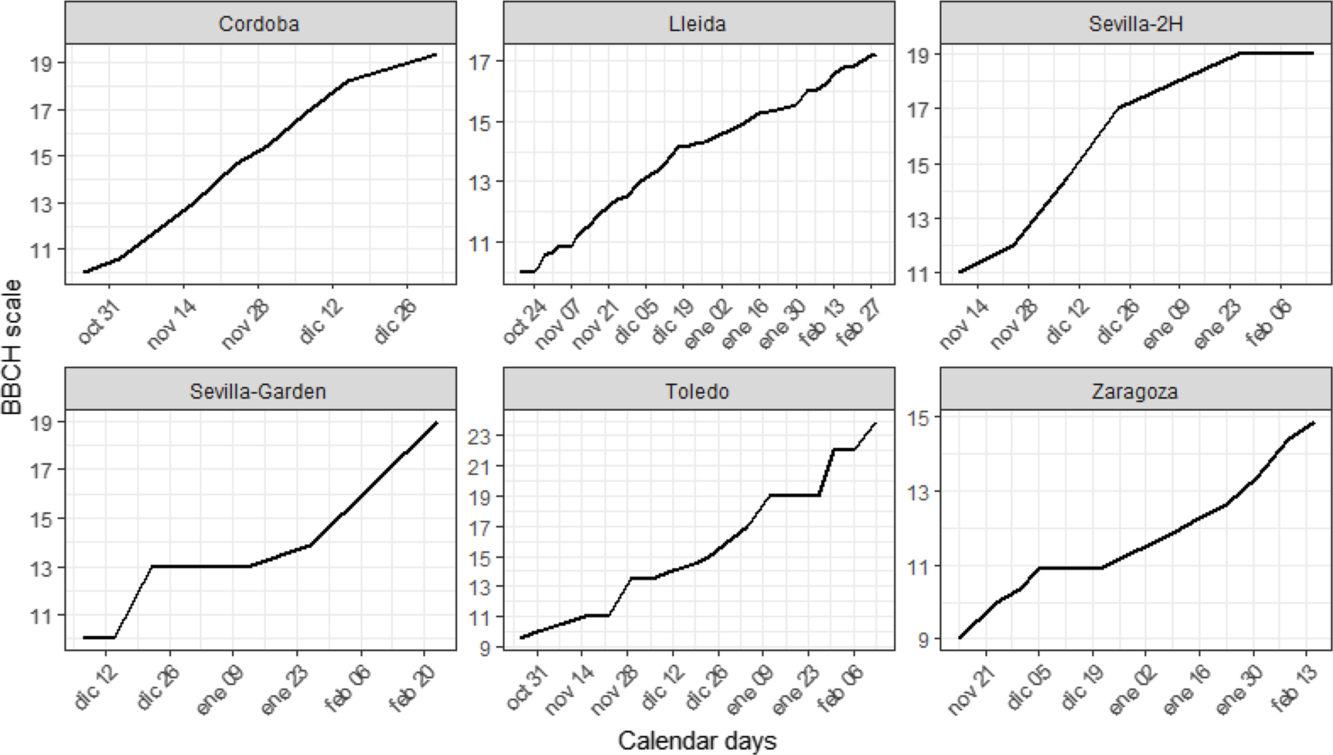
Early phenological stage of Centaurea diluta (using the BBCH scale) for three northern sites (Toledo, Zaragoza, and Lleida) and three southern sites (Sevilla Garden, Sevilla 2H, and Córdoba) in Spain in 2016–2017.

Early Plant Growth
Interestingly, emergence levels of C. diluta were not only similar for the northern and southern locations in Spain (Table 2), but plants survived the relatively cooler winter conditions at the northern sites. Centaurea diluta plants survived winter conditions in all locations where early seedling growth was monitored (i.e., three northern and three southern sites). Seedlings of C. diluta that emerged between the end of October and beginning of November produced more than 9 leaves (BBCH scale = 19) by mid-February with the exception of the Zaragoza site, where temperatures were lower, reducing the growth of plants (Figure 5). The lowest monthly mean temperature that C. diluta was able to survive was 6.2 C recorded at the Zaragoza site in December (Supplementary Data). Hence, C. diluta has the potential to establish and possibly become a problematic weed in northern regions of Spain.
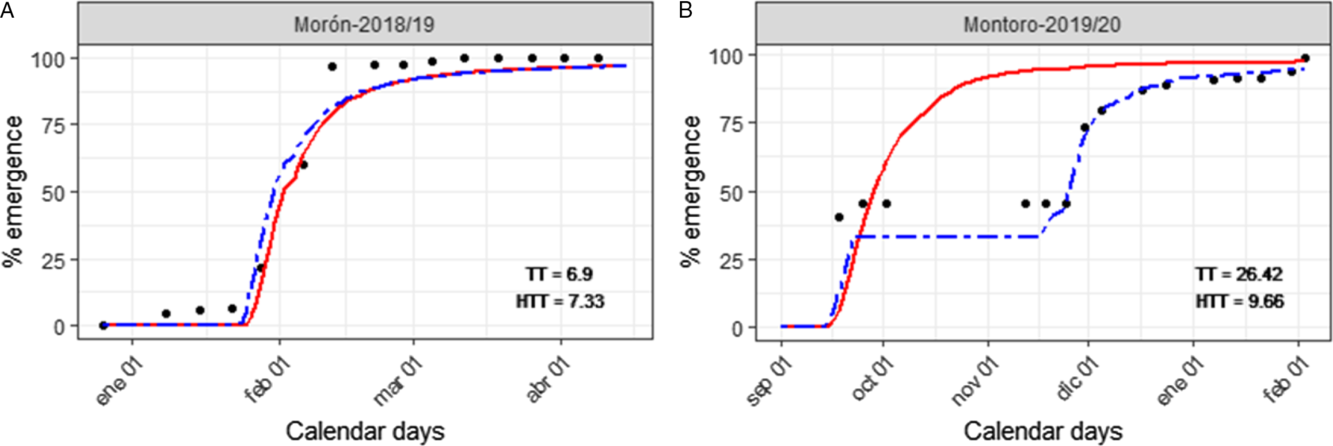
Predicted emergence of Centaurea diluta using the three-parameter Weibull model based on thermal time (red solid line) and hydrothermal time (dotted blue line) for the independent experiments used for model validation. Observed seedling emergence is shown by the black dots.

Development and Accuracy of Emergence Model
Tb, To, and Tc were established at 0.5, 10, and 35 C for thermal time (TT), while base water potential (Ψb) was estimated at −0.5MPa, for hydrothermal time (HTT), maintaining the same values for Tb, To, and Tc as the TT estimation.
The three-parameter Weibull model fit best and explained the emergence of C. diluta with higher accuracy than the Gompertz or the three-parameter log-logistic models. For the TT model, the parameter values were 98.30 for d, −2.08 for b, and 235.40 for c; while the parameter values for the HTT model were: d = 98.86, b = −1.73, and m = 189.78. Both TT and HTT had similar RMSEP values when assessed using field-emergence observations (Table 3; Figure 3).
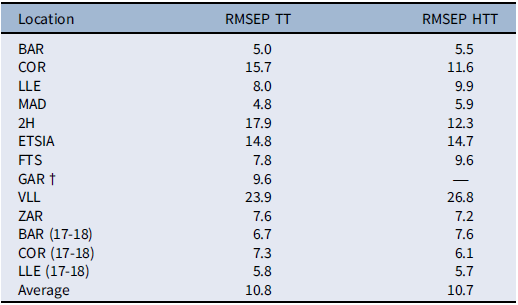
Root mean-square error prediction (RMSEP) values obtained from the thermal time (TT) and hydrothermal time (HTT) models for each experimental location where the total seedling emergence was greater than 10%.

a See Table 1 for list of abbreviations for sites.
b For the Sevilla Garden site, only the TT model was tested, because water potential could not be estimated using the equations described in Saxton and Rawls (Reference Saxton and Rawls2006).
Both the HT and HTT models successfully predicted the emergence patterns across the various field locations in Spain, with variations (RMSEP) ranging from 4.8 to 23.9 for the TT model and from 5.5 to 26.8 for the HTT model, depending on the location. The lack of differences in the accuracy of the TT and HTT models could be explained by the weather conditions, where water stress was only evident in Sevilla and Valladolid (< −0.5 MPa) (Figure 2).
Based on the RMSEP ratings of Royo-Esnal et al. (Reference Royo-Esnal, Torra, Conesa and Recasens2010), the TT model developed in our study can be considered excellent for the 2016 to 2017 season at the Madrid and Barcelona sites (RMSEP < 5); very good for the 2016 to 2017 season at the Lleida, Sevilla FTS, Sevilla Garden, and Zaragoza sites and for the 2017 to 2018 season at the Barcelona, Córdoba, and Lleida sites (5 < RMSEP < 10); good for the 2016 to 2017 season at the Sevilla ETSIA site (10 < RMSEP < 15), and poor at the Córdoba, Sevilla 2H, and Valladolid sites for the 2016 to 2017 season (RMSEP > 15). The fit of HTT model for the Madrid and Barcelona sites changed in 2016 to 2017 from excellent to a very good fit and for the Córdoba and Sevilla 2H sites from a poor to a good fit (Table 3). Seed counting at Valladolid finished earlier, so later emergence could not be accounted for, which could reduce the accuracy of the model at this site.
Practical Use of the Model
The tested sites showed a different behavior. At the Morón site, where 125 seedlings of C. diluta were recorded, TT- and HTT-based models provided very good accuracy (Figure 5A). On the other hand, at the Montoro site, where 525 seedlings were recorded, the accuracy of the TT-based model was poor, while that of the HTT-based model provided very good accuracy (Figure 5B). This difference was likely due to the water stress experienced at the Montoro site from October 23 to November 23. The ability of the HTT model to accurately predict the emergence of both sown seeds of C. diluta and those emerging from the resident seedbank, using the first significant rainfall (> 10 mm) as the zero moment, is to be highlighted (Figure 5). Moreover, the TT model provided good fit of the independent data when moisture was not limiting. This situation becomes important in a typical wet autumn in this region because of the difficulty in measuring soil moisture, a key parameter required for the HTT model (Finch-Savage Reference Finch-Savage, Benech-Arnold and Sánchez2004).
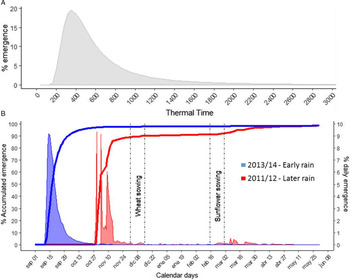
Centaurea diluta is a troublesome agronomic weed primarily in the southern region of Spain. For this reason, its emergence pattern at the Córdoba site is considered typical for this weed (Figure 6B). The emergence rate of C. diluta was relatively fast, with an important emergence flush occurring at 400 growing degree days (Figure 6A). Based on this model, the emergence pattern of this species was highly influenced by the timing of the first rain event (>10 mm). If this rain event occurrs at the beginning of September, then 90% emergence could be achieved by October 20; whereas if rain is delayed until the end of October, 90% emergence could be achieved by March 26 (Figure 6B). Similarly, Joley et al. (Reference Joley, Maddox, Schoenig and Mackey2003) reported that emergence of C. solstitialis was promoted by an 11-mm rainfall event before typical autumn rainfall.
(A) Density function (Weibull equation derivative) of Centaurea diluta emergence relative to thermal time. (B) Cumulative percentage emergence (line) and daily percentage emergence (area) of Centaurea diluta predicted by the model using weather data from 2011–2012 (later rain event) and 2013–2014 (early rain event).

In both our simulated scenarios, the main seedling emergence flush occurred quickly after the first rainfall. If the first rain event occurs at the beginning of September, C. diluta will have attained 95% emergence before the typical wheat-sowing period in the region (December 1 to 15). Thus, emergence of the remaining 5% of seedlings may be low enough not to significantly affect wheat yield. This is especially the case in sunflower, which is sown during the second half of February in many regions of Spain, by which time 96% of C. diluta seedlings will have emerged. If the rain event is delayed until the end of October, emergence will be more staggered, attaining a 68% to 72% and 74% to 78% emergence at the time of typical wheat and sunflower sowing, respectively. Hence, depending on the timing of the first rain event, weed management options would vary. For example, if the first rains occurred early in the season, delaying sowing of wheat would be an effective strategy for managing C. diluta (Figure 6B).
Even if the first rain event is delayed, C. diluta emergence at wheat or sunflower planting would be greater than expected. So the presence of a large C. diluta seedbank in these crops could explain why this weed is present at high densities and causes substantial crop yield reductions. As mentioned earlier, almost 50% of the seeds sown apparently did not germinate, and hence emerge, in the two seasons of our study. It is possible that the viability of C. diluta seeds in the soil may be longer (>2 yr) than expected, at least for a certain proportion of the seed population, which could also explain the persistence of this species in arable crops of southern Spain. However, because of differences in the timing of soil disturbance in our experiment relative to that in commercial fields, the emergence patterns we observed and modeled for this weed may vary to some degree from those observed in commercial fields. That is, tillage occurring before the planting of both crops may have stimulated additional C. diluta emergence. Nosratti et al. (Reference Nosratti, Abbasi, Bagheri and Bromandan2017) and Joley et al. (Reference Joley, Maddox, Schoenig and Mackey2003) reported the stimulatory influence of light on the germination of the congeners, C. iberica and C. solstitialis. Thus, further research is needed to more fully understand the emergence behavior of C. diluta and to modify the models developed in our study to better reflect actual practices of growers in Spain.
The emergence of Centaurea diluta was effectively described in a large experiment that included data from 13 locations across Spain for one or two consecutive growing seasons. Moreover, the models developed showed good accuracies predicting the emergence of C. diluta from the natural seedbank. Our findings are potentially applicable to actual field situations by providing guidance on the optimal timing to implement weed control tactics or for crop sowing. However, additional experiments must be performed to integrate the possible effect of timing of soil disturbance before crop sowing on the emergence pattern of C. diluta.
Acknowledgments
We would like to thank Cátedra Adama and the Spanish Weed Science Society (SEMh) for providing financial support for this project. We are grateful to the many students and technicians who assisted with fieldwork at the different experimental locations. We would like to thank the Spanish government for partial funding, through project AVA 2019.020 “Advances in Technological Research in Winter Cereals: Genetic Improvement and Sustainable Management,” financed with Fondo Europeo de Desarrollo Regional (FEDER) funds (80%). Also, JT acknowledges support from the Spanish Ministry of Science, Innovation and Universities (grant Ramon y Cajal RYC2018-023866-I). We thank Enrique Chamber for installing and maintaining the data loggers at the various locations. No conflicts of interest have been declared.
Supplementary material
To view supplementary material for this article, please visit https://doi.org/10.1017/wsc.2020.22