Introduction
The topic of high-accuracy passive indoor localization and sensing at mm-wave and sub-THz frequencies has received an increased attention in the last 6 years, a period of time connected with the implementation of the 5 G and the beginning of 6 G wireless networks [Reference Kadera, Jiménez-Sáez, Schmitt, Schüßler, Hoffmann, Lacik and Jakoby1, Reference Wei and Zhang2–Reference El-Absi, Alhaj-Abbas, Abuelhaija, Zheng, Solbach and Kasier9]. The electromagnetic wave propagation in sub-THz channels shows a similar behavior trend as the mm-wave channels [Reference Xing, Rappaport and Ghosh10], which is advantageous for applications requiring very wide unlicensed operational bandwidth (e.g., inverse synthetic aperture radar imaging systems [Reference Bourdoux, Barreto, Liempd, Lima, Dardari, Belot, Lohan, Seco-Granados, Sarieddeen, Wymeersch, Suutala, Saloranta, Guillaud, Isomursu, Valkama, Aziz, Berkvens, Sanguanpuak, Svensson and Miako8], or passive indoor localization systems allowing detection accuracy below 1 mm [Reference El-Absi, Alhaj-Abbas, Abuelhaija, Zheng, Solbach and Kasier9]).
In our work, we focus on mm-wave and sub-THz passive identification landmarks for an indoor self-localization system, which will enable a device (e.g., drone) to self-navigate in a given environment without need of active reference targets. Several techniques involving frequency-coding corner reflectors with resonator arrays [Reference Alhaj-Abbas, E-Absi, Abuelhaijay, Solbach and Kaiser11–Reference Solbach, Alhaj-Abbas, El-Absi, Abuelhaija and Kaiser14], and high-Q photonic crystal (PhC) resonators [Reference Jiménez-Sáez, Schüßler, Pandel, Benson and Jakoby15] in combination with dielectric lenses [Reference Kadera, Jiménez-Sáez, Burmeister, Lacik, Schüßler and Jakoby16–Reference Sánchez-Pastor, Jiménez-Sáez, Schüßler and Jakoby20] have been introduced. The use of high-Q resonator tags for frequency identification and ranging facilitates the efficient use of the available bandwidth to achieve distinct frequency signatures by increasing the maximum coding density, i.e., the number of bits for a given bandwidth. Further, the high-Q resonators allow for longer ringing times leading to better differentiation from clutter response. However, the operation at higher frequencies poses additional manufacturing challenges due to the shorter wavelength, requiring fabrication of smaller structures.
A common disadvantage of solutions with homogeneous lenses lies in the limitation of the maximum lens size due to structural reflection, thereby reducing the maximum achievable radar cross-section (RCS), i.e., the maximum achievable detection range [Reference Jiménez-Sáez, Alhaj-Abbas, Schüßler, Abuelhaija, El-Absi, Sakaki, Samfaß, Benson, Hoffmann, Jakoby, Kaiser and Solbach12]. Further, higher dielectric losses in conventional commercially available dielectric materials such as Rogers 6010.2LM [Reference Karpisz, Salski, Kopyt and Krupka21], Preperm ABS750 [Reference Giddens, Andy and Hao22], or additive manufacturing photopolymers [Reference Kadera and Lacik23, Reference Duangrit, Hong, Burnett, Akkaraekthalin, Robertson and Somjit24] reduce the Q-factor of resonators below 350, hindering the separation of the tag response in environments with strong undesired multipath reflections, i.e., clutter [Reference Jiménez-Sáez, Alhaj-Abbas, Schüßler, Abuelhaija, El-Absi, Sakaki, Samfaß, Benson, Hoffmann, Jakoby, Kaiser and Solbach12]. While solutions with corner reflectors can provide higher or comparable RCS to homogeneous, or gradient-index lenses (e.g., Luneburg lens), they are more limited in a continuous angular response with stable RCS (e.g., ±45° for trihedral corner reflectors with sharp variations versus mostly constant RCS in ±75° for classical Luneburg lens) [Reference Jiménez-Sáez, Alhaj-Abbas, Schüßler, Abuelhaija, El-Absi, Sakaki, Samfaß, Benson, Hoffmann, Jakoby, Kaiser and Solbach12–Reference Solbach, Alhaj-Abbas, El-Absi, Abuelhaija and Kaiser14, Reference Kadera, Jiménez-Sáez, Burmeister, Lacik, Schüßler and Jakoby16].
To overcome the drawbacks connected with materials' dielectric losses such as lower reflected power or lower Q-factor, PhC high-Q resonators can be used as a retroreflective layer embedded into a wide-angle Luneburg lens on very low-loss high-permittivity materials, being lithography-based ceramic manufactured alumina and deep reactive ion etched (DRIE) high-resistive silicon (HR-Si) very suitable materials [Reference Jiménez-Sáez, Schüßler, Krause, Pandel, Rezer, Vom Bogel, Benson and Jakoby25, Reference Ornik, Sakaki, Koch, Balzer and Benson26]. This concept has been developed in our previous work on the dielectric substrates Rogers 5880 (lens) and Rogers 6010.2LM (coding tags) at a frequency of 80 GHz [Reference Kadera, Jiménez-Sáez, Burmeister, Lacik, Schüßler and Jakoby16]. This structure also presents the advantage of being chipless and passive, which implies less maintenance costs, owing to their lack of power sources.
This paper presents a novel wide-angle sub-THz frequency-coded retroreflector for indoor localization. The organization of the paper is as follows: section “Planar Luneburg lens antenna design” deals with a planar HR-Si Luneburg lens antenna design, section “Retroreflective high-Q resonator frequency-coded tags” presents a combination of high-Q HR-Si resonators embedded into the Luneburg lens, creating retroreflective frequency-coded tags, section “Fabrication and measurements” describes the fabrication process along with the experimental results of the Luneburg lens antenna and frequency-coded tags' characterization, and finally, section “Conclusion” concludes the paper with achieved results and proposes the future work on this topic.
Planar Luneburg lens antenna design
A planar Luneburg lens is employed to provide a stable wide-angle response for the frequency-coded retroreflective layer. It is designed on a HR-Si wafer with thickness t of 200 μm. The relative permittivity ɛr is 11.68 and tangent loss tan δ is assumed to be 0.00015, based on our previous measurements conducted at 90 GHz [Reference Jiménez-Sáez, Schüßler, Krause, Pandel, Rezer, Vom Bogel, Benson and Jakoby25]. The measurement data in [Reference Afsar and Chi27] show that HR-Si is very low dispersive and similar values of relative permittivity and tangent loss can be expected at the targeted sub-THz frequency range. The lens has a diameter of 20.4 mm (16.3 λ 0 at 240 GHz). For its performance evaluation as an antenna, the time-domain solver in CST Studio Suite is exploited with a WR-3 waveguide without flange as a lens antenna feed. The effective relative permittivity of the original Luneburg (1) lens lies between 2 (at the lens center) and 1 (at the lens circumference) [Reference Morgan28]:

where ɛr ,eff is the effective relative permittivity, r represents the radial distance, and R is the lens radius.
This permittivity distribution is hardly achievable in practice for high permittivity materials such as HR-Si. However, more-general solutions [Reference Morgan28], which allow higher effective relative permittivity values at the lens center and circumference, exist and can be implemented as proposed in [Reference Headland, Withayachumnankul, Yamada, Fujita and Nagatsuma29, Reference Hunt, Kundtz, Landy, Nguyen, Perram, Starr and Smith30]. Therefore, the parametric equations (2–4) are employed as follows [Reference Headland, Withayachumnankul, Yamada, Fujita and Nagatsuma29]:


where α represents the parameter which relates effective relative permittivity and normalized lens radius, ɛr ,eff,edge is the minimum effective relative permittivity at the lens edge and Ω is the auxiliary variable.
First, we set the effective relative permittivity at the lens edge, which is given by the unit cell chosen for the lens design. Second, we calculate equation (4) for the parameter α and deploy the result into equation (3) to obtain the corresponding effective relative permittivity. Through the relation between the normalized lens radius and parameter α in equation (1), we can scale the derived permittivity profile to the lens with an arbitrary radius. For ensuring the mechanical stability of the lens, we choose a perforated unit cell arranged into a triangular lattice whose minimum effective relative permittivity is 1.38 for the given dimensions. The analysis of the given unit cell and the effective relative permittivity distribution mapping of the lens is described in the following section.
Effective permittivity distribution mapping
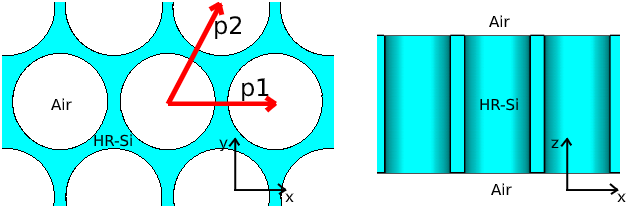
To realize the required effective permittivity distribution in the thin HR-Si dielectric slab, an array of cylindrical holes is arranged into a periodic triangular lattice with periodicities px = 120 μm and py = px·$\sqrt 3$ in x and y direction, respectively, as is shown in Fig. 1. This hole separation is sufficient for mechanical stability and applicability of the Maxwell Garnett effective medium theory to calculate effective permittivity for various hole diameters in the dielectric slab. It is worth to note, that the effective medium theory assumes a transverse electromagnetic (TEM) wave propagation, while for a very thin dielectric slab, the TEM wave cannot propagate due to slab's finite thickness [Reference Jaeheung and Barnes31]. Therefore, the effective relative permittivity distribution for the TE0 wave, which is a better approximation of a realistic propagation in thin dielectric slab, needs to be calculated.
Model of perforated silicon slab with holes arranged into the triangular lattice.

To calculate an effective relative permittivity of a perforated dielectric, the Maxwell Garnett effective medium approximation (EMA) model can be applied assuming an electric field vector orthogonal to the orientation of the holes. With the two considered media, HR-Si with a relative permittivity ɛSi = 11.68 and air with relative permittivity of 1, the approximation results in (5) [Reference Headland, Withayachumnankul, Yamada, Fujita and Nagatsuma29]:

where ɛeff,TEM is the effective relative permittivity for TEM wave propagation and ξ is the volume infill ratio of the air in the silicon. For the hole diameter D, the infill ratio is given by (6):

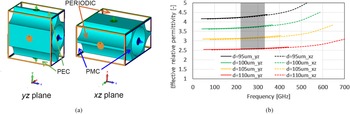
To validate the accuracy of the Maxwell Garnett analytical EMA formula (5), an additional numerical simulation for the effective relative permittivity retrieval from the dispersion diagram is employed [Reference Kadera, Lacik and Arthaber32]. The simulation setup with the given boundary conditions is depicted in Fig. 2(a). The electric field vector is oriented from top to bottom of the given unit cell. The effective relative permittivity is then obtained from the following formula (7):

where β is the corresponding phase constant and λ 0 is the free-space wavelength.
Simulation setup for the effective relative permittivity determination of the perforated unit cell (a), the effective relative permittivity in yz and xz planes and frequency corresponding to the phase shift between 0 and 180 degrees across the unit cell (the operational frequency range is shadowed) (b).

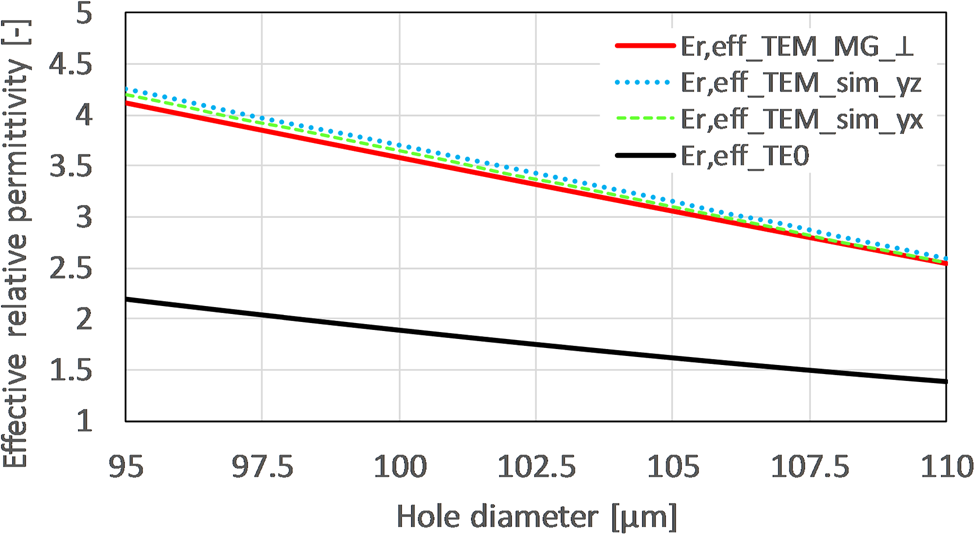
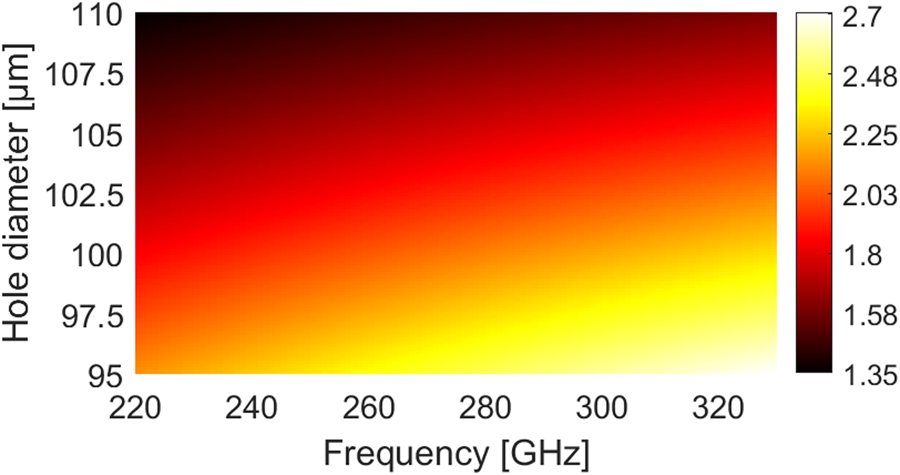
In the observed operational frequency range (220–330 GHz), the effective relative permittivity varies up to 4% from the nominal value at 220 GHz for the smallest hole diameter of 95 μm. The comparison of the effective relative permittivity obtained from the dispersion analysis and the Maxwell Garnett EMA is shown in Fig. 3. There is obviously a very small discrepancy between the numerical and the analytical approach. Therefore, the Maxwell Garnett EMA, which allows for faster calculations compared to the numerical dispersion analysis, can be applied for calculation of the effective relative permittivity of the TE0 dielectric slab propagation mode. To do so, a corresponding phase constant β 0 is obtained from a transcendental form of equation (8) and put into equation (9). The resulting effective relative permittivity of the TE0 mode at a frequency of 240 GHz is included in Fig. 3. The effective relative permittivity of the TE0 mode over wide frequency range (220–330 GHz) is depicted in Fig. 4, where dispersive behavior of the given mode is clearly appreciated, e.g., for the hole diameter of 95 μm, the effective relative permittivity varies between 2.13 and 2.68.

where k 0 is the free-space wavenumber.

The effective relative permittivity of the perforated silicon slab (t = 200 μm) with a triangular lattice obtained from dispersion diagrams, Maxwell Garnett effective medium approximation, and calculation of the TE0 mode at a frequency of 240 GHz.

The effective relative permittivity of the TE0 mode over wide frequency range (220–330 GHz) for the perforated silicon slab (t = 200 μm) with the triangular lattice and different hole diameters.

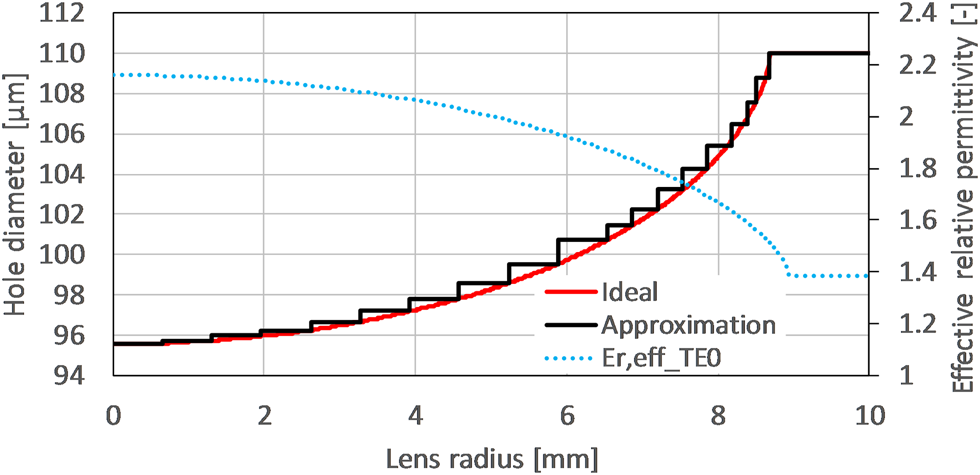
The required effective relative permittivity profile of the lens is achieved by mapping the hole diameters that exhibit the targeted effective relative permittivity value to the defined position along the lens radius. For this purpose, a customized MATLAB code is developed, and the resulting mapping is shown in Fig. 5. To simplify the modeling process, the ideal hole mapping profile is discretized into 19 layers. The minimum and maximum hole diameters are 95 and 110 μm, resulting in the effective relative permittivity of 2.16 and 1.38, respectively, at the design frequency of 240 GHz. Further details on the design process can be found in [Reference Headland, Withayachumnankul, Yamada, Fujita and Nagatsuma29].
Mapping of the hole diameter to the effective relative permittivity profile of a planar Luneburg lens at a frequency of 240 GHz.

Lens antenna performance
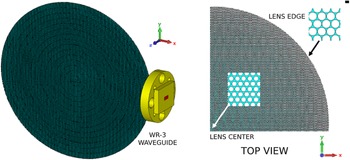
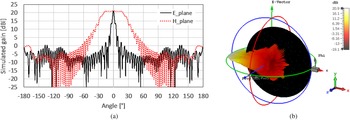
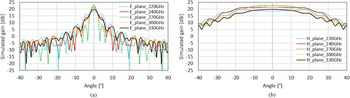
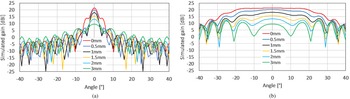
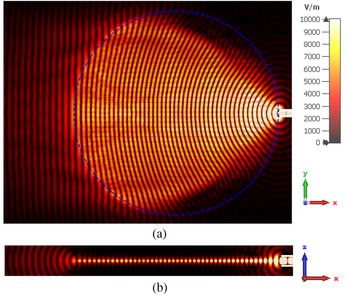
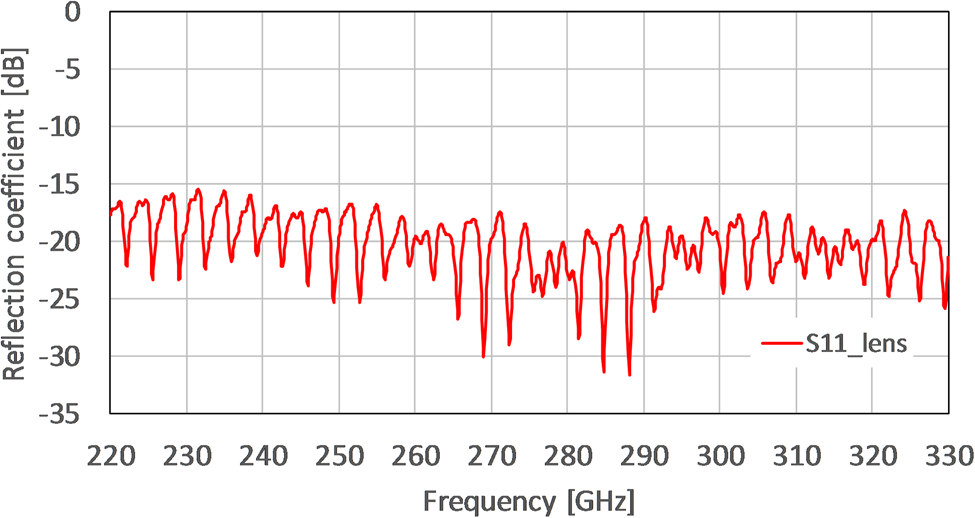
A 3D model of the proposed planar Luneburg lens antenna excited by a WR-3 open waveguide without flange (0.8638 mm × 0.4318 mm, wall thickness 0.2 mm) located at the lens edge is shown in Fig. 6. The lens is placed in xy plane with the narrower waveguide side oriented along the y axis for the proper lens excitation. The simulated antenna's radiation patterns at a frequency of 240 GHz are shown in Fig. 7, and the simulated broadband antenna gain in E- and H-plane is depicted in Fig. 8. The influence of the waveguide excitation position shift on the radiation patterns is presented in Fig. 9. The electric field distribution of the lens antenna is shown in Fig. 10 and its input reflection coefficient is shown in Fig. 11.
3D model of the planar Luneburg lens antenna, showing the unit cell pattern in the lens center and lens edge.

Simulated gain radiation pattern of the planar Luneburg lens antenna, in 2D (a), in 3D (b), f = 240 GHz.

Simulated gain radiation patterns of the planar Luneburg lens antenna, E-plane (a), H-plane (b).

Influence of the waveguide excitation position shift from the lens edge on the simulated gain radiation patterns of the planar Luneburg lens antenna, f = 240 GHz, E-plane (a), H-plane (b).

Electric field of the planar Luneburg lens antenna, top view (a), side view (b), f = 240 GHz. The blue dashed line represents the lens profile. On the side view is clearly visible confinement of the propagating wave inside the lens.

Simulated input reflection coefficient of the planar Luneburg lens.

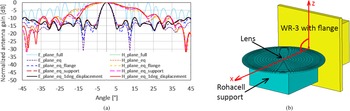
The simulated gain of the planar Luneburg lens antenna is 20.9 dBi at a design frequency of 240 GHz with the HPBW and side-lobe level (SLL) of 3.3° and −7.4 dB in E-plane, and HPBW of 46.7° and SLL of −7.9 dB in H-plane. The broadband antenna gain increases while the HPBW decreases over frequency up to about 270 GHz and then it turns to be opposite for higher frequencies, which is caused by the dispersive behavior of the TE0 propagation mode. Shifting the feeding waveguide away from the lens edge causes a rapid decrease of antenna gain. Regardless, a very small shift of the waveguide in tenths of millimeter reduces the SLL in the E-plane. A similar effect was also reported during measurements in [Reference Xue and Fusco33]. The simulated input reflection coefficient, presented in Fig. 11, achieves values below −15 dB in the full frequency range and the observed ripples are caused by air perforations in the HR-Si substrate. The simulated efficiency, including dielectric losses and impedance mismatch between the open waveguide and the lens at the design frequency, reaches 95%. The effect of measurement setup (section “Luneburg lens characterization”) on the Luneburg lens antenna performance is estimated by an approximate model composed of solid layers of varying permittivity as shown in Fig. 12, which reaches the same value of gain as the perforated lens. A difference between the equivalent lens and full lens models lies in a reduced mesh cells required for a single simulation with the time-domain solver of CST Studio Suite. The full lens model requires 830 million mesh cells, while the equivalent model requires only 31 million mesh cells. When including the measurement configuration, i.e., the waveguide feed with flange and a dielectric supporting block from Rohacell (ɛr ≈ 1.03, tan δ ≈ 0.005 at 250 GHz [Reference Roman, Ichim, Sarger, Vigneras and Mounaix34]), the number of mesh cells of the simplified approximation model increases up to 131 million (≈4x), which would require about 3.5 billion mesh cells for the full lens model, what is beyond the capacity of our available computational resources. However, the dominant effect of the measuring setup configuration can be observed mainly in the H-plane, where the waveguide flange decreases the maximum HPBW and the Rohacell supporting block along with off-the-axis displacement deforms the radiation pattern.
The effect of measurement setup on the planar Luneburg lens antenna radiation pattern (a). The equivalent lens model is used to evaluate waveguide flange, Rohacell support, and off-the-axis (x-z) lens displacement (b).

Retroreflective high-Q resonator frequency-coded tags
To achieve a retroreflective tag, the Luneburg lens presented in the previous section is backed with a structure that reflects an incoming EM wave. In order to pursue fully monolithic tags, it is designed with the same material as the lens, in this case HR-Si, to allow for the easy integration of both structures. In this direction, fully dielectric 2D PhC present an electromagnetic bandgap that forbids the propagation of a certain bandwidth. In our case, we chose to implement a 2D PhC by a 200 μm thick slab of HR-Si with embedded air holes in a triangular lattice. Moreover, high-Q resonators for frequency coding are easily implemented in this structure, by removing a hole of the air lattice, and adjusting the surrounding holes.
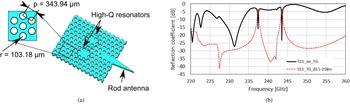
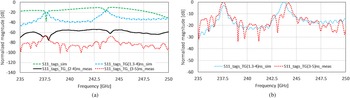
The basic 2-resonator PhC-based reflective layer is presented in Fig. 13, along with its simulated backscattered response. After the resonators' backscattered responses are isolated by employing time-gating with a rectangular time window between 0.5 and 20 ns, two peaks corresponding to the two embedded resonators arise. Thus, the retroreflective tag operating principle can be summarized in that the Luneburg lens focuses the incoming EM wave into the PhC-based frequency-coded reflective layer. On the one hand, an early wideband reflection, corresponding to the electromagnetic bandgap of the PhC, is backscattered, which can be used for ranging. On the other hand, the high-Q resonators are excited and slowly backscatter their response toward the monostatic radar reader, which detects the corresponding peaks after time-gating of the received signal. By implementing peaks (i.e., resonators) at different frequencies, identification between different tags is possible. Further information about the resonators design can be found in [Reference Jiménez-Sáez, Schüßler, Jakoby, Krause, Meyer and Vom Bogel35].
Single 2-bit high-Q tag (a), and its simulated backscattered response (b).

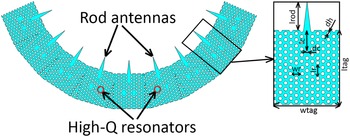
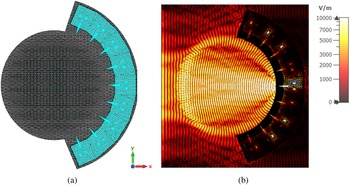
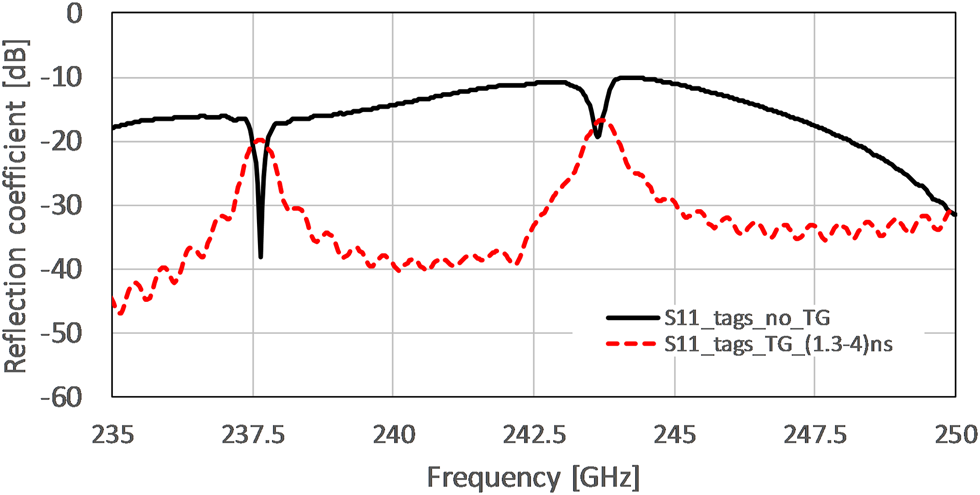
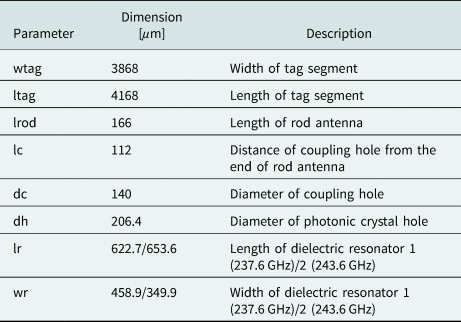
To achieve wide-angle identification, nine PhC-based 2-bit high-Q coding tags have been designed to be integrated behind the Luneburg lens in the azimuthal angular range of 140 degrees, by repeating the single 2-bit high-Q tag at approximately multiples of ±15 degrees. This angular spacing is chosen to allow for a certain separation between the rotated structures, to prevent cross-coupling effects between the high-Q resonators, as well as to achieve a locally undistorted triangular lattice near them. In consequence, the identification response of the tag is not continuous with the interrogation angle but limited to the angular ranges where a rod antenna is present and able to couple the interrogating EM wave into the PhC waveguide. The resulting circular structure is displayed in Fig. 14, whereas the complete tag, i.e., the planar Luneburg lens with embedded retroreflective coding tags and its E-field at the resonance frequency of one resonator is shown in Fig. 15. A single segment of the PhC coding tags and its dimensions are summarized in Table 1. The 2-bit coding tags resonate at 237.6 and 243.6 GHz with Q-factors of 480 and 435, respectively. A time-gating window from 1.3 to 4 ns is applied to obtain the frequency response of the coding part, which is depicted in Fig. 16.
Model of nine PhC frequency-coding tags with 2-bit high-Q resonators and input rod antennas, including a single segment close-up view.

Model of the planar retroreflective Luneburg lens with integrated coding tags (a), electric field in resonance (b), f = 237.6 GHz.

The simulated frequency response of the frequency-coded PhC retroreflective Luneburg lens. The results assume a waveguide port excitation with E-field parallel to y-axis and propagation in x-axis, located 3 mm from the lens front edge.

Dimensions of the PhC coding tags

Fabrication and measurements
Fabrication process
The tags are fabricated on a (100)-oriented high resistive (HR) silicon substrate with a resistance exceeding 10 kΩ/cm and a thickness of 200 ± 10 μm. The Luneburg lens and the PhC resonators are fabricated separately using a mask layout with an individually adopted frame surrounding the specimens that allow the separation of the lenses and resonators from the HR substrate. The separate fabrication of the tags allows for their individual characterization.
The first step (Fig. 17(a)) of the fabrication is the deposition of a 1 μm thick SiO2 layer on the HR-silicon substrate with plasma-enhanced chemical vapor deposition. The SiO2 layer is used as a hard mask protecting the HR substrate during the DRIE process. Lithography (Fig. 17(b)) is based on an AZ MIR 701 positive photoresist and followed by the patterning of the SiO2 layer (Fig. 17(c)) using a reactive ion etching process. The next step is the deep etching of the silicon (Fig. 17(d)). As the 75 mm HR substrate is completely etched through, it is placed on a 100 mm carrier wafer. The DRIE process is conducted at 12 °C and consists of two sections. The first process is used to etch the first 180 μm with a high etching rate, high-frequency capacitive-coupled-plasma (CCP), and realizes an etching angle of 89.4°. The second process section has a low etching rate, a pulsed low-frequency CCP, and is used to etch the last 20 μm of the substrate. The low-frequency CCP process minimizes the risk of notching at the interface to the carrier wafer. In contrast to standard silicon substrates, HR substrates differ in the way of absorbing and reflecting the ions during the DRIE process, requiring a careful process adjustment. Finally, the tags are cleaned and released from the carrier substrate with solvents and the SiO2 layer is released from substrate surface with hydrofluoric (HF) acid (Fig. 17(e)). The fabricated lens and frequency-coded tags are shown in Fig. 18.
Fabrication process: deposition of 1 μm SiO2 (a), lithography (b), etching of SiO2 (c), etching of silicon (d), HF-cleaning (e), (drawings not to scale).

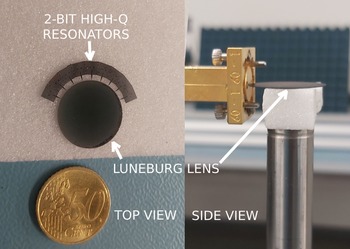
Fabricated HR-Si planar Luneburg lens with nine 2-bit PhC high-Q resonator tags.

Luneburg lens characterization
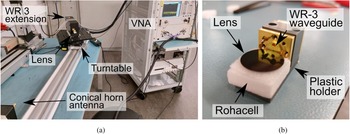
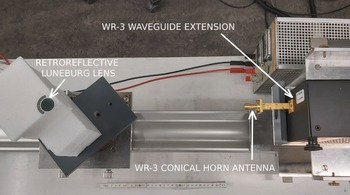
The measurement setup for the characterization of the lens antenna is shown in Fig. 19. It includes a Vector Network Analyzer Agilent Technologies N5222A with a Virginia Diodes WR-3 extension (220–330 GHz) and a 21 dBi WR-3 conical horn antenna. A turntable and VNA are controlled by a computer, which rotates the lens and measures the transmission coefficient S 21, in 1-degree steps. The lens is placed in a customized holder to attach it to the WR-3 extension. The separation between extensions is set to 90 cm, so the lens lies within the far field of the conical horn antenna that starts at 0.64 m [Reference Abdallah, Sarkar, Monebhurrun and Salazar-Palma36].
Luneburg lens antenna measurement setup (a), and close view of the customized lens holder (b).

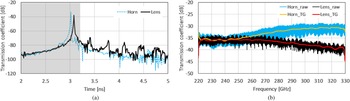
The lens's gain is calculated by means of the three-antenna method. First, S 21 is measured between two reference conical horn antennas. Second, one of the horn antennas is replaced by the lens and a new measurement is performed. Third, both measurements are subtracted between each other and added to the gain of the reference horn antenna. In this process, environmental reflections are filtered out of the measurements employing time-gating. This method is employable at mm-wave and sub-THz bands instead of an anechoic chamber owing to large absolute bandwidths (110 GHz for our measurement setup) that increase the time-step resolution of the measurements and permit the isolation of the line-of-sight (LoS) contribution. In Fig. 20, the measured transmission coefficient is presented, where in (a) the time-gating window only spans during the first received high-amplitude peak, which corresponds to the LoS path between the two WR-3 extensions. In (b) the raw and time-gated frequency responses are displayed, where the effect of filtering-out late reflections is clearly appreciated in a more stable and cleaner received signal.
Received transmission coefficient for a distance of 90 cm between the two WR-3 extensions, time-domain response with shaded time-gating window between 2 and 3.2 ns (a), frequency response (b).

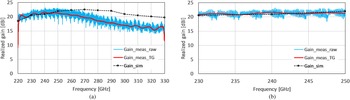
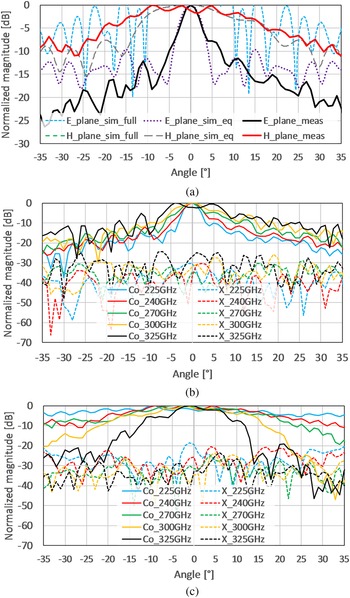
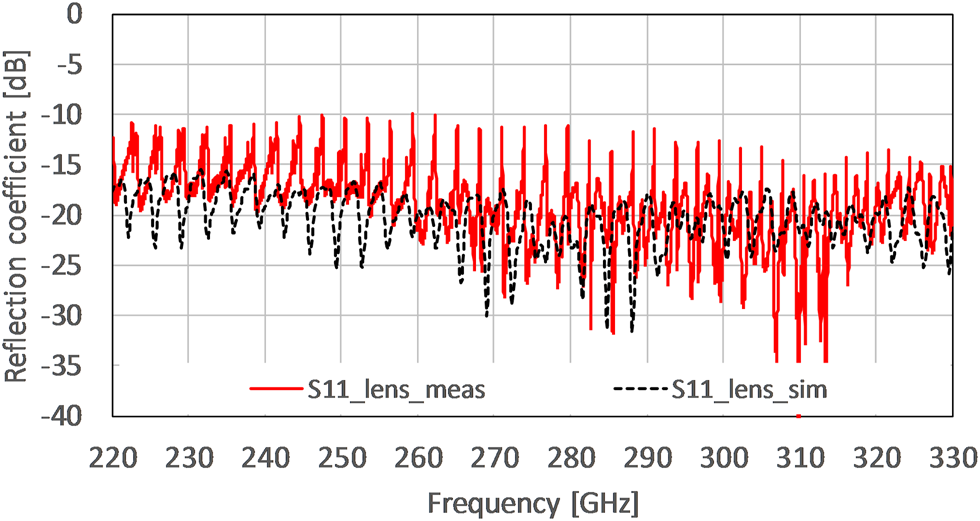
The measured and simulated Luneburg lens antenna gain, and radiation patterns are shown in Figs 21 and 22, respectively. The gain of the planar Luneburg lens antenna is 21.63 dBi at a frequency of 240 GHz with the HPBW of 4.1° in E-plane and HPBW of 30° in H-plane. The antenna gain is overall stable over frequency, from 220 to 250 GHz, with the notches at 220 and 330 GHz owing to the rectangular window selected for the time-gating. The decrease of antenna gain above those frequencies is caused primarily by the dispersion properties of the TE0 mode in the HR-Si substrate, leading to a different effective relative permittivity profile, and due to slightly anisotropic properties of the perforated unit cells arranged in the hexagonal lattice. Both effects were observed also in [Reference Headland, Withayachumnankul, Yamada, Fujita and Nagatsuma29]. As misalignments of the order of 300 μm are significant (λ 0/4 at 240 GHz), this is one of the reasons for the variations observed in the measured radiation patterns during lens rotation. The influence of the Rohacell support is also apparent from the non-symmetrical radiation pattern in H-plane. Finally, the measured reflection coefficient is shown in Fig. 23, in which it is noticeable that its value lies below −10 dB for the whole operating bandwidth.
The simulated and measured gain of the planar Luneburg lens antenna at broadside direction, full frequency range (a), detail (b).

The measured and simulated radiation patterns of the planar Luneburg lens antenna, normalized antenna gain at f = 240 GHz (a), measured antenna gain in E-plane (b), measured antenna gain in H-plane (c).

The simulated and measured reflection coefficient of the planar Luneburg lens.

Retroreflective tag characterization
The tag consisting of the Luneburg lens and nine repetitions of the PhC-based reflective layer with two embedded high-Q resonators is placed on the turntable, and both ordinary foam and Rohacell are used to adjust the height of the tag. The turntable and VNA are controlled by a computer, which rotates the tag and measures the scattering parameter S 11 at the antenna in 1 degree steps. For the characterization, a single measurement is performed without the lens and subtracted from the measured results to reduce the effect of the table on the measured response. The measurement setup is displayed in Fig. 24.
Measurement setup of the frequency-coded PhC retroreflective Luneburg lens with nine two-resonator repetitions.

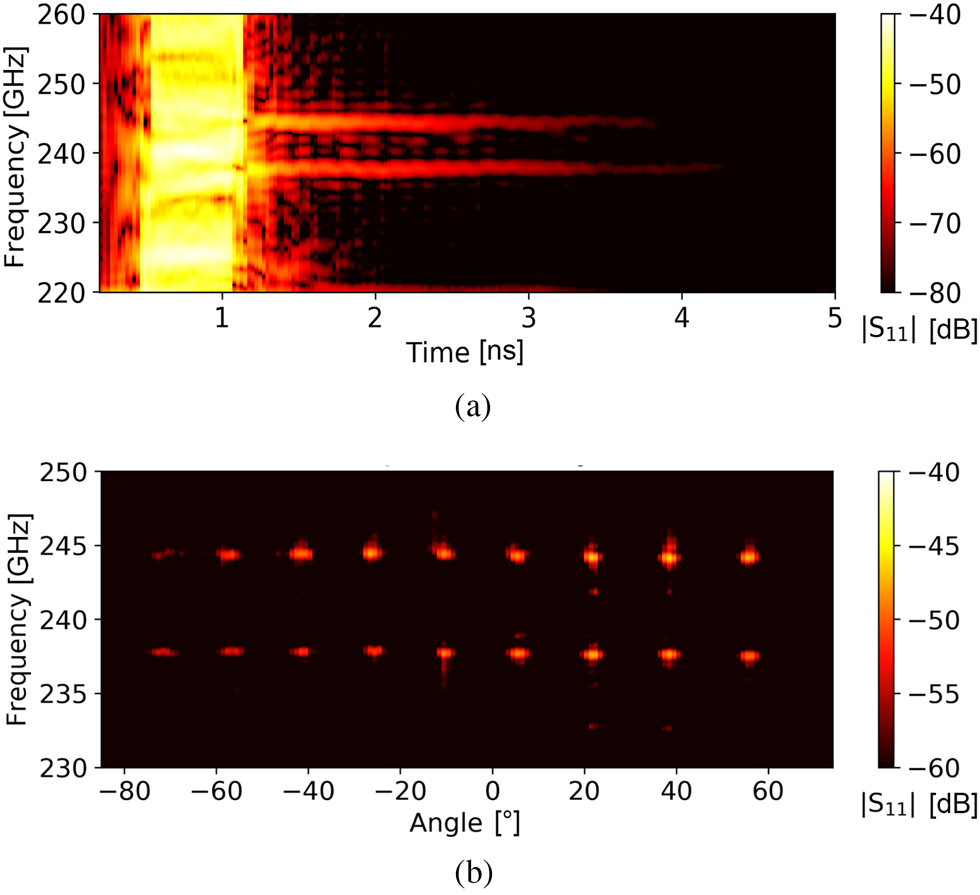
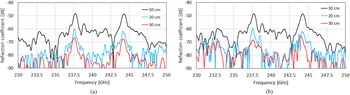
The time-frequency response of the frequency-coded Luneburg lens retroreflector at a distance of 30 cm is shown in Fig. 25. Its measured response in frequency-domain is presented with two different time-gating windows. From 2 to 4 ns, a wideband reflection is appreciated, whose corresponding inverse Fourier transform (i.e., the pulse in time-domain) can be employed to perform ranging. Then, from 3 to 5 ns, the resonators' responses arise in the form of two peaks at 237.6 and 244.3 GHz. The slight difference between simulations and measurements for the second peak (0.29% shift toward higher frequencies) is attributed to the manufacturing method. Further, the high-Q behavior and angular response of the retroreflective tag is presented in Fig. 26 at a distance of 10 cm. In Fig. 26(a), the long ringing characteristic of the high-Q resonators is clearly appreciated as two horizontal lines, after the wideband reflection of the PhC reflective layer, which is present until around 1 ns. In Fig. 26(b), the azimuthal angular stability of the tag is presented, demonstrating the excitation of both resonators at different angles. A symmetric response is expected, and the lower power from the left-end of the figure is attributed to disturbances from the Rohacell support.
The simulated and measured frequency response of the frequency-coded PhC retroreflective Luneburg lens (a), normalized time-gated frequency response (b). The measurement is realized at a distance of 30 cm, the simulation assumes a waveguide port excitation located 3 mm from the lens front edge.

Time-frequency plot of the measurement realized with the frequency-coded PhC retroreflective Luneburg lens with nine 2-bit tags in azimuthal plane at a distance of 10 cm (a), azimuthal angular stability (b).

The RCS of the retroreflective tag is calculated employing a metallic sphere with a diameter of 20 mm. To do so, the S 11 of the sphere is measured when it is located at the same position as the tag. In this case, the tag's RCS (σ) can be computed as (10):

where σsphere can be calculated with its analytical formula, σsphere = πr 2, with r the sphere's radius.
For our employed metallic sphere, the analytical RCS is −30.06 dBsqm, whereas the measured maximum RCS of the retroreflective tag is −23.48 dBsqm at 240 GHz for a time-gating between 2 and 4 ns (ranging) and of −36.00 and −36.80 dBsqm for the resonators at 237.6 and 244.3 GHz, respectively, when a time-window from 3 to 5 ns is employed (identification). These latter values heavily depend on the starting time of the time window. For instance, when the window spans between 2.5 and 4.5 ns, the resonators RCSs are increased approximately by 5 dB.
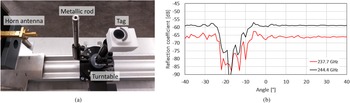
The retroreflective tag profits from two effects for its detection and identification in cluttered environments. On the one hand, the high-Q resonators allow for the retrieval of the frequency coding by outlasting environmental echoes. On the other hand, the employment of the high gain Luneburg lens is useful to achieve spatial filtering. That is, the tag is detected when there is LoS with the monostatic radar reader. However, when an obstacle is placed between the tag and the reader, the blockage that it introduces might prevent correct tag identification. As an experimental verification of this effect, the reader and tag are separated 15 cm and a metallic cylinder of diameter 12 mm is located in the middle between them, as presented in Fig. 27(a). The measured results for the resonance frequencies of the tag are presented in Fig. 27(b). It is noticeable that the rod has no impact on the response when it is not blocking the direct LoS path between tag and reader. However, from approximately −20° to −10° there is no backscattered power at resonance, because of complete blockage in the LoS path caused by the rod.
Angular response when an obstacle is introduced between reader and tag, measurement setup (a), time-gated reflection coefficient at resonance (b).

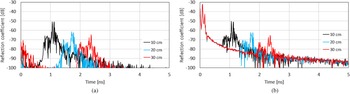
The previous measurements are obtained after performing empty room extraction to achieve results as accurate as possible. That is, the subtraction of the response of the room without the tag to the measurements. However, in reality this is undesired, as the retroreflective tags are intended to work in unknown environments, in which no a-priori information is available. Thus, their detection should be possible even when the aforementioned technique is not applied. In Fig. 28, the received response in time-domain is presented for both cases.
Received echoes by the reader for different separations from the reader when empty room measurement is subtracted (a) and raw data, i.e., no subtraction is performed (b).

The differences in the time-domain response for the measurements are clearly appreciated. For instance, the noise floor for Fig. 28(a) is around −100 dB, whereas for the raw measurement data it is 10 dB higher. Moreover, in Fig. 28(b) a very high amplitude peak is present in the first 300 ps, which corresponds to interface mismatch between the horn antenna and the WR-3 flange of the frequency-multiplier extension used at the reader. Regardless, the employment of time-gating allows for the separation of the cavities' response from the rest of the backscattered signals. In Fig. 29, the time-gated reflection coefficients are presented, where it is noticeable that the main difference again is the dynamic range on the measurements. In Fig. 29(a) the two peaks at 30 cm are clearly distinguished, in (b) there are multiple others encroaching on the operating bandwidth, which make it difficult for proper detection. Regardless, the identification of the peaks at 237.6 and 244.3 GHz is successful.
Time-gated frequency response for different separations from the reader when empty room measurement is subtracted (a) and raw data, i.e., no subtraction is performed (b).

In light of the above, the subtraction of the empty room measurement has a significant impact in the achievable range for detection and identification of the retroreflective tags, as a decrease of 10 dB in the noise floor implies that the achievable range is increased 77%. When this measurement is not available, and with the objective of increasing the distance at which the tags can be detected, conventional solutions in radar systems such as averaging to decrease noise levels or higher transmitting power apply. Finally, the retroreflective tag size also plays a role. The bigger the tag is, the larger RCS it presents and thus the larger maximum range that can be achieved.
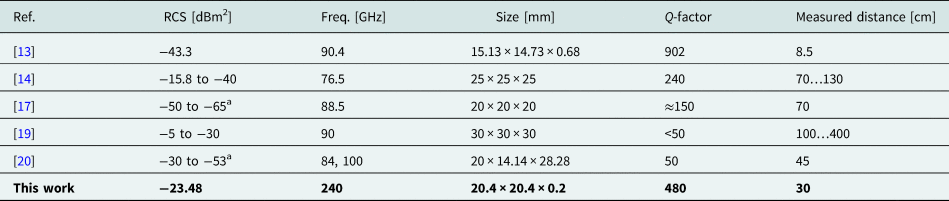
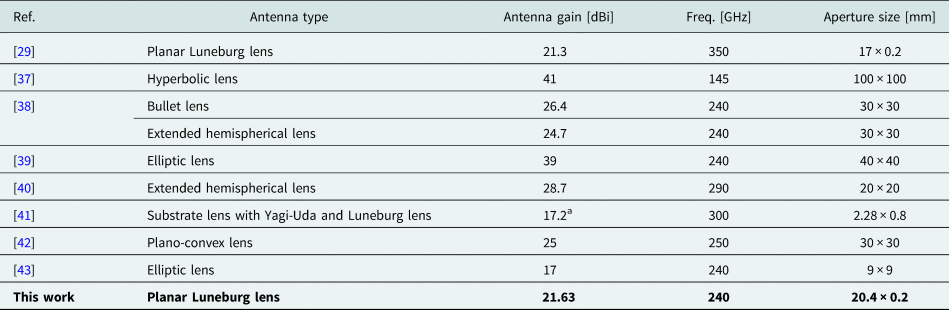
The current state-of-the-art resonant chipless sub-THz frequency-coded retroreflectors are summarized in Table 2. This work represents a passive frequency-coded retroreflector realized at the highest frequency with high-Q factor among the other related works. Although the fabrication process of the designed planar Luneburg lens antenna is not trivial, the antenna achieves relatively high gain at the designed frequency while the aperture size is being minimized. The comparison of sub-THz lens antennas is presented in Table 3.
Comparison of resonant chipless wireless frequency-coded sub-THz retroreflectors

a This value corresponds to the S 11 because RCS value is not given.
Comparison of sub-THz lens antennas

a This value corresponds to the simulated value.
Conclusion
In this paper, we presented a frequency-coded chipless retroreflective tag for indoor localization at 240 GHz manufactured in HR-Si. The tag is formed by the combination of a Luneburg lens antenna and a PhC-based reflective layer, with embedded high-Q resonators, for ranging and identification. The realized gain of the Luneburg lens antenna at designed frequency 240 GHz is 21.63 dBi and the monostatic RCS level of the frequency-coded identification landmark is −23.48 dBm2 at 240 GHz. By using this lens with nine repetitions of a basic two high-Q resonator PhC-based reflective layers at the backside, the maximum readout distance of 0.3 m at 237 GHz was achieved with a 21 dBi gain horn antenna as the reader. The Q-factors of the PhC resonators are 480 and 435. Moreover, a wide angular range of ±65° in azimuthal plane was demonstrated for ranging applications, whereas the tag also presented a discontinuous but repeatable response each 15 degrees for two-resonance identification. The performance of the retroreflective tag when there are obstacles in the direct LoS between it and radar reader is briefly addressed. Finally, it is shown that, if an empty room subtraction is possible, the signal to interference ratio is decreased by 10 dB, which implies an increase of 77% of the maximum tag's readout range. Further possibilities to increase the readout distance include monostatic radar readers with better dynamic ranges. Alternatively, employing bigger Luneburg lenses increases the tag's RCS and therefore the range, as well as allowing for more repetitions of the PhC coding particles for wide angle identification. Future development of our work can be focused on the development of a wide-angle quasi-conformal transformation optics-based lens [Reference Amarasinghe, Mendis, Shrestha, Guerboukha, Taiber, Koch and Mittleman44], or a metasurface-based reflecting lens [Reference Bilitos, Ruiz-García, Sauleau, Martini, Maci and González-Ovejero45] to increase the maximum detection angle of the retroreflective tag. In addition, other retroreflective layer topologies should be considered to increase the angular range for the identification part, such as a modification of the 3-bit tag presented in [Reference Burmeister, Jiménez-Sáez, Sakaki, Schüßler, Sánchez-Pastor, Benson and Jakoby46].
Acknowledgement
The authors are thankful for the support provided by the Internal Grant Agency of Brno University of Technology, project no. FEKT-S-20-6526. This work was funded by the Deutsche Forschungsgemeinschaft (DFG, German Research Foundation) – Project-ID 287022738, projects C09 and C12.
Conflict of interest
None.
 Petr Kadera was born in Čeladná, Czech Republic, in 1994. He received the M.Sc. degree in electronics and communications from the Brno University of Technology, Czech Republic, in 2018, where he is currently pursuing the Ph.D. degree with the Department of Radio Electronics. His current research interests include 3D printing, artificial dielectrics, lens antennas, material characterization and transformation optics in microwave and millimeter-wave frequencies. In 2020 and 2021, he has been a visiting Ph.D. student at TU Darmstadt in Germany, and at KTH Royal Institute of Technology in Sweden.
 Jesús Sánchez-Pastor received the double master's degree in telecommunications engineering from the Polytechnic University of Valencia, Spain, and in information and communication engineering from the Technische Universität Darmstadt, Germany, in 2020. He is currently pursuing the Ph.D. degree with the Institute of Microwave Engineering and Photonics, TU Darmstadt. His current research interests include chipless RFID applied to indoor localization and sensing, high-Q photonic crystal cavities, and frequency-selective surfaces.
 Lisa Schmitt received the M.S. degree in industrial engineering from Technische Universität Ilmenau, Germany in 2018. From 2018 to 2019, she worked as a Research Assistant at Technische Universität Dortmund, Germany at the Department of Material Test Engineering. Since 2019, she continues her research at Ruhr Universität Bochum, Germany, with focus on MEMS actuators for large displacements to be integrated in THz systems.
 Martin Schüßler received the Dipl.Ing. and Ph.D. degrees from the Technische Universität Darmstadt, Germany, in 1992 and 1998, respectively, where he has been a Staff Member of the Institute for Microwave Engineering and Photonics, since 1998. During his career, he worked in the fields of III-V semiconductor technology, microwave sensors for industrial applications, RFID, and small antennas. His current research interests include microwave biosensors and passive chipless RFID.
 Rolf Jakoby was born in Kinheim, Germany, in 1958. He received the Dipl.Ing. and Dr.Ing. degrees in electrical engineering from the University of Siegen, Germany, in 1985 and 1990, respectively. In 1991, he joined the Research Center of Deutsche Telekom, Darmstadt, Germany. Since 1997, he has been a Full Professor with the Technische Universität Darmstadt. He is a Co-Founder of ALCAN Systems GmbH, author of more than 320 publications and holds 20 patents. His current research interests include tunable passive microwave devices, beam-steering antennas, chipless RFID sensor tags and biomedical applicators, using metamaterial, ferroelectric, and liquid crystal technologies. He received an award from CCI Siegen for his excellent Ph.D., in 1992 and the ITG-Prize, in 1997 for an excellent publication in the IEEE AP Transactions. He was the Chairman of the EuMC in 2007 and GeMiC in 2011. He is Editor-in-Chief of FREQUENZ, DeGruyter, and member of VDE/ITG and of IEEE/MTT/AP societies.
 Martin Hoffmann received his Ph.D. in 1996 at Uni Dortmund. After years in academic research and industry he joined Technische Universität Ilmenau and took over the Chair for Micromechanical Systems. In 2017, he moved to Ruhr-Universität Bochum and heads now the Chair for Microsystems Technology. His key interests are actuators and passive sensor systems based on micromechanics.
 Alejandro Jiménez-Sáez received the double master's degree (Hons.) in telecommunications engineering from the Polytechnic University of Valencia, Spain, and in electrical engineering from the Technische Universität Darmstadt, Germany, in 2017. He received the Dr.-Ing. degree (summa cum laude) from the TU Darmstadt in 2021, and the award Freunde der TU Darmstadt to the best dissertation in Elektrotechnik und Informationstechnik at TU Darmstadt in 2021. He currently leads the Smart RF Systems based on Artificial and Functional Materials research group at the Institute of Microwave Engineering and Photonics, TU Darmstadt. His current research interests include chipless RFID, high-Q resonators, electromagnetic bandgap structures, liquid crystals, and reconfigurable intelligent surfaces at sub-mm and mm-wave frequencies.
 Jaroslav Lacik received the M.Sc. and Ph.D. degrees from Brno University of Technology, Brno, Czech Republic, in 2002 and 2007, respectively. He is currently an Associate Professor at Brno University of Technology. His research interests are antennas, body-centric wireless communication, computational electromagnetics, and measurement.