Implications
Three sex types of pigs have been studied in detail: females (FE), entire males (EM) and castrated males (CM). However, immunocastration is becoming common in some countries and growth patterns of these animals have not been well characterised. Nutrition companies segment growth into several (3, 4 or 5) market lines, periods and diets but, generally, do not differentiate diets among sex types in growing pigs. Different diets specific to growth period and sex types could improve performance, efficiency and minimise residues and costs. Moreover, knowledge about mature BW (MBW) informs estimates of potential protein deposition and, consequently may add value to the meat chain.
Introduction
Pig growth results from a multitude of biological processes. The age, genotype and sex type of an animal (EM, CM, immunocastrated males (IM or FE) determines the maximum level at which these processes can occur, whereas environmental factors such as nutrition and health status determine the degree to which genetic potential is expressed. Growth functions have been extensively used to describe the size v. age relationship in pigs, and many functions are presented in the literature, including polynomials (Knap, 2000; Wellock et al., Reference Wellock, Emmans and Kyriazakis2004). Most of these functions are available for the description of growth such as Brody’s, logistic, Gompertz, von Bertalanffy and the four-parameter Richards function, which combines aspects of all the above growth functions into one. Schinckel et al. (Reference Schinckel, Mahan, Wiseman and Einstein2008) compared growth curves of different sex types from light to heavy weights. However, very few studies have included the immunocastrated pig (Fàbrega et al., Reference Fàbrega, Velarde, Cros, Gispert, Suárez, Tibau and Soler2010; Gispert et al., 2010). It is of interest to include immunocastrated pigs because they are different from EM and from surgically castrated. Immunocastrated productive traits and fat thickness are more similar to EM until the second dose of the vaccine when they behave as castrated pigs (Fàbrega et al., Reference Fàbrega, Velarde, Cros, Gispert, Suárez, Tibau and Soler2010; Batorek et al., Reference Batorek, Čandek-Potokar, Bonneau and Van Milgen2012). To provide a complete picture of the impacts of immunocastration of pigs for retailers and consumers, and to understand whether this is a viable production practice, it is necessary to know the growth performance and body composition of immunocastrated pigs relative to other sex types over time. Computed tomography (CT) is a non-invasive technology that enables the study of the body composition of live animals during growth (Kolstad, Reference Kolstad2001; Font-i-Furnols et al., Reference Font-i-Furnols, Carabús, Pomar and Gispert2014). Moreover, with the use of validated equations it is possible to know the weights of different cuts or tissues at different live weights without the necessity of slaughter and dissection. This tool allows the study of growth performance and body composition at the same time. The aims of the present study were (1) to evaluate variation in the body composition of four sex types (SEX) at 30, 70, 100 and 120 kg of live weight; (2) to model the allometric growth of the total body fat and lean, the four main cuts and composition of the ham; and (3) to estimate the MBW of the four sex types and study the relationships between the growth models and the MBW.
Material and methods
Animals and experimental design
In total, 48 piglets were moved from a commercial farm with high health status to the weaning unit at IRTA-Monells at a mean age of 21 days. The piglets were crosses between Duroc×Landrace hybrid sows and recessive homozygous (nn) Pietrain boars, all of them from the same company, and of different SEX: 12 each of FE, EM, CM and IM. Immunocastration was performed by administering the immune-vaccine Improvac® (Zoetis, Alcobendas, Madrid, Spain), which contains 200 μg GnRH–protein conjugate/ml in an aqueous adjuvant system, was administered twice by technical staff in accordance with the manufacturer’s instructions. Each pig in the IM group was injected with 2 ml subcutaneously just behind and below the base of the ear, at 12 and 18 weeks of age. All the pigs were fed a commercial diet on an ad libitum basis (two-phase feeding programme containing 10.24 and 10.08 MJ net energy/kg, 18.00% and 17.02% CP and 0.91% and 0.90% digestible lysine, respectively). Pigs were weighed weekly and CT scanned at 30, 70, 100 and 120 kg target BW (TBW).
Computed tomography
Animals were fully scanned with a General Electric HiSpeed Zx/I tomograph, located in IRTA-Monells (Catalonia, Spain), and the instrumental settings were as follows: 140 kV, 145 mA, matrix 512×512, axial, 7-mm thick (30 kg TBW) and 10-mm thick (70, 100 and 120 kg TBW). Custom-built half-tube cradles (PVC; Ø 0.30 m, length: 1.2 m for 30 kg pigs and Ø 0.46 m, length: 1.8 m for 70, 100 and 120 kg pigs) were used to hold pigs in the prone position during scanning. Pigs had free access to water but not feed for a minimum of 8 h before weighing and scanning. Animals were sedated and anaesthetised intramuscularly with azaperon (0.1 mg/kg BW), ketamine (0.2 mg/kg BW) and propofol (0.22 mg/kg BW, intravenously in the ear) to minimise disturbances in the CT images due to movement. Intravenous sedation was only used at 100 and 120 kg TBW. One animal from the EM group died during the procedure, and was not replaced. After scanning, the animals were returned to the IRTA experimental farm until their last scan, at which time the experiment was concluded. All procedures were approved by the ethics committee of IRTA.
Image analysis
Image analysis was split into linear, area and volume measurements, and were carried out using the VisualPork software, developed by the Universitat de Girona and IRTA (Boada et al., Reference Boada, Spinola, Rodriguez, Martínez and Font-i-Furnols2009; Bardera et al., Reference Bardera, Martίnez, Boada, Font-i-Furnols and Gispert2012). Measurements similar to the ones used by Carabús et al. (Reference Carabús, Gispert, Brun, Rodríguez and Font-i-Furnols2014) were obtained manually from different tomograms, and are graphically visualised in Figure 1. More detailed information about the measures can be found in Supplementary Table S1.
Anatomical measurements obtained by computed tomography from the (a) shoulder (A=central subcutaneous fat thickness; B=area), (b) different tomograms of the loin (C=central subcutaneous fat thickness; D=lateral subcutaneous fat thickness; E=loin area) and (c) ham (F=central subcutaneous fat thickness; G=lateral fat thickness; H=area of the ham) of live pigs.

Volume measurements required the use of all scanning images for each animal. Volumes of fat, lean and bone were obtained as the sums of voxels with Hounsfield unit (HU) values between −149 and 0, 1 and 150, and 151 and 1400, respectively (Font-i-Furnols et al., Reference Font-i-Furnols, Carabús, Pomar and Gispert2014).
Predictions and parameters modelled
Prediction equations developed by Carabús et al. (Reference Carabús, Sainz, Oltjen, Gispert and Font-i-Furnols2015) were used to determine the growth of the weights of fat and lean of the four main cuts (ham, shoulder, loin, belly and for lean also tenderloin), the weights of shoulder, belly, loin and the subcutaneous fat of the loin as well as the weight of ham and its amount of subcutaneous fat, lean and bone.
Allometric growth
The allometric equation was chosen to model the growth of the selected variables. In 1891, Snell first fit it as follows, described in Gould (Reference Gould1971):
 $$Y\,{\equals}\,aX^{b} $$
For parameter estimation, the equation was linearised as follows:
 $$\log Y\,{\equals}\,\log a{\plus}b{\times}\log X$$
where Y is the weight of the tissue and X the live weight or the weight of the cut, depending of the variable analysed; a an intercept and b the allometric growth coefficient that describes the relationship between the two body constituents. A unity of the allometric growth is assumed if b=1; then, Y grows at the same proportional rate as X; if b>1, Y grows proportionately faster than X, and the opposite is true if b<1. Snell’s power function was extended by Huxley in the 1930s (Huxley, Reference Huxley1932) and 1950s (Huxley, Reference Huxley1950) to the wide range of phenomena that encompass differential or allometric growth. The interpretation of b as the ratio of specific growth rates of y/x is widely accepted, but the meaning of the coefficient a has generated a large and inconclusive literature (Gould, Reference Gould1971).
Estimation of mature BW
The MBW of each group of pigs was obtained using the Gompertz equation (Gompertz, Reference Gompertz1825):
 $$Y\,\left( t \right)\,{\equals}\,a.\,e^{{\left( {{\minus}be} \right)^{{\left( {kt} \right)}} }} $$
where Y is the BW, t the time period (expressed in days in the present study), a an asymptote equivalent to MBW, b sets the displacement along the x axis (time; translates the graph to the left or right), k sets the growth rate (y scaling) and e the Euler’s number.
The function is simple, sigmoidal in shape and fits a range of growth data well (Kyriazakis et al., Reference Kyriazakis and Emmans1991; Ferguson et al., Reference Ferguson, Gous and Emmans1994). It adequately describes the more rapid growth in the early stages of life and the decline in growth in the later stages. The parameters are empirically derived, but may have biological meaning attributed to them, such that comparisons can be made between different animals of different SEX.
Statistical analysis
Statistical analyses was performed using SAS software (SAS, 2001). A mixed procedure including repeated measures was used to determine whether significant phenotypic differences existed among the four SEX. The model included SEX, TBW and their interaction as fixed effects. The covariance matrix type used in the model was selected for each variable, so as to present the lowest values of Akaike’s information criterion (AIC) and the corrected AIC. Tukey’s test was used to compare the least-squared mean values at the 0.05 significance level.
To test the allometric coefficients for each SEX, a MIXED procedure was applied, including SEX as a fixed effect, the natural log of BW as the covariate within SEX, and the repeated subject was the animal. Tukey’s test was used to compare the least-square mean values at the 0.05 significance level.
A three-stage procedure was adopted for the estimation of MBW. Initially, it was necessary to establish biological minimum and maximum values for the parameters a, b and k from the literature (Ibáñez-Escriche and Blasco, Reference Ibáñez-Escriche and Blasco2011; Vincek et al., 2012), forcing the MBW estimates to fall between these two values of a. Then the NLIN procedure was applied to fit the Gompertz equation, using ID as a repeated measure. Once an average MBW (parameter a) and consequently parameters b and k were obtained for each SEX, the average group b and k values were used to find the individual MBW for each animal. To study the relationships between the allometric models and the MBW a MIXED procedure was used, using %MBW (100×BW/MBW) as a covariate. The selected variables were studied as a percentage of the total weight of the four main cuts and the BW was presented as a percentage of the MBW at scanning.
Results and discussion
Measurements obtained by computed tomography
Volumes of fat, lean and bone, for each SEX, and the effect of TBW are presented in Table 1. For the conditions of the present experiment and the HU distribution used (Font-i-Furnols et al., Reference Font-i-Furnols, Carabús, Pomar and Gispert2014), the effects SEX and TBW were significant (P<0.001).
Volumes of lean, fat and bone and target BW (TBW) of castrated male (CM), female (FE), immunocastrated male (IM) and entire male (EM) pigs

Lean=volume of lean (dm3) calculated using Hounsfield unit (HU) distribution between 1 and 150; Fat=volume of fat (dm3) calculated using HU distribution between −149 and 0; Bone=volume of bone (dm3) calculated using HU distribution between 151 and 1400.
a,b,cWithin a row indicate significant differences (P<0.05).
The double interaction was significant only for the volume of fat and lean. At the heaviest weight, IM and FE presented a similar volume of fat and lean. Moreover, at the same weight, EM and CM had the greatest and least volume of lean, respectively, the opposite was true for the volume of fat. For bone, the SEX effect revealed two clearly differentiated groups, with greater volumes (P<0.05) of bone in EM and IM compared with FE and CM.
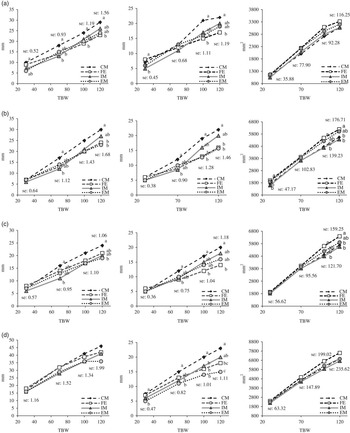
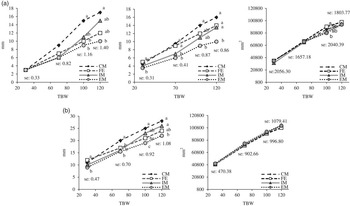
The linear and area measurements obtained from the CT images are shown in Figure 2 for the different loin images and in Figure 3 for the ham and the shoulder. As expected, the TBW effect was significant (P<0.001) for all of the linear and area measurements (results not shown), and the SEX effect was significant in some of them (see Figure 2) as well as the interaction SEX×TBW, indicating that the differences among the SEX are not constant at all the TBW values, but are TBW dependent.
Vertical subcutaneous fat (left), lateral subcutaneous fat (centre) and area of the loin (right) evaluated from computed tomography images of the loin at the level (a) between 6th and 7th ribs, (b) between 11th and 12th ribs, (c) between 14th and 15th ribs and (d) between 3rd and 4th lumbar vertebrae, by target BW (TBW) and sex (castrated male (CM), female (FE), immunocastrated male (IM) and entire male (EM) pigs). a,bIndicate significant differences (P<0.05) between SEX by TBW.

(a) Vertical subcutaneous fat (left), lateral subcutaneous fat (centre) and area (right) of the ham and (b) vertical subcutaneous fat (left) and area (right) of the shoulder, evaluated from computed tomography images by BW (TBW) and sex (castrated male (CM), female (FE), immunocastrated male (IM) and entire male (EM) pigs). a,bWithin a row indicate significant differences (P<0.05) between SEX by TBW.

Loin
Significant (P<0.05) effects of SEX and its interaction with TBW existed for the majority of the variables analysed at the four anatomical parts of the loin. A significant SEX effect appeared at the 3rd and 4th lumbar vertebrae (LV) for the vertical subcutaneous fat, where CM presented more fat than IM and EM, and FE were intermediate. However, at early weights (30 kg), vertical subcutaneous fat did not present significant differences at the 11th and 12th, 14th and 15th ribs, but this situation changed for the other points evaluated in the loin. Castrated males appeared to have thicker lateral and vertical subcutaneous fat all over the loin, compared with other SEX. At 70 kg, IM had not yet received the second immunocastration dose and they showed less fat than CM at the four locations of the loin, however, this situation varied at heavier weights (100 and 120 kg). For the lateral and vertical subcutaneous fat at the 6th and 7th ribs, CM presented higher values (P<0.05) of fat than FE, with IM and EM being intermediate. A similar situation occurred for the lateral subcutaneous fat at the 14th and 15th rib, however, it changed at the 3rd and 4th LV. At that point of the loin, at 100 kg TBW, CM had more lateral subcutaneous fat than FE, IM and EM but not at 120 kg TBW. At the heaviest weight, CM had greater lateral subcutaneous fat than IM and EM. Females had more fat than EM and similar amount as CM and IM, and the IM had the same behaviour as the EM. Fàbrega et al. (Reference Fàbrega, Velarde, Cros, Gispert, Suárez, Tibau and Soler2010) reported that at final weights between 109 and 123 kg, IM and CM presented more (P<0.05) subcutaneous fat than EM and FE. D’Souza and Mullan (2002) presented differences for the backfat at the P2 level (close to the 14th and 15th rib), where IM>CM>FE (P<0.05). In the present study, CM were fatter (P<0.05) than EM at the last rib (14th and 15th), whereas IM and FE were intermediate. The loin muscle area presented significant SEX×TBW interactions at the 11th and 12th and 14th and 15th ribs (P<0.05). In both cases, at 100 and 120 kg TBW, loin muscle areas were greatest (P<0.05) in FE than in CM and IM, and EM were intermediate (P>0.05). These results are in accordance with McLaren et al. (Reference McLaren, McKeith and Novakofski1988), who compared the loin muscle area at the 10th rib between gilts and barrows of the same genetic type. In the present study, the loin muscle area at the 6th and 7th ribs did not present significant SEX or SEX×TBW effects, however, at the 3rd and 4th LV FE had larger loin muscles than IM and CM and EM were intermediate.
Ham
Significant interactions between SEX and TBW effects were found for the area of the ham, as well as for its vertical and lateral subcutaneous fat (Figure 3). The lateral fat of the ham differed among SEX throughout the growth period, whereas differences for the area were visible only at 100 kg TBW. At 120 kg TBW, differences in ham area among sexes were not significant although the same tendency can be observed. At 30 kg, FE presented more lateral fat (P<0.05) than EM and IM, and CM were intermediate. From 70 to 100 kg, two differentiated conditions were visible: CM and FE had more lateral fat than IM and EM (P<0.05). However, by 100 kg (after the second immunocastration dose), IM pigs increased lateral fat and presented thickness similar to CM and FE. At 120 kg, positions were clearly differentiated, with the lowest values (P<0.05) of lateral fat in EM compared with CM, FE and IM, which did not differ (P>0.05). At 120 kg, vertical subcutaneous fat presented less differentiation among SEX, with CM being fatter than EM (P<0.05) and FE and IM in between. This confirms and extends the findings of Latorre et al. (Reference Latorre, Lázaro, Gracia, Nieto and Mateos2003) that at 117 kg, CM presented higher amount (P<0.05) of subcutaneous fat than FE (19.5 v. 17.3 mm).
Shoulder
A significant SEX effect was found for the area of the shoulder, being greatest in EM and least in FE (Figure 3). A significant interaction between SEX and TBW was found for the vertical subcutaneous fat of the shoulder, which was greatest in CM and least in EM. Immunocastrated males also showed greater values (P<0.05) of subcutaneous fat than EM, but only at heavier weights (100 and 120 kg), probably due to the second vaccine.
Allometric growth
The least-squares means and differences obtained for the compositions of the carcass and main piece are shown in Supplementary Table S2. The TBW effect was significantly different (P<0.001) for most of the parameters, and the interaction between SEX and TBW also presented significant differences.
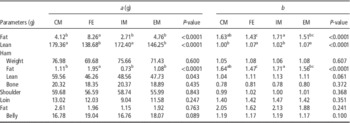
The allometric coefficients for the weights of the main pieces and the lean mass and fat content in relation to the live weight are represented in Table 2.
Allometric growth of the main tissues and cuts in relation to the live weight of castrated male (CM), female (FE), immunocastrated male (IM) and entire male (EM) pigs

a=scaling exponent; b=allometric growth coefficient.
a,b,cWithin a row and coefficients indicate significant differences (P<0.05).
Significant differences among SEX were found for the total amounts of fat and lean and for the fat and lean contents in the ham.
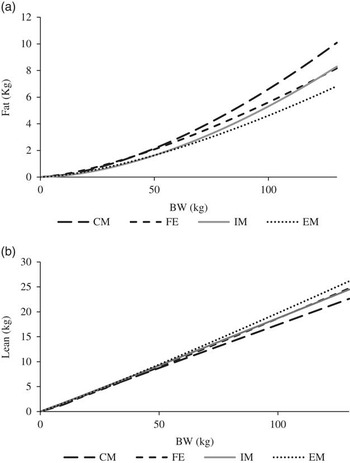
The allometric growth coefficient (b) for total fat tissue was >1, indicating a proportionately faster development of fat in relation to the live weight. Figure 4a illustrates total body fat deposition in relation to TBW, allowing visualisation of the more rapid deposition of fat in IM than in EM, probably due to the second vaccine (after 70 kg TBW). Castrated males were intermediate between IM and EM, as were EM between CM and FE (Table 2). A different situation was found for the deposition of the lean mass (Figure 4b), with values close to unity, indicating a proportional growth rate similar to live weight. Lean tissue development was similar in FE and EM (P>0.05), both faster than in CM and IM. It is also possible to see the change of tendency in IM curve after the second vaccine.
Allometric growth of the (a) fat tissue and (b) lean tissue of castrated male (CM), female (FE), immunocastrated male (IM) and entire male (EM) pigs related to BW.

Although no significant differences among SEX were found for the allometric growth of the main cut weights, the values are worth noting. The ham and the shoulder weights presented similar results as the total lean, with b coefficients close to unity, showing a parallel development of the cut/tissue with the live weight. By contrast, the loin cut presented higher values of the b coefficient, more similar with the fat values, indicating faster and later development than the other cuts. The belly was intermediate, indicating that it grows faster than the ham and the shoulder and slower than the loin in relation to the live weight. The bones of the ham were the only tissue that presented b coefficients lower than unity, indicating that this tissue grows earlier and slower than the others relative to live weight. These results are in accordance with Fisher et al. (Reference Fisher, Green, Whittemore, Wood and Schofield2003), who presented detailed results of the allometric coefficients (a and b) of fat (split into subcutaneous and intermuscular), skin, lean, bone and different cuts of swine.
Estimation of mature BW and its relationship to the growth model
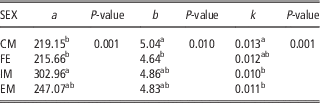
Parameters of growth functions calculated for the pigs of different SEX are shown in Table 3. Figure 5 presents the resulting growth curves for CM, FE, IM and EM.
Comparison of the body growth of castrated male (CM), female (FE), immunocastrated male (IM) and entire male (EM) pigs by the Gompertz function from 0 to 350 kg.

Parameters of the Gompertz function of castrated male (CM), female (FE), immunocastrated male (IM) and entire male (EM) pigs

a=an asymptote with the biological meaning of the mature BW; b=sets the displacement along the x axis; k=sets the growth rate (y scaling).
a,bWithin a column indicate significant differences (P<0.05).
Significant differences among SEX were found for the three parameters of the Gompertz function (a, b and k). Estimated mature weight (MBW) was greatest in IM, lowest in CM and FE and intermediate in EM. However, Vincek et al. (2012) estimated final weights of 233 kg for barrows and 180 kg for gilts, using a sigmoidal function. Literature values of the final live weights indicate differences between breeds (Wellock et al., Reference Wellock, Emmans and Kyriazakis2004), sex types and the prediction equations (Strathe et al., 2009). Strathe et al. (2009) reported MBW of 406, 471 and 354 kg for barrows, boars and gilts, respectively. These estimates are much larger than the present results and the ones previously reported by Knap (2000), which was partly due to the duration of the experimental period. Strathe et al. (2009) caution that when growth data below 200 kg BW are analysed by sigmoid growth functions, asymptotic values are unreliable. To our knowledge, the final weight (biological maximum) of IM have not been reported, therefore we attempted to estimate this parameter. In this study, the Gompertz curve fit the data very well from 0 to 150 days for all SEX (Figure 5) but seemed to overestimate live weights after that point, especially for IM. One mathematical reason that could explain these results is the lack of observed weights above 120 kg, thus the earlier points of the curve acquire more importance for the fitting of the Gompertz curve. Real weights after 120 kg (170 days approximately) showed a low decrease of the slope and the very initial part of the asymptote for the EM, FE and CM, but this change was not visible for the IM. Furthermore, for the EM, FE and CM, this small decrease of the slope was shown by only two points of the graph (Figure 5). Therefore, it was impossible to determine the mature weight from these data with any degree of confidence.
With regard to growth rate (k coefficient), CM had more rapid weight gain (P<0.05) than EM and IM over the entire growth period. However, IM presented a significant gradual increase of the slope after 130 days (80 kg approximately). This change is more noticeable at 150 days (100 kg approximately), the moment that the IM reaches the FE growth rate. The second immunocastration vaccine was injected at 18 weeks (126 days); the growth rates for EM and IM were very similar from 0 to 130 days, and then the slopes diverged. These results suggest that the full effects of immunocastration are obtained only after the second injection of the vaccine. Jaros et al. (Reference Jaros, Burgi, Stärk, Claurs, Hennessy and Thun2005) suggested that the effect of the immunocastration is visible after the second injection and before reaching that point IM have the same behaviour as EM. As suggested by previous studies, pigs vaccinated with Improvac® may be regarded as EM until the second vaccination (Dunshea et al., Reference Dunshea, Colantoni, Howard, McCauley, Jackson, Long, Lopaticki, Nugent, Simons, Walker and Hennessy2001), which is consistent with results of the present study.
Allometric growth of fat and lean in the whole body and in the ham were significantly different among SEX. A statistical model, including the SEX and %MBW effect, was applied to determine if the allometric differences could be explained by differences in estimated MBW. However, significant SEX effects (P<0.05; results not shown) remained after MBW correction, indicating that the differences in allometric growth were not due to differences in MBW. As the MBW estimates were suspect, we cannot draw firm conclusions regarding the role of MBW in allometric growth differences among SEX.
General discussion
Improving production system efficiency in the swine industry requires knowledge of the growth performance and development of the main cuts and tissues of all animal categories. For swine, three main sex types (FE, EM and CM) have been considered in the past. Castrated males is used to avoid the boar taint and to increase the amount of fat, however, in some countries, the use of IM is now becoming very common, thus necessitating studies of IM growth and body composition in relation to the other SEX. The main difference between the CM and the IM is the type of castration. For the first group it is a surgical castration, whereas for the second group, the castration is performed by a vaccine. This difference has implications in animal welfare and also in carcass characteristics, because, as expected, there are differences in the amount of fat tissue deposition and carcass characteristics (Gispert et al., 2010; Batorek et al., Reference Batorek, Čandek-Potokar, Bonneau and Van Milgen2012). That is the reason why the CM and IM are considered different sex types and are known as the third and the fourth sex in the animal livestock production. The results from this study reveal that there are significant phenotypic differences in the growth of fat and lean among SEX, with CM being fattest and EM being leanest. These differences were not related to estimated MBW, however, MBW may have been overestimated, especially for IM. This overestimation is due a lack of data of animals at higher weights. The predicted MBW for IM was also conditioned by the fact that this group of animals presented two clear phases, being similar to EM from birth to the second injection of the vaccine (average of 80 kg) and more comparable with CM from that point to the final weight. This change was reflected in an increase of the slope of the Gompertz curve, resulting in higher values for MBW.
Resolution of these differences will require analysis of growth curves with data at heavier weights, and could potentially yield valuable biological insights into growth of swine of different sex types.
Conclusions
In general, we conclude that fat deposition was proportionately most rapid in IM and CM and least rapid in EM and FE, and lean deposition behaved inversely. Thus, IM and CM have a very similar performance regarding the speed of deposition of lean and fat, although IM behave as EM until the second vaccine administration. Nutrition companies segment pig growth into several (3, 4 or 5) periods and diets, but generally do not differentiate diets among sex types. According to the results of this study, diets specific to the growth period and also sex type could improve growth and efficiency and minimise residues and cost of feeding. Furthermore, the use of non-invasive techniques, such as CT, can be useful for the livestock and meat industry because growth and carcass parameters can be studied in vivo without costly and labourious slaughter and dissection. However, more research at heavier weights is needed to accurately determine MBW and its relationship to allometric growth of cuts and tissues.
Acknowledgements
The present study was supported by the Instituto Nacional Investigaciones Agrarias (INIA) (Evaluación in vivo del crecimiento alométrico de los tejidos muscular y adiposo de los cerdos según la genética y el sexo mediante tomografía computerizada. RTA2010-00014-00-00). INIA is also thanked for the scholarship to A.C. The authors wish to thank Albert Brun, Carles Francàs, Cecilia Pedernera, Albert Rossell and Agustí Quintana for their invaluable technical assistance.
Supplementary material
To view supplementary material for this article, please visit https:/doi.org/10.1017/S1751731117000039