1. Introduction
Detonation is characterised by the coupling between a shock wave and chemical reaction (Lee Reference Lee2008; Shepherd Reference Shepherd2009). Detonation engines are expected to have higher thermal efficiency than engines based on deflagration since the combustion in detonation engines is nearly constant volume (Wolański Reference Wolański2013). Moreover, detonation exhibits a rapid heat release rate and has the ability to self-pressurise (Wolański Reference Wolański2013). Consequently, a detonation engine has significant promise for advanced propulsion (Roy et al. Reference Roy, Frolov, Borisov and Netzer2004; Zhou, Wu & Wang Reference Zhou, Wu and Wang2016; Rankin et al. Reference Rankin, Fotia, Naples, Stevens, Hoke, Kaemming, Theuerkauf and Schauer2017; Jiang Reference Jiang2023).
Detonation initiation is fundamental to its practical application; and it is important to efficiently initiate detonation waves to achieve optimal performance (Liu Reference Liu2012; Jiang & Teng Reference Jiang and Teng2022). There are two primary methods for detonation initiation: indirect and direct initiation (Liu Reference Liu2012). Indirect initiation involves the deflagration-to-detonation transition, which requires lower initiation energy but results in a longer initiation distance (Xiao & Oran Reference Xiao and Oran2020; Ballossier, Virot & Melguizo-Gavilanes Reference Ballossier, Virot and Melguizo-Gavilanes2023). In contrast, direct initiation has the advantage of a shorter initiation distance, albeit at the expense of higher ignition energy requirements to directly induce detonation waves. Therefore, direct initiation places stringent demands on initiation devices and may potentially cause damage to equipment (Ng & Lee Reference Ng and Lee2003; Liu Reference Liu2012). The critical detonation initiation energy, denoted as E C , represents the minimum amount of energy required to achieve successful direct detonation initiation (Lee Reference Lee1984; Lee & Higgins Reference Lee and Higgins1999). However, determining the critical detonation initiation conditions still remains a fundamental challenge. Early theoretical efforts (He & Clavin Reference He and Clavin1994) examined the nonlinear effects of curvature on detonation structure and identified a critical radius below which Chapman–Jouguet (CJ) detonation solutions cannot exist. Recent asymptotic analysis (Clavin & Denet Reference Clavin and Denet2020) has provided a reduced-order model for the time-dependent shock velocity and explored the transition from transient initiation to a self-sustained CJ regime. Moreover, Clavin, Hernández Sánchez & Denet (Reference Clavin, Hernández Sánchez and Denet2021) incorporated unsteady effects and the role of rarefaction waves in the burnt gas region, demonstrating that detonation failure occurs when the sonic point in the burnt gas cannot catch up with the reaction zone. These theoretical advancements highlight the complexity of detonation initiation and the necessity of considering both quasi-steady and fully unsteady effects.
Besides, the critical initiation energy is usually very high. Therefore, reducing the critical initiation energy emerges as a significant and valuable area of research in the field of direct initiation studies (Zhang & Bai Reference Zhang and Bai2014; Vasil’ev Reference Vasil’ev2015). Several strategies have been devised to mitigate the critical initiation energy required for direct detonation initiation. For example, plasma discharge can produce active radicals and species (e.g. OH and O3), thereby facilitating detonation initiation (Starikovskiy, Aleksandrov & Rakitin Reference Starikovskiy, Aleksandrov and Rakitin2012; Vorenkamp et al. Reference Vorenkamp, Steinmetz, Chen, Mao, Starikovskiy, Kliewer and Ju2023). Sun et al. (Reference Sun, Tian and Chen2023) demonstrated that incorporating a small amount of ozone into an ethylene/oxygen/argon mixture can transform a failed detonation initiation into a successful one. Besides, the employment of converging shock waves was shown to promote detonation initiation (Jackson, Austin & Shepherd Reference Jackson, Austin and Shepherd2006). As the incident shock wave propagates through a shock focusing system, its intensity is augmented, leading to more robust reflections that can initiate detonation even with a weak incident shock wave (Bartenev et al. Reference Bartenev, Khomik, Gelfand, Grönig and Olivier2000; Jackson et al. Reference Jackson, Austin and Shepherd2006). The effectiveness of shock focusing systems in reducing critical initiation energy has been extensively verified through both experiments and numerical simulations (Smirnov et al. Reference Smirnov, Penyazkov, Sevrouk, Nikitin, Stamov and Tyurenkova2017; Utkin, Lopato & Vasil’ev Reference Utkin, Lopato and Vasil’ev2020; Li & Zhang Reference Li and Zhang2023).
Researchers have proposed that optimising the spatial distribution of input energy could also enhance the detonation initiation process (Vasil’ev Reference Vasil’ev2015). In Vasilev’s experiments (Vasilev, Nikolaev & Ul’yanitskii Reference Vasilev, Nikolaev and Ul’yanitskii1979; Vasil’ev Reference Vasil’ev2015), a cylindrical detonation wave was initiated by six circumferentially distributed hot spots at lower initial mixture pressure compared with a homogeneous circular disk initiator. This demonstrates that employing a multiple hot spot system could potentially improve detonation initiation efficiency (Zhang Reference Zhang2012). Guo et al. (Reference Guo, Zhao, Zheng, Li and Sun2019, Reference Guo, Zhao, Zheng, Sun and Yang2021) simulated the detonation initiation process induced by a dual hot spot configuration and found that wave collision is crucial for detonation initiation. Furthermore, Wang et al. (Reference Wang, Wei, Li, Pan, Huang, Zhang and Liu2020) successfully initiated detonation by using two successive ignitions along the pre-detonation tube, whereas a single ignition, despite employing larger ignition energy, failed to induce the detonation wave. More recently, Sun et al. (Reference Sun, Yang, Wang and Chen2024) have shown in simulations that multiple hot spots promote detonation initiation and reduce the critical initiation energy. They also found that the effects of hot spot number on detonation initiation are non-monotonic.
The aforementioned studies have demonstrated the potential of multiple hot spot configurations in effectively promoting detonation initiation. However, in experiments (Zhang Reference Zhang2012) it is difficult to record the detailed detonation initiation process. Moreover, previous numerical studies (Guo et al. Reference Guo, Zhao, Zheng, Li and Sun2019, Reference Guo, Zhao, Zheng, Sun and Yang2021; Sun et al. Reference Sun, Yang, Wang and Chen2024) mainly focused on the impact of hot spot states on initiation outcomes, while overlooking the influence of flow and reaction characteristics on the detonation initiation process (Guo et al. Reference Guo, Zhao, Zheng, Li and Sun2019; Sun et al. Reference Sun, Yang, Wang and Chen2024). Consequently, the detailed mechanisms and dynamics of the detonation initiation process induced by the multiple hot spot system remain poorly understood. Given the significance of the multiple hot spot system in efficiently initiating detonation, this study aims to address these knowledge gaps.
In this work, two-dimensional simulations considering detailed chemistry are conducted for the simplest multiple hot spot system, i.e. the dual hot spot configuration, in a hydrogen/oxygen/argon mixture. This work is a first step towards a better understanding of detonation initiation by multiple hot spots. The objectives are to reveal the mechanisms and pivotal factors governing the detonation initiation process. First, the effects of hot spot intensity and distance on the initiation process are evaluated, and typical initiation modes are identified and interpreted. Then, a simplified theoretical model is developed to describe the propagation of triple points caused by hot spot-induced wave collisions. Finally, the theoretical triple-point trajectories are compared with simulation results, and the initiation mechanisms are elucidated. The remainder of the paper is organised as follows. Section 2 outlines the numerical simulation model and methodology; § 3 presents and discusses the simulation results and simplified theoretical model; and § 4 concludes with a summary of findings.
2. Model and numerical methods
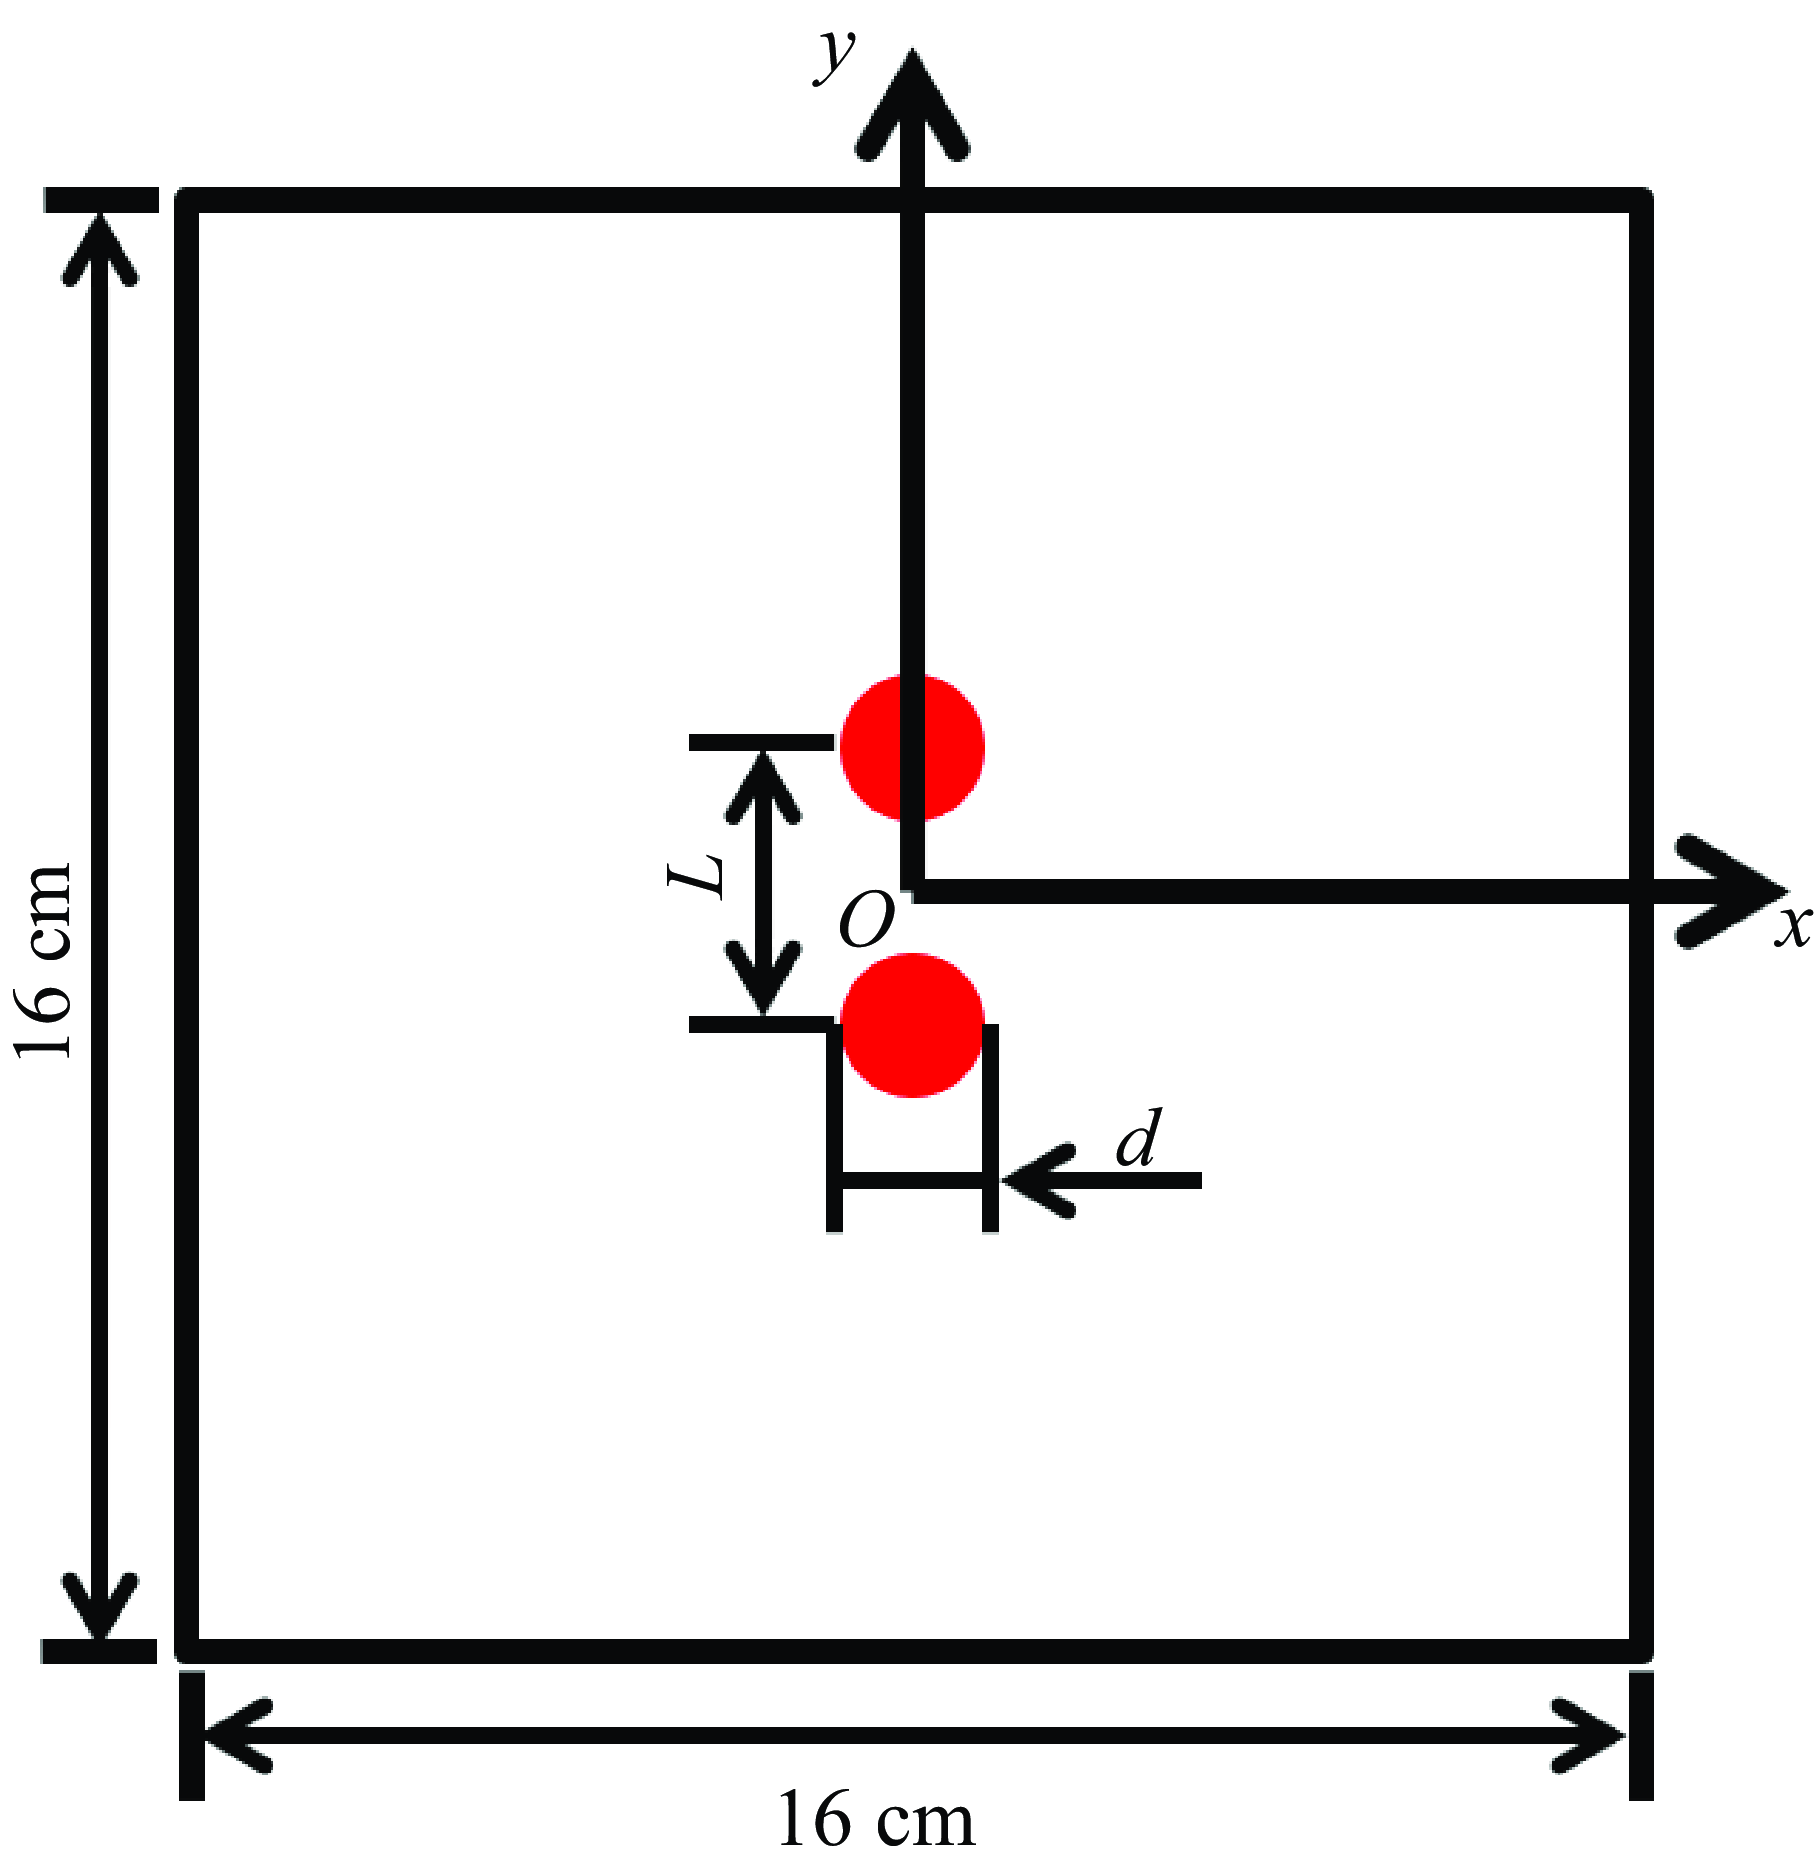
Two-dimensional simulations for the transient detonation initiation induced by dual hot spots are conducted. The computational domain is depicted in figure 1. Note that, in the two-dimensional configuration, these dual hot spots are actually uniform line ignition sources perpendicular to the x-y plane. Initially the static H2/O2/Ar mixture (XH2:XO2:X Ar = 2:1:7) is at 300 K and 0.6 atm, for which the CJ detonation speed is u CJ = 1686 m s–1. The initial hot spot temperature is fixed to be T h = 3000 K, while its pressure, P h , changes (note the initiation energy is proportional to P h ). The hot spot diameter is fixed to be d = 4 mm; while the distance between these two hot spots, L, changes for different cases. Due to the symmetry of the computational domain, a quarter of the whole domain, i.e. 0 ≤ x ≤ 8 cm and 0 ≤ y ≤ 8 cm, is considered in the simulations. Symmetric conditions are used at boundaries of x = 0 and y = 0 while supersonic outflow conditions are used at boundaries of x = 8 cm and y = 8 cm.
Schematic diagram of the computational domain.

The compressible reactive flow solver, detonationFoam (Sun et al. Reference Sun, Wang, Tian and Chen2023), is used to simulate the detonation initiation process. DetonationFoam has been validated and used in previous studies by different groups (Sun et al. Reference Sun, Yang, Tian and Chen2023; Hu et al. Reference Hu, Cheng, Zhang and Ng2024; Hu & Zhang Reference Hu and Zhang2024; Liu et al. Reference Liu, Wang, Luo and Fan2024; Yang, Zhang & Ng Reference Yang, Zhang and Ng2024). Readers are referred to Sun et al. (Reference Sun, Wang, Tian and Chen2023) for details on governing equations, numerical methods and code validation. Only a brief description is presented below. The following conservation equations for multi-component reactive flow (Poinsot & Veynante Reference Poinsot and Veynante2005) are solved in detonationFoam:
 \begin{align} &\qquad\qquad\qquad\qquad \frac{\partial \rho }{\partial t}+\nabla \cdot \left(\rho \boldsymbol{V}\right)=0, \end{align}
 \begin{align} &\qquad\qquad \frac{\partial \left(\rho \boldsymbol{V}\right)}{\partial t}+\nabla \cdot \left(\rho \boldsymbol{VV}\right)=-\nabla P+\nabla \cdot \boldsymbol{\tau }, \end{align}
 \begin{align} &\quad \frac{\partial \left(\rho E\right)}{\partial t}+\nabla \cdot \left[\left(\rho E+P\right)\boldsymbol{V}\right]=-\nabla \cdot \boldsymbol{q}+\nabla \cdot \left(\boldsymbol{V}\cdot \boldsymbol{\tau }\right), \end{align}
 \begin{align} & \frac{\partial \left(\rho Y_{i}\right)}{\partial t}+\nabla \cdot \left[\rho \left(\boldsymbol{V}+\boldsymbol{V}_{i}^{\boldsymbol{'}}\right)Y_{i}\right]=\dot{\omega }_{i}\quad i=1,\ldots, N_{S} -1 .\end{align}
Here, ρ represents the density of the mixture,
V
= (u, v) the velocity vector, E the total energy, Y
i
the mass fraction of the ith species, P the pressure,
τ
the viscous stress,
q
the heat flux,
 $\dot{\omega }_{i}$
the production rate of the ith species and N
S
the total number of all species. The viscous stress is calculated by (Poinsot & Veynante Reference Poinsot and Veynante2005)
 \begin{equation} \boldsymbol{\tau }=\mu \left[\nabla \boldsymbol{V}+\left(\nabla \boldsymbol{V}\right)^{T}-\frac{2}{3}\boldsymbol{I}\left(\nabla \cdot \boldsymbol{V}\right)\right], \end{equation}
where I is the unit tensor. The viscosity of the mixture, μ, is calculated using the Sutherland equation
 \begin{equation} \mu =\sum _{i=1}^{N_{S}}\mu _{i}Y_{i}=\sum _{i=1}^{N_{S}}\frac{A_{S\mathit{,}i}\sqrt{T}}{1+\frac{T_{S\mathit{,}i}}{T}}Y_{i}, \end{equation}
where μ i is the species viscosity coefficient and A S,i and T S,i are the coefficients of Sutherland’s model for the ith species. The inter-diffusion effect among species with different enthalpies is neglected and the heat flux is calculated by (Poinsot & Veynante Reference Poinsot and Veynante2005)
 \begin{equation} \boldsymbol{q}=k\nabla T, \end{equation}
where k is the thermal conductivity of the mixture and it is calculated based on the Eucken approximation (Poling, Prausnitz & O’connell Reference Poling, Prausnitz and O’connell2001)
 \begin{equation} k=\mu C_{V}\left(1.32+\frac{1.77R}{C_{V}}\right), \end{equation}
where C V is the volumetric specific heat capacity, and R is the mixture gas constant. The diffusion velocity, V i ’ , is calculated by (Poinsot & Veynante Reference Poinsot and Veynante2005)
 \begin{equation} \boldsymbol{V}_{i}^{\boldsymbol{'}}=-\frac{D_{\boldsymbol{m}}}{Y_{i}}\nabla Y_{i}, \end{equation}
where D m is the mixture diffusion coefficient. With a unity Lewis number assumption, D m is calculated by
 \begin{equation} D_{m}=\alpha =\frac{k}{\rho C_{P}}, \end{equation}
where α is the thermal diffusivity coefficient and C P is the mixture specific heat capacity at constant pressure. The mixture is modelled as an ideal gas using the equation of state, P = ρRT, where R is the gas constant divided by the average molecular weight of the mixture. According to Dalton’s law, the total pressure of the mixture, P, is equal to the sum of the partial pressures of each individual component gas. The sound velocity is calculated by
 \begin{equation} c=\sqrt{\gamma RT}, \end{equation}
where γ is the specific heat ratio of the mixture. Note that the expressions for sound speeds of multi-component frozen flow and an equilibrium flow can be found in Law (Reference Law2006). Here, the simplified expression, (2.11), is used.
The second-order van-Leer scheme (Leer Reference Leer1974) is utilised for variable reconstruction; and the pressure-corrected approximate Riemann solver, HLLC-P (Harten–Lax–van Leer–contact scheme with a pressure-control technique) (Xie et al. Reference Xie, Zhang, Lai and Li2018), is used to calculate the convective fluxes. The second-order central difference scheme is employed for the diffusion terms while the first-order implicit Euler scheme is used for time advance. The stiff ordinary differential equation solver seulex, which employs an extrapolation algorithm based on the linearly implicit Euler method with step size control and order selection, is adopted to handle the chemical reaction process (Hairer & Wanner Reference Hairer and Wanner1996). In this work, we consider the detailed hydrogen chemistry proposed by Ó Conaire et al. (Reference Ó Conaire, Curran, Simmie, Pitz and Westbrook2004), which consists of 10 species and 21 elementary reactions. Besides, adaptive mesh refinement (Rettenmaier et al. Reference Rettenmaier, Deising, Ouedraogo, Gjonaj, De Gersem, Bothe, Tropea and Marschall2019) and dynamic load balancing (Tekgül et al. Reference Tekgül, Peltonen, Kahila, Kaario and Vuorinen2021) are used to improve the computational efficiency.
To ensure the simulation results are grid independent, we compare the detonation initiation processes predicted by three grid sizes. The results are shown in figure 2 for three coarse grid sizes of 50, 35.4 and 25 μm. Adaptive mesh refinement with two levels is used, and the corresponding minimum grid sizes, δx (
 $=$
δy), are 12.5, 8.84 and 6.25 μm. Figure 2 shows that similar patterns are predicted by simulations using different grid sizes. The detonation cellular structure and size for a minimum grid size of 8.84 μm are consistent with those for a minimum grid size of 6.25 μm. In figure 3, we further plot the average pressure distribution along the radius within the 60° fan-shaped region (see figure 2
a). The results indicate that the wavefront location and peak pressure value predicted using minimum grid sizes of 8.84 and 6.25 μm are very close. Therefore, in all simulations we use a base grid size of 35.4 μm, which results in a minimum grid size of 8.84 μm after two-level mesh refinement. For H2/O2/Ar mixture at 300 K and 0.6 atm, the induction length is calculated to 123.9 μm, i.e. there are approximately 14 grids within the induction zone.
Numerical soot foil for detonation initiation and propagation process with P h = 60 atm and L = 10 mm. The minimum grid sizes are: (a) δx = δy = 12.5 μm; (b) δx = δy = 8.84 μm; (c) δx = δy = 6.25 μm.

Average pressure distribution along the radius within the fan-shaped region (see figure 2(a)) predicted using different grid sizes.

3. Results and discussion
3.1. Effects of hot spot pressure
In this subsection, we evaluate the influence of hot spot pressure, P h , on the detonation initiation process. The hot spot distance is fixed to be L = 10 mm. First, we consider P h = 15 atm, and the results are shown in figure 4. At t = 2 μs, figure 4(a) shows that the hot spot ignites the mixture, forming the cylindrical shock wave (CSW) and reaction front (RF). At t = 5 μs, figure 4(b) shows that CSWs collide on the x-axis, compressing the unburned mixture but failing to trigger new autoignition. Consequently, as shown in figure 4(c), the shock wave decouples from the RF, indicating that the detonation initiation fails.
The temporal evolution of temperature contour during the detonation initiation process for P h = 15 atm and L = 10 mm. Panels show (a) t = 2 μs, (b) t = 5 μs and (c) t = 15 μs. CSW: cylindrical shock wave; RF: reaction front.

Then the hot spot pressure is increased to P h = 25 atm. Figure 5 plots the corresponding temperature contours and wave structures. Figure 5(a) shows that the collision of hot spot-induced shock waves triggers local explosion, forming an overdriven longitudinal detonation wave (LDW) propagating along the x-axis. Additionally, a transverse detonation wave (TDW) forms and propagates between the CSW and RF. The LDW, TDW and CSW constitute a triple-shock structure. The overdriven longitudinal detonation decays during its propagation. At t = 20 μs, figure 5(b) shows that micro-transverse wave structures develop on the longitudinal detonation wave front while the TDW decouples. At t = 40 μs, figure 5(c) shows that the LDW fails to maintain since the shock wave and RF decouples. The decoupled RF exhibits sawtooth shapes, indicating the LDW diffracts during its propagation process (Pintgen & Shepherd Reference Pintgen and Shepherd2009; Wang, Chen & Chen Reference Wang, Chen and Chen2021), which ultimately leads to the detonation initiation failure.
The temporal evolution of temperature contour and wave structure (inset) during the detonation initiation process for P h = 25 atm and L = 10 mm. Panels show (a) t = 10 μs, (b) t = 20 μs and (c) t = 40 μs. LDW: longitudinal detonation wave; TDW: transverse detonation wave; CSW: cylindrical shock wave; RF: reaction front.

The corresponding numerical soot foil of the detonation initiation process for P h = 25 atm (see figure 5) is shown in figure 6(a), in which trajectories of the transient detonation waves can be clearly identified. It is seen that the TDW approximately orbits around the initial hot spot and decouples at (x, y) = (1.20 cm, 1.30 cm). Cellular detonation structure along with diffraction trajectories caused by LDW are observed along the x-axis. In summary, for P h = 25 atm, wave collision triggered by initial hot spot autoignition causes local explosion and induces the LDW, which diffracts and decays during its propagation, eventually leading to detonation initiation failure.
Numerical soot foils for the detonation initiation at different hot spot pressures: (a) P h = 25 atm, (b) P h = 30 atm, (c) P h = 40 atm and (d) P h = 60 atm. The hot spot distance is fixed to be L = 10 mm. LDW: longitudinal detonation wave; TDW: transverse detonation wave.

Schematics of typical detonation initiation modes. (a) Mode 1, (b) mode 2, (c) mode 3 and (d) mode 4. Region I is dominated by hot spot autoignition, and region II is determined by wave collisions. Black dash lines in mode 2 represent the trajectories of the decoupled TDW and LDW. LDW: longitudinal detonation wave; TDW: transverse detonation wave.

To achieve successful detonation initiation, we further increase the hot spot pressure to P h = 30 atm and the corresponding numerical soot foil is shown in figure 6(b). It is observed that a portion of the LDW near the x-axis still survives when the wavefront approaches the right boundary of the domain, indicating a tendency for successful detonation initiation. However, whether the surviving cellular detonation wave can be sustained in subsequent stages needs to be confirmed by simulations with longer simulation duration and with a larger computational domain. Besides, the TDW also decouples before it reaches the y-axis. When the hot spot pressure reaches P h = 40 atm, figure 6(c) shows that the LDW continuously propagates and develops along the x-axis; and it is nearly unaffected by diffraction effects. Moreover, the TDW is shown to never quench. Besides, figure 6(d) shows the detonation initiation process for P h = 60 atm. At such high ignition energy, the initial hot spots directly initiate cylindrical detonation waves, which collide on the x-axis, resulting in an overdriven detonation wave propagating along the x-axis. Since the overdriven detonation wave has shorter induction length than the CJ state, smaller detonation cells are observed within the collision-affected region than those in the region dominated by the hot spot-induced detonation (see figure 6 d). Comparing the results in figure 6, we conclude that increasing the hot spot pressure (equivalent to increasing ignition energy) helps the LDW along the x-axis to survive the diffraction and thereby achieve successful detonation initiation.
The above results for P h = 15, 25, 30, 40 and 60 atm indicate that increasing the hot spot pressure results in a transition from failed to successful detonation initiation. Four typical detonation initiation modes are summarised and depicted in figure 7. In mode 1 shown in figure 7(a) for low hot spot pressure (i.e. low initiation energy, e.g. P h = 15 atm), the wave collision induced by hot spot autoignition fails to induce the local explosion. When P h is around the critical value (e.g. P h = 25, 30 and 40 atm), although a single hot spot fails to initiate detonation, shock wave collision on the x-axis can trigger local explosion and induce a transient LDW. When P h is slightly below the critical value, the transient detonation waves diffract and quench during the propagation process (e.g. P h = 25 atm). This is classified as mode 2 and its schematic is shown in figure 7(b). When the hot spot pressure slightly increases to larger than the critical value (e.g. P h = 40 atm), the transient detonation wave successfully resists diffraction suppression, propagates and develops continuously. This process is classified as mode 3 and its schematic is shown in figure 7(c). When the hot spot pressure is large (e.g. P h = 60 atm), the single hot spot is sufficiently stronger to directly initiate detonation. This corresponds to mode 4 as shown in figure 7(d). In summary, mode 1 and mode 2 correspond to failed detonation initiation, whereas mode 3 and mode 4 correspond to successful initiation. For mode 2 and mode 3, collisions between shock waves induced by initial hot spots play a crucial role in the formation of transient detonation waves, while the subsequent diffraction determines the continuous propagation of transient detonation waves. For mode 2, the detonation fails due to diffraction; while for mode 3, the transient detonation survives the diffraction.
Detonation initiation process for P h = 30 atm and L = 4 mm. (a) Numerical soot foil, (b) temporal temperature contours near the wave front and (c) schematic of detonation initiation mode. Region I is dominated by hot spot autoignition, region II is determined by CSW collisions and region III is dominated by TDW collision.

3.2. Effects of hot spot distance
In § 3.1, the hot spot pressure, P h , changes while the hot spot distance is fixed to be L = 10 mm. In this subsection, the effects of hot spot distance on the detonation initiation process are assessed with a fixed hot spot pressure of P h = 30 atm. We first choose L = 4 mm and the results are plotted in figure 8. The numerical soot foil in figure 8(a) indicates the wave diffraction trajectories. It is seen that the LDW first propagates along the x-axis and eventually quenches due to diffraction. However, cellular structures are shown to appear around the y-axis, indicating that the detonation initiation succeeds. Figure 8(b) shows the temporal temperature distributions near the wave front. It is observed that the TDW induced by hot spot interaction continuously propagates and collides on the y-axis. The strong collision successfully induces cellular detonation. The initiation process described above is distinctly different from mode 3 and mode 4, depicted respectively in figures 7(c) and 7(d), and thereby it is referred to as mode 5, whose schematic is depicted in figure 8(c). Mode 5 occurs only when the LDW fails to propagate along the x-axis, while wave collision on the y-axis may initiate detonation. In our previous work (Sun et al. Reference Sun, Wang, Tian and Chen2023), detonation waves were initiated by cyclical wave collisions in multiple hot spot configurations. In this study, mode 3 corresponds to a shock-induced detonation triggered by the first wave collision, while mode 5 corresponds to a shock-induced detonation triggered by the second wave collision. Compared with detonation initiation in multiple hot spot configurations (Sun et al. Reference Sun, Wang, Tian and Chen2023), the transverse wave in the dual hot spot configuration requires a longer propagation period before the next collision, making it more likely to decouple due to diffraction effects during propagation.
Numerical soot foils for detonation initiation at different hot spot distances: (a) L = 6 mm, (b) L = 10 mm, (c) L = 16 mm and (d) L = 20 mm. The hot spot pressure is fixed to be P h = 30 atm. L D is defined as the distance from the transverse wave decouple location to the y-axis.

Then the hot spot distance is increased to L = 6, 10, 16 and 20 mm, and the numerical soot foils are presented in figure 9. In figure 9(a) for L = 6 mm, the LDW diffracts and decouples along the x-axis, indicating that detonation initiation fails. This corresponds to mode 2, shown in figure 7(b). For L = 10 and 16 mm, respectively shown in figures 9(b) and 9(c), diffraction effects fail to suppress the propagation and development of the transient LDW. Consequently, successful detonation initiation is achieved, corresponding to mode 3, shown in figure 7(c). For L = 20 mm, figure 9(d) shows that the CSW induced by the hot spot decays significantly before interaction. Consequently, the weak wave collision fails to ignite the mixture, resulting in failed detonation initiation, corresponding to mode 1 shown in figure 7(a).
The results in figures 8 and 9 indicate that the dependence of detonation initiation on hot spot distance is non-monotonic: there is successful initiation for L = 4, 10 and 16 mm and failed initiation for L = 6 and 20 mm. To further elucidate how the hot spot distance affects the detonation initiation process, we plot the normalised leading shock wave speeds along the x-axis in figure 10(a).
Normalised leading shock wave speeds along (a) the x-axis and (b) the y-axis during the detonation initiation processes for L = 4, 6, 10, 16 and 20 mm and P h = 30 atm.

For L = 4 and 6 mm, the leading shock speeds along the x-axis oscillate around the CJ value during 8 < t < 16 μs, followed by a monotonic decrease. This corresponds to the propagation and decoupling of the transient LDW induced by wave collisions. For L = 10 and 16 mm, the leading shock wave speeds in figure 10(a) always oscillate around the CJ value, indicating sustained propagation of the transient LDW. Besides, the numerical soot foils in figures 8, 9(a), 9(b) and 9(c) indicate that, as L increases from 4 to 16 mm, more detonation cells caused by the transient LDW appear along the x-axis. This indicates that increasing the hot spot distance monotonically facilitates the continuous propagation of the transient LDW along the x-axis. However, as mentioned before, weak wave collision fails to induce the transient LDW for L = 20 mm. Hence, the leading shock wave speed decreases monotonically and is much lower than CJ value for L = 20 mm in figure 10(a).
Figure 10(b) shows the normalised leading shock wave speeds along the y-axis, u y /u CJ . For L = 4 and 6 mm, the normalised leading shock wave speeds first decrease and then suddenly increase separately at t = 11.0 and 21.1 μs due to the wave collision on the y-axis. For L = 4 mm, the TDW does not decouple (see figure 8) and the collision on the y-axis triggers an overdriven detonation wave with a maximum speed of 1.37u CJ . Then, the overdriven detonation wave decays to the CJ state, as indicated by the oscillation shown in figure 10(b). Figure 9 shows that the distances from the transverse wave decoupling locations to the y-axis, L D , are 0.56, 1.15 and 1.50 cm for L = 6, 10 and 16 mm, respectively. As L D increases, the decoupled transverse wave decays for a longer time before it reaches the y-axis, resulting in a weaker collision and a smaller wave speed increase on the y-axis. For L = 6 mm, the wave collision on the y-axis causes the wave speed to increase from 0.37u CJ to 0.73u CJ (see figure 10 b), failing to initiate detonation. For L = 10, 16 and 20 mm, the normalised leading shock wave speeds decrease monotonically, as shown in figure 10(b). The above analysis indicates that, as the hot spot distance increases, the distance of the TDW decoupling location from the y-axis increases, resulting in a monotonically weakening trend of detonation initiation at the y-axis.
In summary, increasing the hot spot distance promotes the propagation of the transient LDW along the x-axis. However, when the hot spot distance increases, the TDW induced by wave collision decouples farther from the y-axis, making it more difficult to initiate detonation around the y-axis. The influence of the hot spot distance on detonation initiation along the x-axis and y-axis exhibits opposite trends. Besides, when the hot spot distance is too large, hot spot interaction fails to ignite the mixture at the collision zone, resulting in failed detonation initiation. Therefore, the effects of the hot spot distance on detonation initiation are non-monotonic.
3.3. Simplified theoretical model and discussion
The simulation results in §§ 3.1 and 3.2 indicate that both the diffraction of the LDW and the decoupling of the TDW affect the detonation initiation modes. In this subsection, we propose a simplified theoretical model based on the triple-point propagation characteristics to explain how the hot spot pressure and distance affect the detonation initiation.
Figure 11(a) shows the numerical soot foil at t = 16 μs together with the temporal wave fronts for P h = 30 atm and L = 10 mm. The corresponding schematic of temporal wave structures are depicted in figure 11(b). It is seen that the LDW propagating along the x-axis expands along the grey fan-shaped region characterised by the triple-point path, resulting in the detonation wave diffraction, as shown in figures 6 and 9. Figure 11(b) shows that the triple-point velocity, u TP , comprises the velocity component perpendicular to the CSW front, u CSW , and the velocity component tangent to the CSW front, u TDW (Yuan et al. Reference Yuan, Mi, Ng and Zhou2019). Here, u CSW is the propagation velocity of the CSW induced by the initial hot spot, and u TDW is the propagation velocity of the TDW.
(a) The numerical soot foil at t = 16 μs and wave fronts at t = 8, 12 and 16 μs for P h = 30 atm and L = 10 mm; (b) schematic of temporal wave structures during the detonation initiation process.

The trajectory of the triple point, denoted by (x TP , y TP ), is determined by the following equation:
 \begin{equation} \left(\frac{dx_{TP}}{dt}\right)^{2}+\left(\frac{dy_{TP}}{dt}\right)^{2}=u_{TDW}^{2}+u_{CSW}^{2}. \end{equation}
Since the triple point always lies on the decaying CSW front, we have
 \begin{equation} x_{_{TP}}^{2}+\left(y_{TP}-\frac{L}{2}\right)^{2}=r_{CSW}^{2}, \end{equation}
where r CSW is the radius of the CSW and its temporal derivative is equal to the wave velocity, i.e.
 \begin{equation} \frac{dr_{CSW}}{dt}=u_{CSW} .\end{equation}
On the formation of the triple point, the CSWs collide at position (x, y) = (0, 0) with r CSW = L/2. Therefore, the initial condition is
 \begin{equation} t=t_{0}\colon r_{CSW}=\frac{L}{2},\left(x_{TP},y_{TP}\right)=\left(0,0\right) .\end{equation}
Combining (3.1) and (3.2), we can obtain the following expression for the temporal derivative of x TP
 \begin{equation} \frac{dx_{TP}}{dt}=\frac{r_{CSW}u_{CSW}-\left(y_{TP}-\frac{L}{2}\right)\frac{dy_{TP}}{dt}}{\sqrt{r_{CSW}^{2}-\left(y_{TP}-\frac{L}{2}\right)^{2}}} .\end{equation}
Substituting (3.5) into (3.1) yields the following nonlinear ordinary differential equation for y TP:
 \begin{equation} \left(\frac{A-B\frac{dy_{TP}}{dt}}{\sqrt{C}}\right)^{2}+\left(\frac{dy_{TP}}{dt}\right)^{2}=D, \end{equation}
with
 \begin{equation} A=r_{CSW}u_{CSW}, B=y_{TP}-\frac{L}{2}, C=r_{CSW}^{2}-\left(y_{TP}-\frac{L}{2}\right)^{2}, D=u_{TDW}^{2}+u_{CSW}^{2} .\end{equation}
The solution to (3.6) is
 \begin{equation} \frac{dy_{TP}}{dt}=\frac{AB+\sqrt{B^{2}CD+C^{2}D-A^{2}C}}{B^{2}+C} .\end{equation}
To solve (3.8), the CSW radius r CSW and TDW speed u TDW should be modelled. We neglect the unsteadiness of the triple-shock structure and assume that the transverse detonation always propagates at the CJ detonation speed, i.e. u TDW ≈ u CJ (Yuan et al. Reference Yuan, Mi, Ng and Zhou2019). The CSW speed, u CSW , depends on the initial mixture autoignition and changes during its propagation. It is difficult to have an explicit expression for u CSW . Therefore, we attempt to model the CSW propagation process via numerical simulation. The representative situation is specified as a CSW induced by a hot spot with P h = 30 atm and T h = 3000 K. Figure 12 plots the temporal evolution of the radius and propagation velocity of the CSW.
The temporal evolution of the (a) radius and (b) propagation velocity of the expanding cylindrical shock induced by a single hot spot autoignition with P h = 30 atm and T h = 3000 K. Here, t 0 is determined by condition r CSW = L/2, t C is the time when TDW collides on the y-axis and t D is the time when TDW decouples.

Utilising the approximation of u TDW ≈ u CJ and the data from figure 12, we can numerically solve (3.8). The trajectories of the triple points for different cases are plotted in figure 13(a). Note that the theoretical model neglects the decoupling of the TDW. Figure 13(a) also displays trajectories of TDWs predicted by numerical simulations, indicating good agreement between simulation and simplified theoretical model. Figure 13(b) records the change of the curvature of the triple-point trajectory, κ, with its moving distance, d TP . It is seen that, as L increases, the triple-point trajectory has a smaller curvature, resulting in a smaller expanding angle of the grey fan-shaped region shown in figure 11(b). Consequently, at larger hot spot distance, the LDW propagating along x-axis diffracts more slightly, facilitating its propagation and development. This is consistent with the phenomena depicted in figure 9, showing that the increase in hot spot distance promotes the continuous propagation of the transient LDW along the x-axis.
(a) Simulated TDW and theoretical triple-point trajectories; (b) change of the curvature of the triple-point trajectory, κ, with its moving distance, d TP , during the detonation initiation processes for P h = 30 atm and L = 4, 6, 10 and 16 mm.

Larger curvature of the triple-point trajectory also facilitates the decoupling of the TDW. Besides, as the CSW decays over time, the mixture ahead of the TDW becomes more unreactive, thereby inhibiting the propagation of the TDW. For L = 6, 10 and 16 mm and P h = 30 atm, simulation results reveal that the TDWs decouple at t = t D = 14.7, 17.7 and 29.8 μs, respectively. The corresponding curvatures at t = t D are measured at 62.5, 55.4 and 39.1 m–1 in figure 13(b). In figure 12(b), the velocities of the CSW at t = t D are separately determined to be 713.5, 662.1 and 565.2 m s–1 for L = 6, 10 and 16 mm. The results above indicate that more reactive mixture ahead of the TDW (corresponding to stronger CSW) is required to maintain its propagation without decoupling for higher curvature of the triple-point trajectory. For L = 4 mm, the TDW reaches the y-axis at t = t C = 12.8 μs, with u CSW = 753.9 m s–1 (see figure 12 b) and κ = 67.5 m–1 (see figure 13 b). The strong CSW compresses the mixture to increase its reactivity, thereby preventing the TDW from decoupling affected by the curvature effects.
Subsequently, the theoretical model is utilised for analysing the cases shown in § 3.1. Propagation of the CSWs induced by the single hot spot at P h = 25, 30 and 40 atm is simulated and the wave speeds are plotted in figure 14(a). Combining (3.8) and data from figure 14(a), theoretical triple-point trajectories are obtained and compared with the simulation results in figure 14(b), which shows excellent agreement. Figure 14(c) further depicts curvature of the triple-point trajectory varies with its moving distance for these three cases. For P h = 25 atm, the TDW decouples at t = t D = 15.7 μs according to the simulation result, with u CSW = 666.4 m s–1 (see figure 14 a) and κ = 63.1 m–1 (see figure14 c). Besides, the TDW decouples at t = t D = 17.7 μs with u CSW = 662.1 m s–1 and κ = 55.4 m–1 for P h = 30 atm. For P h = 40 atm, the TDW reaches the y-axis at t = t C = 28.8 μs, while u CSW = 624.2 m s–1 and κ = 36.3 m–1 currently. The lower curvature indicates the slighter diffraction effects. Hence the TDW to successfully reaches the y-axis without decoupling for P h = 40 atm.
(a) Propagation velocities of the expanding CSWs; (b) simulated TDW and theoretical triple-point trajectories; (c) theoretical curvatures of the triple-point path vary with its moving distance during the detonation initiation processes. Different hot spot pressure of P h = 25, 30 and 40 atm are considered, while L is fixed to 10 mm.

The above results indicate that, during the detonation initiation process, wave collision triggers the local explosion and induces transient detonation waves, i.e. LDW and TDW. Successful detonation initiation mainly depends on whether these transient detonation waves can be sustained and further developed. The LDW propagating along the x-axis expands along the fan-shaped region characterised by the triple-point path (see figure 11 b). Therefore, the diffraction effect determines the development of LDW. The simplified theoretical model can accurately predict the trajectory of the triple point before the TDW decouples. The curvature of the triple-point trajectory indicates the diffraction intensity of the transient LDW propagating along the x-axis. When the curvature is large, the transient LDW diffracts strongly and decouples. Otherwise, slight diffraction effect cannot quench the LDW. The TDW propagates behind the CSW, which is affected not only by the diffraction effect but also by the mixture reactivity behind the CSW induced by the initial hot spot. The larger the curvature, the stronger the CSW is required to be to maintain the TDW. Therefore, the LDW and the TDW each contribute to successful detonation initiation, leading to different initiation modes.
In figure 15, we present the detonation initiation modes for hot spot pressure (P h ) ranging from 15 to 60 atm and hot spot distance (L) ranging from 4 to 20 mm. Mode 1 corresponds to low P h and large L, where wave collisions induced by the hot spots fail to trigger local explosions. Mode 4 corresponds to cases with high P h , where the single hot spot can initiate the detonation individually. For critical cases (signed by the grey zone in figure 15), evolution of the triple-shock structure, i.e. the CSW, the LDW and the TDW, dominates the initiation behaviour. Both the TDW and the LDW are sensitive to diffraction effects. When the diffraction effects are slight (corresponding to higher P h and larger L), the transient LDW develops and successfully survives along the x-axis, which corresponds to mode 3. For cases with lower P h and smaller L, diffraction effects are very strong. Both the LDW and the TDW decouple, resulting in the failed initiation and corresponding to mode 2. When the transient LDW decouples while the TDW collides at they-axis without decoupling, mode 5 occurs.
Detonation initiation modes in P h –L diagram for hot spot pressure (P h ) ranging from 15 to 60 atm and hot spot distance (L) ranging from 4 to 20 mm. Critical cases corresponding to modes 2, 3 and 5 are within the grey zone.

For cases where the TDWs decouple during their propagation processes, as shown in figure 15, the curvature of the triple-point trajectory (κ) and the Mach number of the CSW at the time of decoupling are plotted in figure 16. Consequently, an empirical curve to determine the decoupling features of the TDW is fitted. Combining the simplified theory model in (3.8) and the empirical curve in figure 16, propagation of the transverse detonation is decided. Specifically, under specific operating conditions, the triple-point trajectories can be plotted in the Ma–κ diagram according to (3.8). If the theoretical triple-point path crosses the fitted curve before the TDW reaches the y-axis (e.g. the blue line in figure 16), the TDW decouples during propagation. The decoupling position and time can be determined by the intersection of between the triple-point path and the fitted curve. If the theoretical triple-point trajectory always locates above the fitted curve (e.g. the red line in figure 16), the TDW does not decouple and collides at y-axis.
Mach number of the CSW changes with the curvature of triple-point path during the triple-point moving process (the blue line is for L = 10 mm and P h = 30 atm, and the red line is for L = 6 mm and P h = 40 atm). The symbol (ρ) represents the state when the TDWs decouple for the different cases. The black fitted curve indicates the empirical boundary for TDW decoupling.

In summary, during the expansion process of the transient detonation wave induced by wave collisions, diffraction effects are crucial in determining whether the detonation wave can survive. By modelling the trajectory of triple points, we quantitatively characterise the strength of detonation wave expansion and diffraction effects. In fact, the influence of curvature on detonation initiation has also been emphasised in the spherical detonation initiation analysed by Clavin and coworkers (He & Clavin Reference He and Clavin1994; Clavin et al. Reference Clavin, Hernández Sánchez and Denet2021). Their work demonstrated that wave front curvature plays a critical role in defining the initiation threshold. Specifically, when the curvature is too high, post-shock gas expansion lowers the temperature behind the front, suppressing chemical reactions and preventing the detonation from being sustained. Their findings also underscored the influence of rarefaction waves in the burnt gas, demonstrating that excessive detonation velocity decay due to expansion effects can lead to the decoupling of the reaction zone from the shock front, ultimately resulting in detonation failure. Although in this work, detonation wave expansion is induced by wave collisions rather than a purely geometric curvature effect as in Clavin et al.’s work (He & Clavin Reference He and Clavin1994; Clavin et al. Reference Clavin, Hernández Sánchez and Denet2021), both scenarios underscore the significant role of curvature in detonation quenching and decoupling. Despite the differences in initiation mechanisms, the underlying physical principle remains consistent: curvature governs energy dissipation and directly impacts the ability of the detonation wave to sustain itself.
4. Conclusions
In this work, two-dimensional numerical simulations considering detailed chemistry in a H2/O2/Ar mixture are conducted to understand the transient detonation initiation process induced by dual hot spots. The influence of hot spot pressure and the distance between dual hot spots on the detonation initiation process is assessed. The results indicate that increasing hot spot pressure facilitates the detonation initiation. However, the influence of the distance between dual hot spots on detonation initiation is non-monotonic under critical operating conditions. Specifically, during the detonation initiation process, the initial hot spot autoignites, forming the CSWs. Then the CSWs collide and form the triple-shock structure, which consists of the LDW, TDW and CSW. The triple-shock structure dominates the subsequent detonation initiation behaviour. Increasing the hot spot distance promotes the continuous propagation of the transient LDW along the x-axis. When the hot spot distance is too large, wave collisions fail to induce the transient detonation waves, resulting in the failed initiation. Besides, the TDW decouples farther from the y-axis as hot spot distance increases, making it more difficult to initiate detonation at the y-axis.
Five typical detonation initiation modes are identified for the dual hot spot configuration. In mode 1, the wave collision induced by hot spot autoignition fails to induce the local explosion. In mode 2, the transient detonation waves induced by wave collisions diffract and quench during the propagation process. In mode 3, the transient detonation wave successfully resists diffraction suppression, propagates and develops continuously. In mode 4, the single hot spot is sufficiently stronger to directly initiate detonation. Mode 5 occurs only when the LDW fails to propagate along the x-axis, while wave collision on the y-axis may initiate detonation. Note that five modes are observed for fixed hot spot temperature and size but different hot spot pressures and distances. It might be possible to have new modes if we change the hot spot temperature/size or set desynchronisation among hot spots, which deserves further investigation in future work.
To further explain the mechanism of the detonation initiation induced by dual hot spots, a simplified theoretical model is proposed to predict the trajectory of the triple point. The curvature of the triple-point trajectory indicates the diffraction intensity of the transient LDW. When the curvature is large, the LDW diffracts strongly and decouples. Otherwise, slight diffraction effects fail to prevent the LDW from developing. The propagation of the TDW is affected not only by the diffraction effects but also by the mixture reactivity. When the curvature of the triple-point trajectory is large, a strong CSW is required to compress the mixture, enhancing its reactivity to ensure the TDW can propagate without decoupling.
This study provides insights on understanding the mechanism of promoting detonation initiation by dual hot spots. Some limitations of this work need to be explored in future studies. Besides, achieving synchronised ignition of multiple hot spots is challenging in practical applications. In future works, it would be interesting to assess the effect of desynchronisation among hot spots on the detonation initiation. The hot spots used to initiate detonation are uniform cylindrical zones with high pressure and temperature, which differ from those encountered in practical applications. Additionally, two-dimensional simulations are conducted here while more complicated and stronger wave interactions are expected in the three-dimensional case. In future studies, it would be interesting to consider more realistic hot spot and simulation configurations. Besides, considering the complex wavefront structure of practical cellular detonation waves makes detailed theoretical analysis challenging. This work primarily relies on numerical simulations to understand the mechanism of detonation initiation induced by the dual hot spot configuration. The simplified theoretical model derived from simulation results is used to analyse the diffraction effects of detonation waves, particularly by examining the trajectory of the triple point. In future works, it would be interesting to conduct a theoretical investigation focusing on fundamental physical mechanisms. As suggested by one of the anonymous reviewers, it would be interesting to conduct a detailed scale analysis of the characteristic times, such as chemical and acoustic time scales, to accurately anticipate acoustic coupling and to provide a deeper understanding of the underlying dynamics.
Acknowledgements.
This work was supported by National Natural Science Foundation of China (No. 52425604). We thank Mr Y. Wang from Peking University for helpful discussion.
Declaration of interests.
The authors declare that they have no known competing financial interests or personal relationships that could have appeared to influence the work reported in this paper.
Appendix A. Influence the simulation domain set-ups
In the simulations of this study, a quarter-domain configuration with symmetry boundary conditions is employed. In this subsection, the detonation initiation and propagation processes induced by dual hot spots at P h = 60 atm and L = 10 mm are predicted separately using the quarter-domain and full-domain set-ups. The numerical soot foils are shown and compared in figure 17. The results indicate that the triple-point trajectories observed in figures 17(a) and 17(b) are consistent, demonstrating that the quarter-domain set-up with symmetry boundary conditions can reliably capture the detonation initiation and propagation processes, producing results consistent with those obtained from the full-domain simulation.
Numerical soot foils depicting the detonation initiation and propagation processes, predicted using (a) the quarter-domain set-up with symmetry boundary conditions and (b) the full-domain set-up. Here, P h = 60 atm and L = 10 mm.

Appendix B. Validation of the assumption u TDW ≈ u CJ
For the simplified theoretical model predicting the triple-point motion in § 3.3, we assume that u TDW ≈ u CJ according to Yuan et al.’s work (Yuan et al. Reference Yuan, Mi, Ng and Zhou2019). In this subsection, we calculate the propagation velocity of the transverse wave (u TW ) under different hot spot distances and show the results in figure 18. Taking L = 16 mm as an instance (see the black curve in figure 18), the transverse wave speed is near the CJ value when t < 26 μs. Then u TW decreases rapidly to much lower than u CJ , which is caused by the TDW decoupling. For curves L = 4, 6 and 10 mm in figure 18, we also observe that the transverse wave speeds are close to the CJ speed before the detonation waves decouple into RFs and shock waves. Hence, the assumption u TDW ≈ u CJ is reasonable.
Propagation speeds of the transverse wave under different distances (L = 4, 6, 10 and 16 mm) between the dual hot spots. Hot spot pressure is fixed at 30 atm.

Appendix C. Supplementary description of the triple-point trajectory
According to the theoretical model in § 3.3, the triple point initially forms and moves from the position (x, y) = (0, 0) at t = t 0. Taking the case of P h = 30 atm and L = 10 mm as an example, the theoretical triple-point trajectory is plotted in figure 19(a). The results indicate that the triple point initially moves into the region where y < 0 before transitioning into the y > 0 region at (x, y) = (0.61, 0) cm. Figure 19(b) presents the simulated temperature contour near the x-axis at t = 4 μs. It demonstrates that the adjacent CSWs undergo regular reflection, with their intersection moving along the x-axis. As a result, two transmitted shock waves (TSWs) form, and the triple points propagate along the TSW fronts. Taking triple-point number 1 (which propagates along the TSW and CSW fronts induced by the upper hot spot) as an example, it remains within the y < 0 region before catching up with the intersection of the CSWs. This corresponds to the stage where the theoretical triple-point trajectory lies in the fourth quadrant (see figure 19 a).
(a) Theoretical triple-point trajectory and (b) simulated temperature contour near the x-axis at t = 4 μs for the detonation initiation process P h = 30 atm and L = 10 mm.

It is emphasised that the theoretical model assumes the triple point always moves along the CSW front. The theoretical triple-point trajectory is determined based on the propagation velocity of the CSW. However, during the initial stage, when the triple point moves along the transmitted shock wave front, this assumption is not accurate. Nevertheless, since this stage lasts for only a short duration (approximately 2.5 μs < t < 4.6 μs for P h = 30 atm and L = 10 mm), its impact on the final results is negligible.