I. INTRODUCTION
There has, in recent years, been much interest in the development of austenitic stainless steel with face centered cubic (FCC) structure, in particular 304 stainless steel, for various applications such as pressure vessel, pipes for transferring corrosion liquids, high temperature application, because of their good mechanical properties, corrosion resistance, good process-ability, nonmagnetic properties, and favorable combination of strength and formability. Reference Choi, Fukuda and Kakeshita1–Reference Kim, Kim, Hwang, Lee and Kang5 Low yield and fracture strength at room temperature are the main disadvantages of stainless steel. Reference Kim, Kim, Hwang, Lee and Kang5 Both strength and ductility can be improved by introducing martensitic transformation to the material, because such transformation enhances its plasticity. Reference Wang, Jeong, Clausen, Liu, McCabe, Barlat and Tome6 This can be brought about by subjecting the material to large strain. Martensitic transformation in steels with unstable or metastable austenite phase leads to increase strain hardening during the forming process. This phenomenon causes an increase in the ductility and strength of the material, which is known as the transformation induced plasticity (TRIP) effect. Reference Choi, Lee, Lee, Koh, Cho, Han and Park7,Reference Davut and Zaefferer8
There have, in recent years, been many attempts to produce modern material such as unstable austenitic steel due to promise of enhancement of their mechanical properties through transformation. Reference Snezhnoi9 While it is recognized that phase transformations in many materials can critically influence material performance, such transformations must be carefully controlled to avoid complications during operation. Reference Hausild, Davydov, Drahokoupil, Landa and Pilvin10
Martensitic transformation is controlled by nucleation mechanism. Some basic studies were reported about the mechanism and kinetic of martensite nucleation by G.B. Olson and M. Cohen, in 1972 and 1975. They found that new sites or embryos, which are included in strain induced-nucleation, are generated during plastic deformation. Strain induced-nucleation plays an important role in the martensitic transformation. ά-embryos are created when stacking fault energy (SFE) is very low in the austenite phase. Reference Olson and Cohen11,Reference Olson and Cohen12
Stainless steels commonly have low SFE. SFE is a function of chemical composition, temperature and heat treatment, which control the deformation processes. For example, low concentrations of carbon reduce the SFE, while the influence of manganese and chromium on SFE depends on the presence/absence of other elements. Increasing nickel has been known to enhance SFE. Reference Li, Wang, Liu, An, Liu, Su, Li and Liaw2,Reference Yonezawa, Suzuki, Ooki and Hashimoto13
The parameters that affect martensitic transformation are strain and stress state and these parameters control the deformation mechanism. Reference Andrade-Campos, Teixeira-Dias, Krupp, Barlat, Rauch and Gracio14,Reference Stringfellow, Parks and Olson15 It is shown that transformation in austenitic stainless steels can be direct or indirect. When direct, the nonmagnetic austenite with FCC structure transforms into magnetic α/-martensite (γ → α/) with body centered cubic (BCC) structure. When indirect, nonmagnetic austenite transforms into nonmagnetic ε-martensite with hexagonal closed pack (HCP) structure, which then transforms into magnetic α/-martensite (γ → ε → α/). Reference Li, Wang, Liu, An, Liu, Su, Li and Liaw2,Reference Shaira, Guy, Courbon and Godin16 Indirect transformation commonly occurs in materials with low SFE such as austenitic stainless steel, whereas high SFE causes direct transformation in the material. Reference Li, Wang, Liu, An, Liu, Su, Li and Liaw2,Reference Hausild, Davydov, Drahokoupil, Landa and Pilvin10
X-ray diffraction (XRD) is a useful method for nondestructive analysis of the material and brings information from material structure such as phase, texture, and gain size. Phase identification is the common use of XRD. Reference Rouziere, Bazin and Daudon17 Magnetic saturation and XRD are the most commonly used tests for measuring transformed martensite. During the process of sheet metal forming, maximum transformation occurs on the sheet surface because the friction between the sheet surface and punch leads to shear stress. Shear stress affects the deformation process and martensitic transformation; thus transformation increases on the surface and decreases from the surface to the core. The main disadvantages of XRD are that it only provides information of the surface and is costly and time consuming. Reference Shirdel, Mirzadeh and Parsa18 The magnetic saturation method is based on ferromagnetic material properties and measures the strength of induced magnetic field Reference Shaira, Guy, Courbon and Godin16,Reference Shirdel, Mirzadeh and Parsa18 and can be used to assess samples of various shapes, thicknesses, and sizes.
Many papers have discussed the effects of several factors that affect martensitic transformation Reference Yonezawa, Suzuki, Ooki and Hashimoto13–Reference Stringfellow, Parks and Olson15,Reference Lo, Zeng and Kwok19–Reference Beese and Mohr25 but most of these studies have only focused on uniaxial and equi-biaxial tension test. There are few simulation and experimental studies on understanding martensitic transformation in different portions of the dome through dome testing. In this study, both experiment and simulation studies were carried out to investigate the effect of strain rate on VFM. Simulation was performed using LS-DYNA software utilizing MAT_TRIP to determine VFM.
II. EXPERIMENTAL PROCEDURE AND SIMULATION
A. Materials and method
A stainless steel sheet type 304L of 0.5 mm thickness was used to perform dome testing. Increasing carbon content enhances stability of austenite phase and decreases the formation of martensite. Reference Lo, Zeng and Kwok19 For this reason, low carbon austenitic stainless steel was chosen to achieve higher VFM. Eight blanks were prepared with a constant length of 200 mm along the rolling direction and different widths of 200 to 25 mm with increment of 25. 26 Teflon sheet was used for reducing the friction between punch and blanks.
Forming limit diagram (FLD) is the common and powerful method to determine formability of sheet metals. Keeler, Backofen, and Goodwin presented the FLD concept, in 1964 and 1968. Reference Safdarian, Jorge, Santos, Naeini and Parente27 FLD can be obtained using Marciniak and Nakazima testing. Reference Davis and Semiatin28 Erichsen test by hemispherical punch with a diameter of 22.2 mm is the method to define FLD for sheet metals. Reference Davis and Semiatin28 The use of hemispherical punch with a diameter of 75 or 100 mm is common in scientific research for dome test. 26 In this work, hemispherical punch with a diameter of 75 mm and 40 ton hydraulic press was used to perform dome testing. Dome tests were carried out with three punch speeds of 3, 30, and 300 mm/min to study the effect of strain rates on VFM.
B. Measuring martensite
Magnetic saturation and XRD methods are the stabilized methods to determine volume fraction of martensite (VFM). These reliable methods have been used by many authors in their works. Reference Talonen, Aspegren and Hanninen29–Reference Beese and Mohr31 Magnetic saturation was used to determine VFM. This procedure is based on the induction of a magnetic field in the samples and is commonly used to identify and assess the amount of martensite in austenite phase matrix. In this method, magnetic changes of the material are measured after applying strain. The measured intensity of the magnetic field can be directly attributed to ferromagnetic phase (martensite) that is formed from nonmagnetic phase (austenite). Reference Hausild, Davydov, Drahokoupil, Landa and Pilvin10,Reference Shaira, Guy, Courbon and Godin16
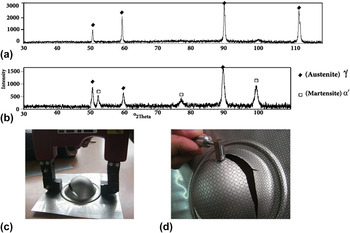
Magnetic saturation was calibrated by XRD to measure the VFM using magnetic method in the samples that were stretched under various punch speeds in dome test. In this case, VFM in the sample with the constant strain should be determined by the XRD and magnetic methods. For calibrating magnetic saturation in this setup, tensile test [based on ASTM E8 (Ref. 32)] was carried out with a punch speed of 3 mm/min. XRD along the gage length was performed to confirm and calibrate magnetic saturation. PHILIPS PW1780 x-ray generator (FEI Company, Tokyo, Japan) with CoKα radiation tube, applying 40 kV and 30 mA, was used to perform XRD. Figures 1(a) and 1(b) show XRD pattern of the initial material (fully austenitic) and the sample that was tested through tensile testing using a punch speed of 3 mm/min. Then, VFM of the gage length was measured using both XRD and magnetic methods.
XRD pattern for (a) initial material and (b) sheet tested under a punch speed of 3 mm/min in tensile test; (c) inducing magnetic field, (d) measuring strength of the magnetic field.

As can be seen in Fig. 1(c), the sample was placed in the magnetic field. In this work, equipment for inducing the magnetic field with a capacity of 230 V, 50–60 Hz and 3 A was used. Then, induced magnetic field in the sample was measured with the magnetometer. The ratio of martensite fraction measured by XRD to magnetic saturation was calculated and then this ratio was interned to all magnetic test results in the next measurements. The results of inducing magnetic field and measuring the strength of magnetic field method after dome testing are shown in Figs. 1(c) and 1(d).
C. Simulation
Dome tests for various conditions were simulated using LS-DYNA with TRIP material model to define VFM, strain, stress, triaxiality, and critical region. It was shown that the transformation rate depends on material composition, temperature, and the applied stress. Reference Post, Datta and Beyer33
Von-Mises surface combined with the hardening, which is the temperature dependant, is used by MAT_TRIP model in LS-DYNA. Temperature rate is defined as the Eq. (1). 34
 $$\mathop T\limits^o = {{\sigma {D_{\rm{p}}}} \mathord{\left/ {\vphantom {{\sigma {D_{\rm{p}}}} {\rho {C_{\rm{p}}}}}} \right. \kern-\nulldelimiterspace} {\rho {C_{\rm{p}}}}}\quad ,$$
where, σD p is the plastically dissipated heat.
Equation (2) shows the rate of martensite formation as a function of plastic strain and other factors. 34
 $${{\partial V} \mathord{\left/ {\vphantom {{\partial V} {\partial {{\bar \varepsilon }^{\rm{p}}}}}} \right. \kern-\nulldelimiterspace} {\partial {{\bar \varepsilon }^{\rm{p}}}}} = \left\{ {\left( {{B \mathord{\left/ {\vphantom {B A}} \right. \kern-\nulldelimiterspace} A}} \right)\exp \left( {{Q \mathord{\left/ {\vphantom {Q {T - {T_{{\rm A}0}}}}} \right. \kern-\nulldelimiterspace} {T - {T_{{\rm A}0}}}}} \right){{\left( {{{1 - {V_{\rm{m}}}} \mathord{\left/ {\vphantom {{1 - {V_{\rm{m}}}} {{V_{\rm{m}}}}}} \right. \kern-\nulldelimiterspace} {{V_{\rm{m}}}}}} \right)}^{\left( {B + 1} \right)B}}\mathop {{V_{\rm{m}}}}\nolimits^P \left( {{1 \mathord{\left/ {\vphantom {1 2}} \right. \kern-\nulldelimiterspace} 2}} \right)\left( {1 - \tanh \left( {C + DT} \right)} \right)} \right\}$$
Martensite volume fraction is integrated from the Eq. (2), and then Eq. (3) is obtained for martensite fraction. 34
 $${V_{\rm{m}}} = \int_0^\varepsilon {\left( {{{\partial {V_{\rm{m}}}} \mathord{\left/ {\vphantom {{\partial {V_{\rm{m}}}} {\partial {{\bar \varepsilon }^{\rm{p}}}}}} \right. \kern-\nulldelimiterspace} {\partial {{\bar \varepsilon }^{\rm{p}}}}}} \right){\rm{d}}{{\bar \varepsilon }^{\rm{p}}}}$$
The yield stress of the material is calculated via Eq. (4) with the model and then used during simulation as the yield stress. The yield stress is determined by Eq. (4) (Ref. 34):
 $${\sigma _{\rm{y}}} = \,\left\{ {{B_{{\rm{HS}}}} - \left( {{B_{{\rm H}{\rm{S}}}} - {A_{{\rm{HS}}}}} \right)\exp \left( { - m{{\left[ {{{\bar \varepsilon }^{\rm{p}}} + {\varepsilon _0}} \right]}^n}} \right)} \right\}\left( {{K_1} + {K_2}T} \right) + \Delta {H_{\gamma \to {\alpha}}}{V_{\rm{m}}}\quad ,$$
where:
 ${\bar \varepsilon ^{\rm{p}}}$
: effective plastic strain, Q: heat capacity, T: initial temperature, A, B, C, D, P, K
1, K
2, m, n,
 $\Delta {H_{\gamma \to {\alpha}}}$
: martensite rate equation parameters, ε0: amount of pre-strain, A
HS, B
HS: hardening law parameters, and V
m0: initial VFM.
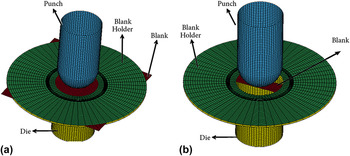
Mesh construction of forming tools and sheets for modeling of tests by the software are shown in Fig. 2. Rectangular blanks with a width of 200 mm that form the right region, Fig. 2(a), and the strip with width of 25 mm that form the left region of FLD, Fig. 2(b), were simulated to study the effect of transformation on the formability of the material.
Modeling of dome test for: (a) the rectangular sheet with a width of 200 mm, (b) the strip sheet with a width of 25 mm.

III. RESULT AND DISCUSSION
A. Calibration of magnetic saturation by XRD
Figure 1(a) shows that the initial material is fully austenitic, whereas Fig. 1(b) indicates that α/ phase transforms during tensile testing. It is found that microstructure of the material consists of about 62% γ and 38% α/ after tensile testing. It is noted that the amount of α/-martensite can be measured by magnetic saturation method. Reference Hausild, Kolarík and Karlík35 In this work, the intensity of the magnetic field was measured at various points of the gage length and the average intensity of the field was calculated for comparison with XRD results. The magnetometer showed zero for intensity of the magnetic field in the initial material (showing that the initial material is fully austenitic). But the intensity was 0.33, 0.34, and 0.33 for three points of the gage length near the area of failure. Thus, the amount of transformed martensite was about 0.33 by the magnetic saturation method.
B. Effect of VFM on the material behavior
Necking and failure occurred at the pole and close to the flange for low and high strain rates, respectively. Further, the maximum height of dome was seen in samples with failure at the pole, and minimum height of dome was seen in samples with failure and necking in the region close to the flange. This phenomenon is related to transformed martensite, which formed during deformation.
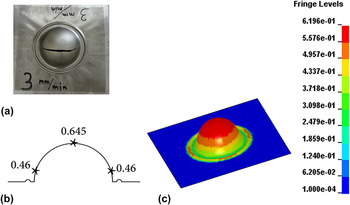
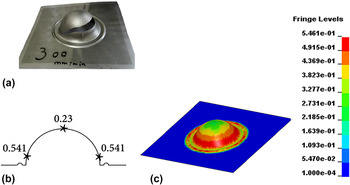
Figure 3(a) shows sample that was tested with a punch speed of 3 mm/min. Figures 3(b) and 3(c) show high amount of induced martensite with low strain rate deformation. The failure area and maximum and minimum amount of transformed martensite under punch speed of 300 mm/min in both experimental and simulation methods are shown in Fig. 4.
(a) Fracture region, (b) measured VFM using magnetic saturation, and (c) by simulation for the rectangular blank with a width of 200 mm and punch speed of 3 mm/min.

(a) Fracture region, (b) measured VFM by magnetic saturation and (c) by simulation for the rectangular sheet with a width of 200 mm and punch speed of 300 mm/min.

Based on magnetic saturation measurement in Fig. 3(b), it can be seen that maximum and minimum VFM of 64.5 and 46% were formed at the pole and close to the flange area, respectively. Figure 3(c) shows similar results by simulation, so that maximum VFM of 62% was predicted at the pole, and a minimum between 43 and 49% was predicted close to the flange. In contrast, Fig. 4(b) shows that maximum VFM of about 54.1% was formed at the region close to the flange, while minimum of about 23% transformed at the pole region. As shown in Fig. 4(c), simulation results clearly validate the experimental measurements.
The VFM difference between the pole and flange region at low strain rate (18.5%) was less than that of the high strain rate (31.1%) conditions. It is possible to induce more strain and elongation in the samples to reach higher work hardening due to martensitic transformation under low strain rate. Reference Curtze, Kuokkala, Hokka and Peura36,Reference Ueji, Takagi, Tsuchida and Shinagawa37 Since martensite formation is a function of strain and strain rate, the distribution of martensite is more uniform from the pole to flange at low strain rate and this uniformity decreases with higher forming tool speed.
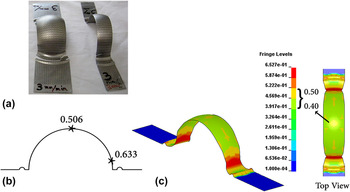
Figure 5(a) shows the failure area in the sample with a width of 25 and 50 mm under low strain rate. According to magnetic saturation output, Fig. 5(b), maximum VFM was 63.3% and minimum was 50.6% in the regions close to the flange and the pole, respectively. Considering Fig. 5(c), it is clear that simulation results verify experimental measurements, i.e., maximum VFM of about 65% and minimum of 40–50% were predicted at the region close to the flange and the pole, respectively.
(a) Fracture region, (b) measured VFM by magnetic saturation and (c) by simulation for the strip with a width of 25 mm and punch speed of 3 mm/min.

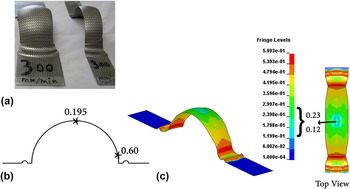
Figure 6(a) shows the failure area for high strain rate condition. Figure 6(b) shows that maximum VFM was about 60% at the region close to the flange, while minimum of 19.5% was formed at the pole. According to the simulation result, Fig. 6(c), maximum VFM was about 60% at the region close to the flange and minimum level was 12–23% at the pole. As the result, maximum VFM formed in the region close to the flange under both strain rates due to higher martensitic transformation of metastable austenite under biaxial tension than with uniaxial tension. It is noted that higher martensitic transformation of metastable austenite occurred under biaxial tension state than with uniaxial tension. Reference Yeddu, Lookman and Saxena22,Reference Tourki, Bargui and Sidhom38 The effect of stress state on martensitic transformation can be expressed by the stress triaxiality parameter; increase in the stress triaxiality intensifies transformation. Reference Stringfellow, Parks and Olson15,Reference Kim, Lee, Barlat, Kim and Lee39 The state of strain and stress are different between the pole and close to the flange in the strip sheets, therefore maximum VFM developed at the region close to the flange.
(a) Fracture region, (b) measured VFM by magnetic saturation and (c) by simulation for the strip with a width of 25 mm and punch speed of 300 mm/min.

It can be understood from Figs. 3–6 that decreasing the strain rate led to increased VFM and this phenomenon enhanced the uniform strain, consequently improving formability. The forming process should thus be performed under low strain rate to achieve higher sheet formability of the material; consequently necking is delayed and failure happened posterior. The reason for this phenomenon can be considered from several aspects such as stain rate, temperature, SFE, shear band formation, stress state, dislocation tangles that are discussed in the following section:
Strain rate is one of the most important parameters that affect the sheet formability. Increasing the strain rate enhances the temperature of the sheet, because there is not enough time for heat transfer from the sample during the process of forming at high strain rate, while the generated heat has enough time to transfer with low strain rate. Reference Han, Lee, Suh and Kim40,Reference Talonen, Nenonen, Pape and Hanninen41 It must be mentioned that isothermal process is dominant with low strain rate, whereas with high strain rate the adiabatic process is dominant. Reference Isakov, Hiermaier and Kuokkala20 As a result, higher strain rate leads to increase in the temperature of the sample during processing.
Austenitic stainless steels have limited heat transfer characteristics and the temperature significantly affects martensitic transformation. Reference Andrade-Campos, Teixeira-Dias, Krupp, Barlat, Rauch and Gracio14 Temperature and stress state affect the formation rates of shear bands; in this case, increasing the temperature reduces shear band formation. Reference Iwamoto, Tsuta and Tomita23,Reference Dan, Zhang, Li and Lin42 Decreasing the shear bands restrains martensitic transformation, which is controlled by nucleation, because high strain rate enhances the temperature.
From the view point of chemical driving force (−ΔG) that can be expressed as Eq. (5), Reference Han, Lee, Suh and Kim40 temperature rise during the deformation process at high strain rate leads to decrease chemical driving force and reduces VFM.
 $$\Delta G = \Delta {G^{\rm{C}}} + \Delta S\left( {T - {M_{\rm{s}}}} \right)$$
SFE is another key factor that has significant effect on martensitic transformation in austenitic steels. It should be considered that temperature rise of the sheet increases SFE of the steel. Reference Hedstrom, Lindgren, Almer, Lienert, Bernier, Terner and Oden43 High strain rate forming process enhanced temperature of the blank and SFE, consequently it reduced the induced martensite.
From Figs. 3–6, it can be understood that the difference in VFM between the pole and region close to the flange at low forming speed was less than at high forming speed. The reason for this phenomenon is that more formability and uniform elongation and consequently more martensite were obtained in the sample at low strain rate.
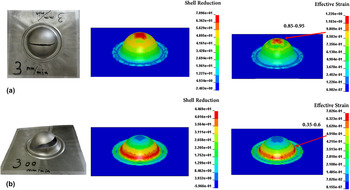
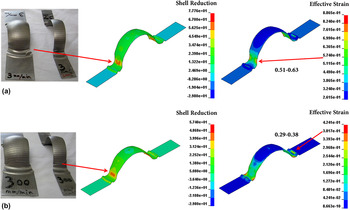
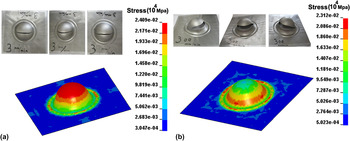
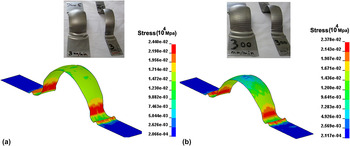
Increasing VFM leads to increase strain, thus higher strain and maximum percentage of reduction of area were obtained and failure postponed. Maximum percentage of shell reduction was about 70.96% at the pole with low strain rate, Fig. 7(a), and about 44.69% close to the flange with high strain rate, Fig. 7(b). It can be concluded that maximum strain and percentage of shell reduction occurred at the pole with low strain rate. Necking at the pole region indicates that more uniform elongation occurred during the forming process until failure occurred at the pole. The same result was obtained for strips with a width of 25 mm. As shown in Fig. 8, maximum percentage of shell reduction was about 77.76 and 57.4% with low and high strain rate, respectively.
Shell reduction and effective strain for the rectangular sheet with a punch speed of: (a) 3 mm/min and (b) 300 mm/min.

Shell reduction and effective strain for the strips with punch speed of: (a) 3 mm/min and (b) 300 mm/min.

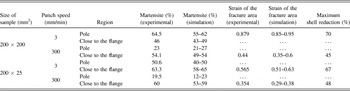
It is revealed that austenitic stainless steels exhibit different behaviors under various stress states. Reference Perdahcıoglu, Geijselaers and Huetink24,Reference Beese and Mohr44 Martensite nucleation sites in the region under severe plastic deformation were more than those in the other regions. In this case, severe plastic deformation led to form dislocation tangle and martensite nucleated in the region with high density of dislocations. Consequently this phenomenon enhanced VFM in the region with the highest strain. Reference Yeddu, Lookman and Saxena22 It is clear that maximum VFM, Figs. 3–6, was formed in the region with maximum percentage of shell reduction and maximum strain, Figs. 7 and 8. VFM for all conditions are described in Figs. 3–8 as a function of strain rate, strain and maximum percentage of shell reduction and the results of experimental and simulation tests are summarized in Table I.
VFM for all tested sheets as a function of strain rate, strain, and percentage of shell reduction.

Considering Fig. 9, maximum stress for both experiments and simulations were obtained at the pole and close to flange at low and high forming speed, respectively. As can be understood from Fig. 10, maximum stress developed in the region close to the flange with both low and high strain rates for the strip sheets, because state of strain and stress were different between the pole and flange area.
Distribution of stress (×104 MPa) in the rectangular sheets with a punch speed of: (a) 3 mm/min and (b) 300 mm/min.

Distribution of stress (×104 MPa) in the strip sheets with a punch speed of: (a) 3 mm/min and (b) 300 mm/min.

Imposed strain, equivalent stress and induced martensite were very different for strips with a width of 25 mm from those of the rectangular sheet with a width of 200 mm. Figure 8(a) shows that maximum strain and percentage of shell reduction developed close to the flange for both low and high strain rates, because the state of strain and stress were different in the pole and flange regions. In addition, maximum equivalent of stress developed close to the flange with low and high strain rates, Fig. 10, therefore maximum VFM formed in the region close to the flange in the strip sheets with a width of 25 mm.
Triaxiality (Σ) factor is dominant in the region with the highest elongation. Reference Yeddu, Lookman and Saxena22 As mentioned, martensitic transformation is a function of strain. Also, maximum strain and elongation developed at the region with maximum stress. Figures 7(a) and 7(b) show that maximum strain and percentage of shell reduction developed at the pole and close to the flange with low and high strain rates, respectively, because of maximum equivalent stress, see Figs. 9(a) and 9(b), consequently maximum VFM formed at the region close to the flange due to high amount of strain.
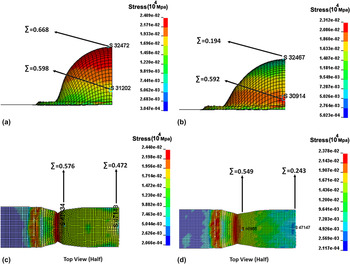
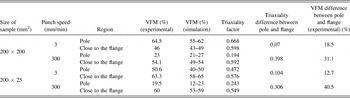
Triaxiality factor at the pole was higher than that close to the flange at the low strain rate, Fig. 11(a), while Triaxiality factor in the pole was lower than that close to the flange at the high strain rate, Fig. 11(b). Figures 11(c) and 11(d) show that triaxiality factor in the region close to the flange was higher than that at the pole with both low and high strain rates. Figures 3–6, 11 and Table II show that VFM depends on the triaxiality factor. According to Table II, triaxiality difference between the pole and close to the flange at the low strain rate was less than that at the high strain rate. Similar results can be seen for fraction of martensite. Austenite phase transfers applied force to martensite phase that was formed during deformation. Reference Hedstrom, Lindgren, Almer, Lienert, Bernier, Terner and Oden43 Uniform elongation and strain were enhanced at low strain rate situation and more elongation was obtained with maximum triaxiality factor. This means that more martensite was formed and more force transferred from austenite to martensite phase, so uniform elongation was enhanced at low strain rate.
Triaxiality factor for the rectangular sheets under punch speed of: (a) 3 mm/min and (b) 300 mm/min; for the strip sheets under punch speed of: (c) 3 mm/min and (d) 300 mm/min.

VFM versus triaxiality factor; difference of VFM and difference of triaxiality factor for various regions.

IV. CONCLUSION
This study examined the effect of strain rate on martensitic transformation through dome test. The effect of martensitic transformation on the formability of the sheet was studied. Martensitic transformation was found to affect the formability and deformation mode of the sheet. Findings of the present study showed that in rectangular sheets with a width of 200 mm, maximum VFM was 64.5 and 54.1% under the low and high strain rates, respectively. It was seen that maximum VFM formed at the pole area with low strain rate, whereas it formed at the region close to the flange with high strain rate. Maximum VFM formed in the region close to the flange in all sheets with a width of 25 mm at both low and high strain rates to develop different stress states at the pole and close to the flange. Results revealed that maximum VFM transformed in the region with higher elongation, triaxiality, strain, and percentage of shell reduction. LS-DYNA simulation results were in good agreement with the results of the experiments.