‘[N]umbers are of the essence: the significance and consequences of an alien element introduced into a country or population are profoundly different according to whether that element is 1 per cent or 10 per cent …’ Enoch PowellFootnote 1
In his infamous 1968 speech in Birmingham, the Conservative Member of Parliament Enoch Powell contended that the increasing numbers of non-white immigrants to Great Britain would lead to racial conflict of a magnitude comparable to that which embroiled the United States at that time. Powell’s speech was widely criticized for being more provocation than prognostication at a moment when the major political parties in Britain were trying to avoid any appearance of condoning racism, though it did win him a substantial popular following. By the beginning of the twenty-first century, the size of England’s ethnic minority population was approaching the level that Powell feared. According to the 2001 Census, slightly more than 9 per cent of the population of England identify themselves as belonging to a non-white ethnic group.Footnote 2
While racial conflict has not reached the grim levels prophesied by Powell, it still persists nearly half a century after the arrival of significant numbers of non-white immigrants on British shores, as demonstrated by the riots that gripped several cities in northern England in the summer of 2001, the election of several members of the far-right British National Party to seats in recent local elections, and the reverberations from the terrorist attacks in the summer of 2005.
A critical issue for intergroup relations in emerging multiracial, multicultural societies like England is how those majority group members who reside in areas of ethnic minority concentration respond to the experience of living amidst racial and cultural diversity. Due to the spatial concentration of England’s minority populations, whites in some areas are faced with the probability of becoming a numerical minority in the near future. Yet for the majority of whites in England, multi-racial Britain remains a distant reality (geographically, if not psychologically). This article explores the consequences of the uneven distribution of England’s ethnic minority groups for whites’ racial attitudes. Was Enoch Powell correct in predicting that racial hostility would increase as an area became more ethnically diverse? Or will interpersonal interactions between whites and members of minority groups serve to dispel rumours and myths about the other group, thus lessening intergroup animosity? I address these questions by investigating the effects of local context on the racial attitudes of English whites. Specifically, I operationalize and test hypotheses based on the contact and group conflict theories using survey data from England from the period 1996–2001. The survey questions measure the racial attitudes of white respondents, who are matched to contextual data relating to the characteristics of the localities in which they live. The results of these analyses have implications not just for race relations in England, but also for intergroup relations in a variety of contexts.
I begin with a review of the literature on the effects of social context on racial attitudes, with particular focus on studies of the contact hypothesis and racial threat theory, and a description of previous research on racial hostility in England. The next section describes the survey data and contextual data that are employed in this article, as well as the methods used to analyse them. I then present the results of multilevel models of whites’ racial hostility. These findings make several contributions to the study of the contextual determinants of racial hostility. First of all, unlike previous studies of the effects of racial context on racial attitudes in England, the measures of racial context employed in this study distinguish between the three largest non-white groups in Britain. Secondly, I estimate models that simultaneously analyse the effects of context measured at two geographic levels, to test whether the dynamics of contact and threat are visible at different levels of aggregation. Finally, my analysis includes a number of contextual-level control variables in order to isolate the effects of ethnic context from other local factors that affect whites’ racial hostility. The findings demonstrate not only that context matters but also how it matters, which is crucial to the understanding of the future of race relations in England.
Theories of contact and conflict
A growing body of research demonstrates that variation in political attitudes and behaviour between localities not merely reflects differences in social composition. Instead, the characteristics of the contextual unit itself affect the attitudes and behaviour of the individuals within it. As Huckfeldt argues, ‘Individual actors not only respond to their own internal motivations, they also respond to the social composition of their environments.’Footnote 3 For example, the class composition of an area has been shown to influence partisan allegiances in both the United StatesFootnote 4 and Great Britain,Footnote 5 even after controlling for the class position of the individual survey respondents. Recently, Johnston, Pattie and their colleagues have demonstrated that voting behaviour in England and Wales is affected by neighbourhood-level economic deprivation,Footnote 6 neighbourhood socio-economic statusFootnote 7 and the composition of the local housing market.Footnote 8
The study of the effects of a locality’s racial composition on the racial hostility of its residents has a particularly long history in the social sciences. Nonetheless, there is still widespread disagreement over the fundamental question of the direction of this relationship. Proponents of the contact hypothesis argue that, under certain conditions, interactions between in-group members and out-group members will cause prejudice towards the out-group to decline. On one hand, if it is assumed that the probability of such contact will increase in proportion with the size of the out-group, then racial hostility should be lower in racially diverse areas than in relatively homogeneous ones. On the other hand, realistic group conflict theory contends that as the size of the out-group increases, competition between groups over scarce resources (for example, in the housing and labour markets) results in heightened intergroup animosity. However, below, I will argue that when these theories are operationalized correctly they are not as incompatible as their respective proponents often imply.
Although contact theory is sometimes reduced to the hypothesis that increased interaction between members of two groups ipso facto results in increased tolerance, the theory laid out by Gordon Allport in The Nature of Prejudice was not so simplistic.Footnote 9 Only prolonged, personal contacts that bring knowledge and familiarity serve to reduce prejudice. Moreover, this contact must occur under specific conditions for it to have positive effects: equal status between the in-group member and out-group member within the situation; the pursuit of common goals; intergroup co-operation; and the normative support of authorities, law or custom. Subsequent scholars have added further conditions that must be present for intergroup interactions to result in greater tolerance.Footnote 10 Despite these caveats, studies that look at the correlation between reported interaction with members of an out-group and attitudes towards that group generally provide support for the contact hypothesis.Footnote 11 The basic hypothesis that personal contact between members of different ethnic groups is associated with lower levels of intergroup prejudice has been confirmed across a variety of time periods and locations.Footnote 12
However, the interpretation of the causal relationship between contact and intergroup attitudes is complicated by the likelihood of selection bias, whereby the most prejudiced people may avoid contact with members of the out-group, while individuals favourably disposed to the out-group may seek out intergroup friendships.Footnote 13 One commonly employed solution to this problem is to measure contact indirectly via contextual variables such as an ethnic group’s percentage of the population in a geographic area. The assumption underlying this research strategy is that the relative size of an out-group within an individual’s local surroundings affects the probability that she will encounter an out-group member in her daily life. As these accidental encounters become more likely, meaningful intergroup acquaintances should become more common. Research in the United States has shown that whites who live in close proximity to blacks are more likely to come into personal contact with blacks in their neighbourhoods and develop close interracial friendships than whites who lived in predominantly white neighbourhoods.Footnote 14 However, studies that have measured contact indirectly by employing a contextual variable have not provided consistent support for the contact hypothesis.Footnote 15
While contact theory exclusively focuses on the attitudes and behaviours of individuals, group conflict theory emphasizes the importance of group interests in shaping intergroup conflict and co-operation. From this perspective, racial hostility is conceptualized not as an individual vice, but as a collective phenomenon that is affected by the structure of intergroup relations.Footnote 16 Group identifications and the competition between groups for benefits such as power and status influence attitudes towards out-groups.Footnote 17 This group conflict perspective, often referred to as racial threat theory, contends that as the size of a racial minority group increases, competition between groups over scarce resources (such as political spoils or advantages in the housing and labour markets) results in heightened intergroup animosity. According to the theory, as the relative size of the ethnic minority population increases, so too does conflict over aspects of whites’ traditional privilege, which leads whites to become more racially hostile.
Numerous studies have provided evidence to support the claim that racial hostility increases as the relative size of a minority group in a given locality increases. These results have been obtained for different geographic units and at different times. One of the first political scientists to advance this thesis, V. O. Key, observed that it was in those counties in the American South where blacks comprised a high percentage of the population where whites were most ardent in upholding the institutions of white supremacy.Footnote 18 This basic finding has been replicated in the contemporary South,Footnote 19 in the rest of the United StatesFootnote 20 and in Europe.Footnote 21 However, this finding seems to depend on the size of geographic unit of analysis. Generally speaking, the larger the geographic unit employed by a study, the more likely it is that the findings are supportive of group conflict theory. This is problematic, because Voss demonstrates that the use of larger units may conceal important variation in local context.Footnote 22 Moreover, as Oliver and Mendelberg argue, ‘it is not self-evident that the black percentage in a geographic unit as large as a county or metropolitan area is a sufficient threat to any given privilege, much less all privileges.’Footnote 23 To measure collective threat accurately, studies must employ geographic units of analysis appropriate to the actual loci of group conflict, such as political jurisdictions or housing and labour markets.
This may mean that these rival hypotheses of contact and competition are not as incompatible as their proponents sometimes make them out to be. These two processes may be operating simultaneously, in opposite directions, but at different levels. Intergroup contact occurs at a personal level as an interaction between individuals that is made more or less probable by the relative concentration of the two groups in a given area. Given the degree to which urban areas are stratified along class, religious and/or racial lines, it is critical to measure intergroup contact at the smallest geographic level possible.Footnote 24 It is quite possible that in a geographic unit as large as a county there could be no interaction between majority group members and minority group members if each group lives within in its own separate space. Intergroup conflict, however, occurs between groups, each of which is assumed to be composed of individuals with more or less homogeneous interests, who compete with one another at the macro-level of housing or labour markets or a political system. While contact may be operationalized as the probability of a given individual interacting with a member of another group, which requires a small contextual unit, conflict needs to be assessed at the level appropriate to the site of group competition.
Research on racial hostility in england
The large-scale migration of non-white peoples to the United Kingdom in the 1950s and 1960s drew scholars’ attention to the question of how the British public felt about the new immigrants. Consistent with the contact hypothesis, some early studies found that the effect of direct, personal experience with the new immigrant groups served to reduce hostility towards non-whites.Footnote 25 Other studies suggested that scarcity in the local labour and housing markets had as much of an effect on its residents’ racial attitudes as did its ethnic composition.Footnote 26 Another issue raised by this early research concerned whether English whites distinguished between the various non-white immigrant groups. Although Hill claimed that ‘British people do not differentiate between the various immigrant groups from different parts of the tropical Commonwealth’,Footnote 27 the 1966 Survey of Race Relations provided mixed evidence on this point.Footnote 28 Moreover, respondents in the latter survey who reported contact with a non-white immigrant differed in their evaluation of this experience depending on the ethnic group with which the respondent was acquainted. Whites who had come into contact with West Indian immigrants by and large reported that the experience had left them more favourably disposed to West Indians as a group. However, respondents who were acquainted with Indian immigrants were evenly divided as to whether the encounter made them more or less favourable to Indians, and contact with Pakistanis prompted significantly more negative responses towards Pakistanis as a group than positive ones.Footnote 29
More recent research indicates that perceptions of racial threat exert an influence on whites’ racial attitudes. In their simultaneous equations analysis of racial prejudice in England, using data from the British Social Attitudes surveys from 1983 to 1991, Dustmann and Preston find that higher concentrations of ethnic minorities at the local level lead to more negative attitudes towards minorities.Footnote 30 Qualitative data from a 1998 focus group of Birmingham residents conducted by the Commission for Racial Equality is also supportive of the racial threat hypothesis.Footnote 31 The resentment that many whites in the focus group felt towards members of ethnic minority groups appeared to stem from two sources: their belief that ethnic minorities ‘were using resources – housing, education, health care – which rightly belonged to white people; and their perception that Asians, particularly Muslims, refused to integrate into the British way of life and insisted on maintaining their own cultures and beliefs’.Footnote 32 That is, perceptions of threat, both material and cultural, appear to underlie feelings of hostility towards ethnic minorities.
The present study builds on and expands upon this literature in several ways. First of all, the contextual data employed here allow for a more precise measurement of ethnic context than previous studies. The Census only began asking an ethnicity question in 1991, so earlier studies were forced to rely on country of birth statistics as proxies for ethnicity (for example, by assuming that people who were born in the countries of the New Commonwealth and Pakistan could be classified as ‘non-white’). As the proportion of the British ethnic minority population that was born in Britain has grown in recent decades, country of birth is an increasingly unreliable proxy for ethnicity. Moreover, measuring racial threat by the percentage non-white (directly or with a proxy) may conceal important variation in whites’ reactions to the various minority groups in a multiracial society. Since these groups often come from diverse cultural traditions and possess different socio-economic resources, it is not clear that whites would perceive them to be equally threatening or that whites would be equally likely to engage in the sorts of interpersonal contact that is said to reduce prejudice with members of the different groups. Consequently, it is essential to distinguish between disparate minority groups when measuring the ethnic composition of an area. An original feature of the contextual analyses reported in this article is that they disaggregate England’s ethnic minority population into its three largest component groups: blacks, Indians and Pakistanis/Bangladeshi.
The second unique contribution of this article is that I measure ethnic context at two geographic levels: the ward and the district. As argued above, the dynamics of contact and threat may be operating simultaneously with opposite effects on whites’ racial hostility, but their effects should be visible at different geographic levels of analysis. This article tests that possibility by estimating three-level models that estimate the effects of both ward-level and district-level contextual variables on individual-level attitudes. A final contribution of this study is that in addition to the measures of ethnic composition, I include a series of other contextual variables that capture other important elements of local context. Thus I am able to control for the effects of other contextual factors, such as local labour market conditions, the better to isolate the effects of racial context on whites’ racial attitudes.
Data and methods
This article tests the contact hypothesis and racial threat theory through multilevel analyses of whites’ racial attitudes, which are measured with national public opinion polls. Specifically, the survey data analysed in this article are from five years (1996, 1998, 1999, 2000 and 2001) of the British Social Attitudes survey (BSA), the 1997 British General Election Study (BGES) and the 2001 British Election Study (BES). The attention of this study is limited to whites living in England. That is, respondents from Wales and Scotland, as well as those who indicated a non-white racial background, are not included in these analyses. The survey respondents are matched to contextual data at the ward and district levels.Footnote 33 The surveys have been pooled in order to maximize the number of contextual units available for the contextual analyses described below. In all of the analyses, a set of dummy variables is included to indicate the year of the survey, in order to control for any potential differences between the surveys in the pooled sample.
Measures of Hostility Towards Racial and Ethnic Minorities
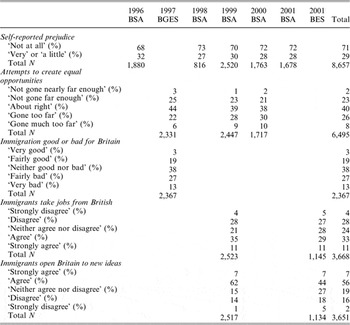
The dependent variable in this study is racial hostility. Racial hostility is conceptualized as a negative attitude towards members of a racial or ethnic minority group that is based on their membership in this group, and is measured by five items from the surveys. The first item asks, ‘How would you describe yourself … as very prejudiced against people of other races, a little prejudiced or not prejudiced at all?’ The second measure provides a more specific, policy-oriented measure of racial resentment, asking respondents, ‘whether you think attempts to give equal opportunities to black people and Asians in Britain have gone too far or not gone far enough’. The third question elicits an overall assessment of the effects of non-white immigration by having respondents assess whether ‘Immigration by black people and Asians has been’ good or bad for Britain. The fourth item asks respondents whether they agree or disagree with the statement, ‘immigrants take jobs away from people who were born in Britain’, tapping into whites’ perceptions of conflict with immigrants in the labour market. The final question relates to concerns about the cultural consequences of immigrants, asking respondents whether they agree or disagree with the statement, ‘immigrants make Britain more open to new ideas and cultures’. The Appendix contains full question-wording and details about how the responses were coded, as well as distributions of the responses by the year of survey.Footnote 34
Measures of Contact
Interracial contact is an individual-level phenomenon that takes place when two people of different races interact with one another. Actual observations of contact by survey respondents with members of other ethnic groups are not available, nor does the BSA or BES include a question to measure the frequency of such contact. Instead, I measure the likelihood of contact with aggregate data on the ethnic composition of a ward, the smallest geographical unit available for the survey respondents. While aggregate-level statistics are weak measures of the types of interaction necessary to increase racial tolerance, they do provide salient information concerning the opportunity of an individual to engage with people of another race. The greater the number of out-group members in an individual’s neighbourhood, the more likely it is that the individual will be exposed to the types of contact that are expected to increase tolerance.
The simplest measure of contact, then, is the relative size of the ethnic minority group population. Statistics from the 2001 Census are used to calculate the percentage of a ward’s population that is non-white, as well as the percentage from each of three ethnic minority groups: blacks (people who identified themselves as Black-Caribbean, Black-African or Black-Other); Pakistanis and Bangladeshis; and Indians.Footnote 35 The uneven distribution of the ethnic minority populations means that the opportunity for English whites to come into contact with members of non-white groups varies significantly between wards. While England as a whole is about 9 per cent non-white, half of the white respondents in the sample live in wards that are over 97 per cent white. In order to correct for the skewness of the data and to limit the potential influence of outliers on the estimated effects of these variables, these ethnic composition variables are transformed by taking their square roots. The contact hypothesis predicts that racial hostility will be negatively related to the relative size of a ward’s ethnic minority population.
However, even in a neighbourhood with a relatively large ethnic minority population, there will be little opportunity for intergroup contact if the white and ethnic minority groups are segregated from one another. Thus a more accurate measure would include not just the percentage from an ethnic minority group at the ward level but also some indicator of the group’s spatial distribution within the ward. The exposure index, P*, provides just such a measure of the potential contact between members of one group with members of another group within a neighbourhood. This statistic accounts for the relative size of the majority and minority groups within an area, as well as the spatial distribution of the groups within the area.Footnote 36 Although the ward is the smallest geographic unit available for the survey respondents, 2001 Census statistics are reported down to the output area level. Output areas are smaller units (typically about 150 households) that are nested within the wards (typically about 8,000 households). Thus it is possible to account for the degree of segregation between whites and ethnic minorities within the wards where the survey respondents live by looking at how these groups are distributed between the wards’ output areas.
I calculated P* for whites vis-à-vis each of the largest ethnic minority groups in Britain: blacks, Indians and Pakistani/Bangladeshis.Footnote 37 This statistic can take on a value from 0 to 1, and, intuitively, it can be thought of as the probability that a white person’s next-door neighbour is a minority group member. The value will increase both as the minority group’s share of the ward’s population increases and as the spatial isolation of whites within the ward declines. These statistics are highly skewed (i.e., in most wards the exposure indices between whites and each of the minority groups are very close to 0, while in a handful they are several standard deviations greater than the mean), so they have been transformed by taking their square roots. If the contact hypothesis is correct, then we would expect that, everything else being equal, whites living in neighbourhoods with high exposure to ethnic minority group members will exhibit less racial hostility than whites living in areas where exposure is low.
Measures of Racial Threat
Contextual measures are also employed to gauge whites’ perceptions of ‘threat’ from racial minority groups. As discussed above, the relative size of a minority group population within an area is often used as an indicator of this racial threat. Consequently, the first tests of racial threat theory, like the first tests of the contact hypothesis, rely on ward-level ethnic composition statistics: the percentage non-white, as well as the percentage black, the percentage Indian and the percentage Pakistani/Bangladeshi. Racial threat theory predicts that whites’ racial hostility will be highest in areas with relatively large ethnic minority group populations.
However, there are also inadequacies in relying on the percentage of ethnic minority residents in a ward as a measure of racial threat, just as there are in using it as an indicator of contact. First of all, conflict between ethnic groups frequently will spill over ward boundaries. In an urban area, competition over political power and economic interests between groups living in different neighbourhoods may be at least as intense as competition within a neighbourhood. In the English context, political conflict between ethnic groups is best assessed at the local authority level. Local authorities, or districts, are the smallest level of political administration in England. They typically have been left with the task of addressing the concerns of ethnic minorities and have responded with varying degrees of effort to combat racial inequalities.Footnote 38 Districts also overlap more closely with local housing and labour markets than do wards. For example, whites are likely to perceive just as much competition for jobs with ethnic minority residents who live across town as they do with those who live in their own neighbourhoods. Furthermore, while the importance of public sector housing has declined in recent years, many local councils still control a sizeable proportion of the housing stock. In their study of London’s East End, Dench, Gavron and Young have found that conflict over the allocation of such council housing is a key source of whites’ resentment towards Bangladeshi residents.Footnote 39 Additionally, local authorities can influence the local housing market in other ways, such as the distribution of home improvement grants and slum clearance programmes. The Ouseley Report, the official investigation into the 2001 riots in Bradford, found that government grants for urban regeneration have been awarded in a way that effectively requires different neighbourhoods within a city to compete against one another for these limited funds.Footnote 40 Given the level of segregation between ethnic groups in many cities, neighbourhood bids may easily be interpreted as zero-sum competition over material resources between ethnic groups. Consequently, it seems that the district is the most appropriate geographic level at which to gauge such ethnic conflict.
The second shortcoming of reliance on the relative size of a minority group in an area as a measure of racial threat has to do with the causal mechanism described by the theory. Racial threat theory contends that whites’ racial hostility results from an objective threat to their traditional privileges as a group. In other words, what whites are presumed to fear is a change to the status quo. As such, this threat stems not so much from the absolute size of the minority group but rather from its growth. As the relative size of the ethnic minority population increases, whites will perceive their share of political power and economic resources to be threatened. Consequently, this threat is best measured by the change in the relative size of the ethnic minority population. This is calculated by subtracting the percentage of a district’s population that identified with an ethnic minority group in the 1991 Census from the percentage of its population that identified with the group in the 2001 Census.Footnote 41 It is in districts where the population’s ethnic composition is changing the most that the status quo is subjected to the most pressure. As a result, whites’ racial hostility is expected to be the greatest in those districts where the percentage of the population from an ethnic minority group increased the most between 1991 and 2001.
Control Variables
In order to rule out the competing hypothesis that any observed contextual effects are explained by differences between the individual respondents living within the various wards and districts (i.e., compositional effects), individual-level variables are included in the analyses as control variables. These controls consist of a number of socio-economic and demographic variables, including year of birth, gender, education, occupational class, employment status, main source of income, homeownership status, trade-union membership, religious denomination and attendance at religious services.Footnote 42
To rule out the possibility that any observed effects of racial context on whites’ racial attitudes are due to other characteristics of the areas in which the survey respondents live, a variety of other contextual variables are included in the analysis. First of all, the average socio-economic status of a neighbourhood is measured by the average level of education in a ward. Local housing market conditions are measured by two district-level statistics: the change in the average house price and the homeownership rate. Two district-level variables are employed as measures of the state of the local labour market: the percentage of working-age residents not in paid employment and the percentage of the employed who work in the manufacturing sector. A final district-level variable accounts for the local crime rate.
Methods
The data analysed in this article are hierarchical in nature. That is, they consist of individual survey respondents who are nested within wards. These wards are further nested within districts. Consequently, multilevel modelling techniques are appropriate for the estimation of the effects of racial context (measured at the ward and district levels) on racial hostility (measured at the individual level). The multilevel model takes into account both between-group and within-group variance, estimating error terms at both the lower level and the higher level. This approach makes efficient use of all levels of the data in the calculation of cross-level effects and accurately estimates the standard errors.Footnote 43
The first models I present seek to explain the differences across wards in the average level of racial hostility and take the form of a two-level, random-intercept model.Footnote 44 This means that while the effects of the individual-level variables are assumed to be fixed across Level 2 units (for example, the effect of gender on respondents’ racial hostility is presumed to be the same in all wards), the average level of racial hostility is allowed to vary between wards. The random-intercept models can be written mathematically as Equations 1 and 2:


Equation 1 states that, for respondent i who lives in ward j, the value of the outcome variable (Yij) equals the sum of the intercept for ward j (β 0j), the product of the vector of p Level 1 coefficients (βp) and the values of the set of Level 1 independent variables (Xpij), and an error term (eij) unique to the respondent. Equation 2 states that the intercept for ward j (β 0j) is equal to the sum of the average intercept for all wards holding the independent variables constant (γ 00), the product of the q Level 2 coefficients (γ 0q) and the set of Level 2 predictors (Zqj), and the random deviation (u 0j) unique to the ward.
The second set of equations also consists of random-intercept models, but is three-level; that is, these equations take into account the fact that the wards, in which the respondents are nested, are nested within districts. Formally, they are written as Equations 3, 4 and 5:



Equations 3 and 4 are identical to Equations 1 and 2, respectively, with the exception that ward j, in which respondent i resides, is further nested within district k. Equation 5 states that the intercept for the district (γ 00k) is equal to the sum of the average intercept for all districts holding the independent variables constant (π 000), the product of the s Level 3 coefficients (π 00s) and the set of Level 3 predictors (Wsk), and the random deviation (r 00k ) unique to the district.Footnote 45
The analyses proceed in four stages. The first model follows the approach used by previous studies of the effects of racial context on racial hostility in England and tests both the contact hypothesis and racial threat theory using a single contextual variable, the percentage non-white in a ward. The second step expands on this preliminary analysis by disaggregating the non-white population into its three largest sub-groups and tests the two theories with separate ward-level variables for the percentage black, the percentage Indian and the percentage Pakistani/Bangladeshi. The third step is to test the contact hypothesis and racial threat theory simultaneously at two distinct geographic levels, the ward and the district, using the exposure index and the change in the relative size of the minority groups as described above. The final model includes a set of other contextual variables to test whether the observed effects of the various ethnic composition variables are spurious.
Results
The Effects of Ward-Level Ethnic Diversity on Racial Hostility
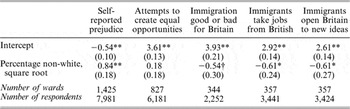
Table 1 summarizes the ward-level results of a two-level model of responses to each of the five measures of racial hostility.Footnote 46 Model I includes two ward-level parameters: the average ward-level intercept and the square root of the percentage non-white in a ward. The results of this model vary across the five dependent variables. Consistent with racial threat theory, self-reported prejudice appears to increase in association with the size of a ward’s non-white population. The percentage non-white is also positively related to opposition towards attempts to create equal opportunities, although this coefficient is not statistically significant. By contrast, there is a negative, statistically significant relationship between the percentage non-white in a ward and responses to the three questions about the effects of immigration, consistent with the contact hypothesis. Whites who live in areas with few non-whites are more likely to say that black and Asian immigration has been bad for Britain, that immigrants take jobs from the British-born and that immigrants do not make Britain more open to new ideas and cultures than are whites who live in more racially diverse neighbourhoods.
Ward-Level Results for Model I

Notes: Entries are logit coefficients; standard errors in parentheses. The model also includes individual-level control variables and dummy variables for year of survey.
**p < 0.01; *p < 0.05; †p < 0.10 for a 2-tailed test.
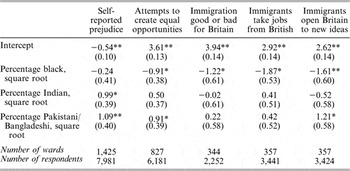
A more consistent pattern emerges, however, when the ethnic minority population is disaggregated into its three largest groups. Table 2 reports the results for Model II, which includes the square roots of the percentage black, the percentage Indian and the percentage Pakistani/Bangladeshi as predictors of the average level of racial hostility in a ward. Disaggregating the three largest ethnic minority groups reveals that residential proximity to each of the groups appears to have divergent effects on whites’ racial attitudes. Consistent with the contact hypothesis, the size of a ward’s black population is negatively related to each of the five measures of racial hostility. That is, whites who live in neighbourhoods with relatively large black populations are less likely to express negative attitudes towards ethnic minorities than whites who live in areas with few blacks. The estimated effect of the percentage black is statistically significant for every item except the self-reported prejudice question.
Ward-Level Results for Model II

Notes: Entries are logit coefficients; standard errors in parentheses. The model also includes individual-level control variables and dummy variables for year of survey.
**p < 0.01; *p < 0.05.
By contrast, the relationship between whites’ racial hostility and the percentage of a ward’s population that is Pakistani or Bangladeshi appears to conform to the predictions of racial threat theory. The estimated effect of the percentage Pakistani/Bangladeshi is positive for all five items, although the coefficients for the questions about the overall effect of non-white immigration and the economic effects of immigrants are not statistically significant. Respondents who live in neighbourhoods with high concentrations of Pakistanis and Bangladeshis are more likely than other whites to say that they are prejudiced, to oppose attempts to create equal opportunities and to disagree with the assertion that immigrants enhance Britain culturally.
The estimated effect of the percentage Indian in a ward lies between these two extremes in every case and it varies in direction from question to question. Residential proximity to Indians is positively related to three of the dependent variables (self-reported prejudice, attitudes towards equal opportunities initiatives and opinions about the economic effects of immigrants) and negatively associated with the other two (the evaluations of the overall effect of non-white immigration and the cultural consequences of immigrants). The relationship is statistically significant only for the self-reported prejudice question.
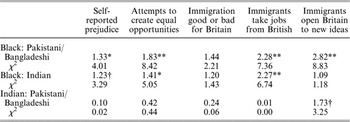
To test whether these differences between the estimated coefficients for each of the ethnic minority groups are due to chance, Table 3 presents the results of a Wald test of the null hypothesis that each of the three estimated coefficients is equal.Footnote 47 It is clear that the observed differences in the effects of the percentage black and the percentage Pakistani/Bangladeshi are not due to chance. For all of the dependent variables except the overall evaluation of non-white immigration, the difference between the estimated coefficients is statistically significant (p < 0.05). The difference between the estimated effect of the percentage black and that of the percentage Indian is significant for the questions about attempts to create equal opportunities and the economic effects of immigrants. The difference between the coefficients for the percentage Indian and the percentage Pakistani/Bangladeshi does not meet the 95 per cent confidence level for any of the questions.
Differences between Ward-Level Coefficients Estimated in Model II

**p < 0.01; *p < 0.05; †p < 0.10 for a Wald test distributed as chi-square with one degree of freedom.
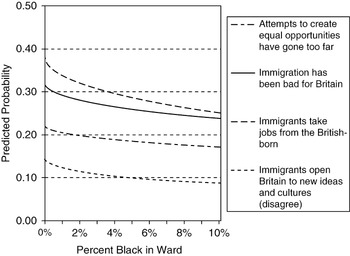
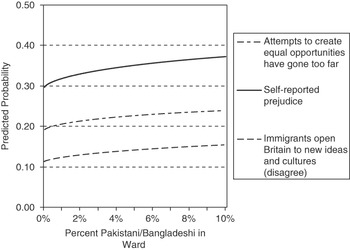
In order to illustrate the substantive meaning of the coefficients estimated in Model III, Figures 1 and 2 plot predicted values for the dependent variables against, in turn, the percentage black and the percentage Pakistani/Bangladeshi in a ward. The probabilities were calculated by varying the percentage of a ward’s population from the two ethnic minority groups with all other individual-level and ward-level variables held constant.Footnote 48Figure 1 displays how the likelihood of a typical respondent giving a racially hostile response varies according to the size of the ward’s black population. The predicted probabilities are displayed for the four items on which the percentage black has a statistically significant effect. The values represent the probabilities of a respondent stating that attempts to create equal opportunities for blacks and Asians have ‘gone too far’ or have ‘gone much too far’, that the immigration of blacks and Asians has been ‘fairly bad’ or ‘very bad’ for Britain, that she ‘agrees’ or ‘strongly agrees’ that immigrants take jobs from people born in Britain, and that she ‘disagrees’ or ‘strongly disagrees’ with the statement that immigrants make Britain more open to new ideas and cultures. As shown, even a small variation in the relative size of a neighbourhood’s black population has a substantial effect on whites’ racial attitudes. For example, the predicted probability of a respondent agreeing that immigrants take jobs from the British-born decreases from 0.38 if there are no black residents in a ward to 0.33 in a ward where blacks constitute 1 per cent of the population (about 75 per cent of the white respondents in the pooled sample live in a ward in which blacks comprise 1 per cent of the population or less). The likelihood of agreeing with this assertion declines further to 0.29 when the ward is 5 per cent black and to 0.25 if it is 10 per cent black (4 per cent of the respondents reside in a ward that is at least 10 per cent black). The estimated effect of the percentage black in a ward is also large for the question about the cultural consequences of immigrants. Comparing the extreme values on the graph, the likelihood of a typical respondent living in a ward that is 0 per cent black saying that immigrants do not enhance Britain culturally (0.14) is more than 50 per cent greater than that of a similar person living in a neighbourhood that is 10 per cent black (0.09). The predicted probabilities of a respondent saying that attempts to create equal opportunities have gone too far or that non-white immigration has been bad for Britain do not decline quite as steeply in association with increases in the percentage black, but the relationship is still fairly strong.
Predicted probability of racial hostility by percentage black in ward

Predicted probability of racial hostility by percentage Pakistani/Bangladeshi in ward

Figure 2 plots the predicted probability of a racially hostile response for a typical respondent while varying the relative size of a ward’s Pakistani/Bangladeshi population for the three dependent variables on which this independent variable has a statistically significant effect. The slopes are of a similar magnitude as those of the percentage black, although in the opposite direction. The largest estimated effect is seen for opinions about the cultural consequences of immigrants: the likelihood of disagreeing with the statement that immigrants enhance Britain culturally is 0.11 for a respondent living in a ward that is 0 per cent Pakistani/Bangladeshi, 0.13 for a ward that is 1 per cent Pakistani/Bangladeshi, and 0.16 for a ward that is 10 per cent Pakistani/Bangladeshi. (About 75 per cent of respondents live in a ward where Pakistanis and Bangladeshis comprise less than 1 per cent of the residents, and 3 per cent live in a ward that is at least 10 per cent Pakistani/Bangladeshi.) There is also a strong relationship between the relative size of the Pakistani/Bangladeshi population and the predicted probability of self-reported prejudice and opposition to equal opportunities initiatives. For a respondent living in a neighbourhood with no Pakistani or Bangladeshi residents, there is a likelihood of 0.30 of her saying that she is prejudiced and of 0.19 that attempts to create equal opportunities have gone too far. This compares with likelihoods of 0.37 and 0.24, respectively, for a respondent living in a ward that is 10 per cent Pakistani/Bangladeshi.
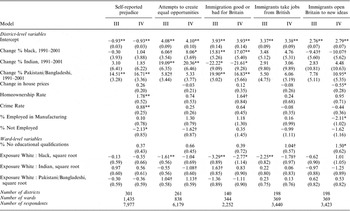
Three-Level Models
To test the proposition that the dynamics of intergroup contact and racial threat are operating simultaneously, in opposite directions, but at different geographic levels, Model III estimates the effects of the more specific measures of racial threat and intergroup contact on whites’ racial attitudes. This model estimates parameters at the individual level, ward level and district levels, and the ward-level and district-level results are reported in Table 4. Although the results do not provide conclusive evidence that the dynamics of threat and contact are operating on different levels, they do provide some indication that this is the case. The estimated effects of the change in the relative size of each of the ethnic minority groups at the district level are generally consistent with the predictions of racial threat theory. Twelve of the fifteen estimated coefficients are positive, indicating that whites who live in districts where ethnic minority groups are growing rapidly tend to display more racial hostility than whites who live in areas where the ethnic balance changed little between 1991 and 2001. At the same time, the contact hypothesis finds some modest support in the ward-level results. Nine of the fifteen coefficients estimating the effect of the exposure index between whites and ethnic minorities on racial hostility are negative.
Ward-Level and District-Level Results for Models III and IV

Notes: Entries are logit coefficients; standard errors in parentheses. The model also includes individual-level control variables and dummy variables for year of survey.
**p < 0.01; * p < 0.05; †p < 0.10 for a 2-tailed test.
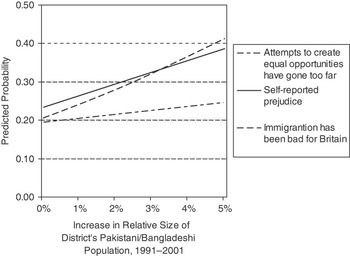
Once again, though, the predictions of neither racial threat theory nor the contact hypothesis find consistent support across all three ethnic minority groups. At the district level, the effects of changes in the relative size of the Indian or black populations vary from question to question; most of the coefficients are positive, but some are negative, contrary to the predictions of racial threat theory. However, the estimated effect of the change in the relative size of a district’s Pakistani/Bangladeshi population on racial hostility is positive for all five items. The estimated effect of the increase in the size of a district’s Pakistani/Bangladeshi population is particularly large for the self-reported prejudice question and attitudes about the overall effect of non-white immigration. To illustrate the magnitude of these effects, Figure 3 plots the predicted probability of a racially hostile response for the three items on which this variable had a statistically significant effect (holding the other contextual-level and individual-level variables constant at a baseline, as described above). The predicted probability of a typical respondent saying that she is ‘very’ or ‘a little prejudiced’ increases from 0.24 if she lives in a district where the Pakistani/Bangladeshi population did not increase in relative size from 1991 to 2001, to 0.26 if it grew by 1 percentage point, and to 0.39 if it grew by 5 percentage points (approximately 90 per cent of white respondents in the pooled sample lived in a district where the Pakistani/Bangladeshi did not increase by more than 1 percentage point; about 1 per cent of the respondents lived in a district where this population grew by at least 5 percentage points). Similarly, the probability of a typical respondent saying that non-white immigration has been ‘bad’ or ‘very bad’ for Britain increases from 0.21 in a district with no change in the relative size of the Pakistani/Bangladeshi population, to 0.24 in a district with 1 a percentage point increase, and to 0.40 in a district with a 5 point growth. The estimated effect on attitudes about equal opportunities initiatives is also statistically significant, but the slope is much smaller.
Predicted Probability of Racial Hostility by Increase in Relative Size of District’s Pakistani/Bangladeshi Population, 1991–2001

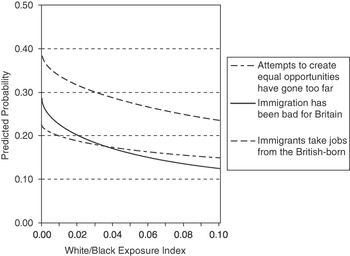
At the same time, the ward-level findings provide some support for the contact hypothesis. Contrary to expectations, the indices measuring the neighbourhood-level exposure of whites to Indians or to Pakistanis and Bangladeshis vary in direction between the dependent variables. However, the estimated effect of the white/black exposure index is negative for all five dependent variables, and it is statistically significant for three of them. Whites who live in neighbourhoods in which there is little opportunity for interaction with blacks are more likely to oppose attempts to create equal opportunities, to say that non-white immigration has been bad for Britain, and to agree that immigrants take jobs from people born in Britain than respondents who have more black neighbours. Figure 4 plots the predicted probabilities for racially hostile responses to these questions, varying the white–black exposure index while holding all other variables constant. The likelihood of agreeing that immigrants take jobs from the British-born declines from 0.39 in a ward where there is no opportunity for contact with black neighbours to 0.33 where the exposure index is 0.01, and to 0.24 in a ward where the probability that a white person’s next-door neighbour is a black person is 0.10 (nearly 75 per cent of white respondents live in a ward where the exposure index is less than 0.01; about 5 per cent live in a ward where the exposure index is at least 0.10). The estimated effect on overall evaluations of non-white immigration is even sharper. The probability of a typical respondent saying that immigration has had negative effects on Britain declines from 0.29 to 0.22 to 0.12, respectively, as the white–black exposure index increases from 0.00 to 0.01 to 0.10. The estimated effect on attitudes towards equal opportunities initiatives is not as strong, but is still substantial.
Predicted probability of racial hostility by white–black exposure index

The results of Model III help to account for the differences between the estimated effects of the percentage black and the percentage Pakistani/Bangladeshi observed in Model II. The positive relationship between the relative size of a ward’s Pakistani/Bangladeshi population and racial hostility appears to be due to changes in the ethnic balance at the district level. On one hand, while whites living in districts where the Pakistani/Bangladeshi population grew the most between 1991 and 2001 were more hostile towards ethnic minorities and immigrants than other respondents, it does not appear that the likelihood of a respondent coming into contact with a Pakistani or Bangladeshi person in her neighbourhood has any consistent effect on her racial attitudes. On the other hand, it does appear that the negative association between the percentage black in a ward and racial hostility observed in Model II is due to differences in the likelihood of intergroup contact. Respondents who live in wards where they are likely to encounter blacks in their everyday activities are less hostile towards ethnic minorities than whites who have few black neighbours. Thus, it appears that the contact hypothesis provides a reasonable explanation for the negative relationship observed between the percentage black and whites’ racial hostility, while the dynamics of racial threat appear to account for the positive association between the relative size of a locality’s Pakistani/Bangladeshi population and hostility towards ethnic minorities.
An alternative explanation is that the observed effects of the ethnic composition variables on whites’ racial attitudes are really the product of other characteristics of the local environment. For example, as described earlier, it may be that local economic conditions, not racial context, are at the root of whites’ hostility towards ethnic minorities. To evaluate this issue, Model IV adds the full set of ward-level and district-level control variables to the measures of racial threat and intergroup contact included in Model III. The inclusion of these additional variables does not alter the district-level coefficients estimated in Model III in any consistent way. The positive association between changes in the percentage Pakistani/Bangladeshi in a district and racial hostility found in Model III does not appear to be the result of other characteristics of the contextual units. The inclusion of the additional contextual variables, on the whole, also has little impact on the estimated effects of ward-level exposure between whites and each of the three ethnic minority groups. Small differences in results occur, but in general the positive effects of residential proximity to blacks are still found when the other contextual variables are included. As in Model III, the estimated effects of ward-level exposure to the Indian and Pakistani/Bangladeshi groups do not display a consistent relationship with the measures of racial hostility.
Turning briefly to the other contextual variables, the district-level home-ownership rate and the percentage of the ward’s adult population with no formal educational qualifications both display positive associations with all five measures of racial hostility. Hostility to ethnic minorities and immigrants is greater amongst whites living in districts with a higher than average home-ownership rates and in neighbourhoods where the average level of education is relatively low. The former variable has statistically significant effects on the questions about self-reported prejudice and the overall evaluation of non-white immigration, while the latter has significant effects on the items relating to the economic and cultural consequences of immigrants. None of the other contextual variables displays a consistent relationship with the five measures of racial hostility.
Discussion
The findings reported in this article clearly reveal that aggregating dissimilar ethnic minority groups into a monolithic ‘non-white’ category can conceal important differences in the structure of intergroup relations. Looking only at the effect of the percentage non-white in a ward on racial hostility provided mixed results for the contact hypothesis and racial threat theory. However, by disaggregating the non-white population into its three largest component groups, it was found that white survey respondents seem to react very differently to the concentration of each of the largest ethnic minority groups in England. Consistent with the contact hypothesis, an increased likelihood of residential contact with blacks appears to be associated with lower hostility among whites. At the same time, residential proximity to Pakistanis and Bangladeshis is found to be related to higher levels of racial hostility, in accordance with the predictions of racial threat theory. These results underscore that proximity should be seen as an opportunity for meaningful social interactions between members of different groups but is no guarantor of prejudice-reducing intergroup contact.Footnote 49 Moreover, they indicate that majority group members may not view all minority groups as equally ‘threatening’ to their group status.
The interpretation of these estimated effects of ethnic composition on whites’ racial hostility is complicated, however, by the potential for self-selection. While the ethnic composition of an individual’s neighbourhood may affect his attitudes towards ethnic out-groups, his attitudes towards these out-groups are also likely to affect the ethnic composition of his neighbourhood. One clear possibility is ‘white flight’, whereby the most racially intolerant whites move out of a neighbourhood in response to increasing numbers of ethnic minority residents. Similarly, it is likely that, given the choice, ethnic minorities will not move into areas populated by the most racially hostile whites. In either scenario described above, there would be a negative correlation between the non-white percentage of a locality and the level of racial hostility displayed by its white residents, irrespective of the effects of any actual interracial contact. Dustmann and Preston’s simultaneous equation analyses of BSA data indicate that there is such a simultaneity bias, which results in negatively-biased estimates of the effects of ethnic minority composition on whites’ racial attitudes.Footnote 50
Nonetheless, the potential for self-selection does not appear to explain the differences in the estimated effects of residential proximity to the black and Pakistani/Bangladeshi groups reported here. If there is a simultaneity bias, all of the estimated coefficients should be biased in the same direction. Residential selection based on prior racial attitudes could account for the divergent effects only if whites’ racial attitudes have a greater effect on the percentage black in their neighbourhoods than on the percentage Pakistani and Bangladeshi. If anything, though, it should be easier for whites to avoid living in areas with high concentrations of Pakistani and Bangladeshi residents, because this group is more highly segregated from the white population than is the black group.Footnote 51 Furthermore, these higher levels of segregation, at least in part, reflect an element of choice that indicates that many Pakistanis and Bangladeshis in England prefer to live in ethnically distinctive communities.Footnote 52 Without attempting to determine how much of this segregation is due to choice and how much is the result of structural constraints and discrimination, it seems that ethnic considerations, including the level of racial hostility among the local white population, are likely to influence the housing choices of Pakistanis and Bangladeshis at least as much as those of blacks. Consequently, the simultaneity bias caused by residential self-selection cannot account for the observed differences in the effects of residential proximity to these two groups on whites’ racial attitudes.
What the three-level models reported in this article do suggest is that the dynamics of contact and threat may be working simultaneously, but are visible at different geographic levels of aggregation. These findings are particularly interesting in the light of the analysis of British Household Panel data conducted by Johnston and his colleagues.Footnote 53 They examine the effects of neighbourhood context measured simultaneously at two geographic levels: households living within 250 metres of the respondent’s home and households within 2,000 metres. They find that ethnic diversity at the smaller geographic level of aggregation had a positive effect on support for the Labour party in the 1992 and 1997 general elections, while ethnic diversity at the larger geographic level had a negative effect. This finding lends support to the results reported here that ethnic composition can have divergent effects at different geographic levels.Footnote 54 It also underscores the political importance of the three-level models reported here. To the extent that the experience of living amidst ethnic diversity has provoked hostile reactions amongst England’s white population, it has not done so amongst those whites who are most likely to come into contact with minority group members in their daily lives. In particular, Model III shows that while racial hostility is greatest in districts where the Pakistani and Bangladeshi population is large and growing, within those cities it is not necessarily those whites who have Pakistani or Bangladeshi neighbours who are the most hostile towards ethnic minorities.
Nonetheless, even this more accurate specification of the contact and racial threat hypotheses does not provide consistent support for either theory. Specifically, it does not explain why the contact hypothesis seems to hold true for white–black interactions but racial threat theory best characterizes the effects of Pakistani/Bangladeshi concentration on whites’ racial attitudes. An alternative explanation is that the effects of ethnic context are really spurious, and other characteristics of the areas in which whites live account for the variation in racial hostility across localities. For example, the concentration of Britain’s Pakistani population in economically deprived cities in northern England means that circumstances of economic deprivation might be behind white’s hostility towards racial out-groups. By and large, however, the inclusion of a variety of measures of district-level economic circumstances did not attenuate the apparent effects of the measures of intergroup contact and racial threat. Racial context affects whites’ racial attitudes even after controlling for local material conditions, and the effects continued to differ between the ethnic minority groups. Two remaining explanations for the divergent effects of whites’ residential proximity to blacks and Pakistanis/Bangladeshis emphasize the cultural characteristics of these groups and the timing of their settlement in England.
The pessimistic interpretation of the findings reported here is that cultural differences prevent whites from engaging in the sorts of social interactions with Pakistanis and Bangladeshis that would serve to reduce intergroup animosity. Immigrants from the Caribbean, on average, were more similar culturally to the native white population than were the South Asian migrants, especially those from the predominantly-Islamic societies of Pakistan and Bangladesh. The language, religion and family structure of the West Indian migrants more closely resembled that of the white, working-class communities in which the vast majority of immigrants to England settled. It may be that these similarities are necessary for prejudice-reducing contact to occur, while cultural differences may prevent meaningful social interactions from taking place between members of disparate groups despite residential proximity. Moreover, recent research on attitudes towards ethnic minorities and immigrants in Europe demonstrates that feelings of cultural threat are important sources of hostility, more so than perceptions of economic threat.Footnote 55 It may be the case that whites’ living in districts with large and growing Pakistani/Bangladeshi populations perceive this group as violating traditional English norms and ways of life. From this perspective, spatial integration, absent social and cultural integration, only serves to promote racial hostility.
A more optimistic take on these results, however, would note that the predictive power of the contact hypothesis seems to vary according to the length of time that a minority group has been established in England. Blacks are the longest-established of the non-white groups, while Pakistanis and Bangladeshis, on average, are the most recent arrivals. It is also important to note that the Pakistani/Bangladeshi population in Britain today is exceptionally youthful. According to the 2001 Census, 55 per cent of Pakistanis and Bangladeshis in England and Wales are 24 years old or younger, compared with 39 per cent of both the black and Indian groups, and 30 per cent of whites. The age structure of the British-born Pakistani/Bangladeshi population is even younger. It is likely that the potential for meaningful social interactions to occur between white adults and members of an ethnic minority group will be greatest among these second-generation and third-generation members of the minority group. Consequently, the opportunities for whites to experience positive, prejudice-reducing contact with Pakistanis/Bangladeshis will be expected to increase as the British-born segment of this latter group grows. In short, this perspective would contend that time is on the side of the contact hypothesis.
To adjudicate between these alternative interpretations of the findings reported in this article, more research is clearly needed. For one thing, the results are confined to a limited time frame. Since the survey data analysed here were collected, events such as the riots in many cities in northern England, the terrorist attacks in New York, a divisive war in Iraq and suicide bombings in London by Britons of immigrant descent undoubtedly have changed English public opinion on issues of race, ethnicity and immigration. Anti-Muslim sentiment, in particular, seems to have strengthened as a result. Related to this, the survey data employed in this study are limited by the fact that they address rather vague out-groups such as ‘blacks and Asians’ and ‘immigrants’. Survey questions that ask about specific ethnic minority groups are necessary to assess the degree of hostility which whites in England direct at each of these groups. More broadly, the findings of this article suggest that theories of racial conflict developed in the context of the biracial mid-twentieth century American South do not apply neatly to multiracial and multicultural societies like contemporary England. In particular, the proposition suggested here – that the effect of the spatial proximity to minority group members on majority group members’ intergroup attitudes varies according to the degree to which the minority group is socially integrated – needs to be tested through the comparative study of racial and ethnic conflict.
Appendix: Variable descriptions and coding
Racial Attitudes
Self-rated prejudice: ‘How would you describe yourself … as very prejudiced against people of other races, a little prejudiced or not prejudiced at all?’
Very few respondents (about 2 per cent of the pooled sample) stated that they were ‘Very prejudiced’, so this item was transformed into a binary variable, coded 1 if a respondent answered ‘Very prejudiced’ or ‘A little prejudiced’ and 0 if ‘Not prejudiced at all’.
Attempts to create equal opportunities: ‘Please use this card to say whether you think attempts to give equal opportunities to black people and Asians in Britain have gone too far or not gone far enough.’
Respondents placed themselves on a five-point scale, which was recoded such that a score of 0 means that the respondent thought the attempts had ‘Not gone nearly far enough’, 1 that they had ‘Not gone far enough’, 2 that they were ‘About right’, 3 that they had ‘Gone too far’, and 4 that they had ‘Gone much too far’.
Immigration good or bad for Britain: ‘Has immigration by black people and Asians been… very good for Britain, fairly good, neither good nor bad, fairly bad, or very bad for Britain?’
Respondents placed themselves on a five-point scale, which was recoded such that a score of 0 means that the respondent said that immigration had been ‘Very good for Britain’, 1 that it had been ‘Fairly good’, 2 that it had been ‘Neither good nor bad’, 3 that it had been ‘Fairly bad’, and 4 that it had been ‘Very bad for Britain’.
Immigrants take jobs from British: ‘Please indicate whether you agree or disagree with each of the following statements … Immigrants take jobs away from people who were born in Britain’.
Respondents placed themselves on a five-point scale, which was recoded such that a score of 0 means that the respondents ‘Strongly disagree’, 1 that they ‘Disagree’, 2 that they ‘Neither agree nor disagree’, 3 that they ‘Agree’, and 4 that they ‘Strongly agree’.
Immigrants open Britain to new ideas: ‘Please indicate whether you agree or disagree with each of the following statements … Immigrants make Britain more open to new ideas and cultures’.
Respondents placed themselves on a five-point scale, which was recoded such that a score of 0 means that the respondents ‘Strongly agree’, 1 that they ‘Agree’, 2 that they ‘Neither agree nor disagree’, 3 that they ‘Disagree’, and 4 that they ‘Strongly disagree’.
Racial Hostility by Year of Survey

Individual-level Control Variables
Year of birth: Year of birth was calculated by subtracting the respondent’s age from the year of the survey. The variable was recoded into six dummy variables that indicate whether a respondent was born in 1929 or earlier, between 1930 and 1939, between 1940 and 1949, between 1950 and 1959, between 1960 and 1969, or since 1970. The 1940–49 birth cohort is the baseline category for all of the models.
Gender: The dummy variable for gender is coded 1 if a respondent is female (the baseline category), 0 if the respondent is male.
School-leaving age: Respondents are grouped in three education categories, according to the age at which they left formal education. Respondents who left school before the age of 16 are given the lowest score (0) and respondents who continued in formal education until the age 18 or beyond are given the highest score (2). The baseline category (1) represents someone who left school at age 16 or 17.
Highest degree earned: The second measure of education is a dummy variable coded 1 if the respondent has a university-level or professional qualification, 0 if she does not (the baseline category).
Occupational class: A series of dummy variables classifies respondents according to their most recent job into the five categories of the compressed occupational classes: the salariat, routine non-manual workers, the petty bourgeoisie, manual foremen and supervisors, and the working class. The routine non-manual class is the baseline category.
Employment status: This dummy variable is coded 1 if the respondent is employed or is unemployed and actively seeking a job (the baseline category), 0 if she is not economically active.
Main source of income: This indicator is coded 1 if the respondent reports that the main source of income for her household is a state benefit (not including state retirement pension), and 0 if the household relies primarily on another source of income (the baseline category).
Homeownership status: This dummy variable is coded 1 if the respondent’s household owns the home she lives in (the baseline category), 0 if it does not.
Union Membership: This dummy variable is coded 1 if the respondent is a member of a trade union or staff association, 0 if she is not (the baseline category).
Religious denomination: A series of dummy variables indicates whether the respondent identifies with the Church of England, the Roman Catholic Church, another Christian denomination, a non-Christian denomination, or with no religious denomination (the baseline category).
Attendance of religious services: This variable measures the frequency that the respondent reports attending religious services (not including special occasions such as weddings). The variable is coded 0 if the respondent reports that she never attends religious services (the baseline category), 1 if she attends them occasionally, and 2 if she attends at least once every week. Because this was not asked in the 2001 BES, this variable is not included in the analyses of the survey items about the economic and cultural consequences of immigrants.
Contextual-level Control Variables
Average level of education in a ward: This variable is calculated from 2001 Census statistics as the proportion of the ward’s population aged 16 to 74 that possesses no formal educational qualifications.
Change in average house price: This is measured as the change in median house prices in a district between 1996 and 2001, which is calculated from housing price data collected by the Land Registry.
Homeownership rate: The homeownership rate is calculated from 2001 Census statistics and it represents the proportion of a district’s population living in a household that owns its home.
Percentage not employed: This variable indicates the proportion of a district’s residents aged 16–74 who are not in paid employment, calculated from the 2001 Census.
Percentage employed in manufacturing: Also taken from the 2001 Census, this variable represents the proportion of a district’s employed residents whose jobs are in the manufacturing sector.
Crime rate: The measure of the local crime rate used in this article is taken from the 2000/2001 Local Authority Performance Indicators, and it represents the number of crimes per 10 residents for a district in the year 2000.