Introduction
Establishing the intraspecific variation of organisms is of utmost importance for taxonomy, which in turn forms the foundation of many paleobiological analyses. In extinct animals, phenotypic traits, which at least partially reflect aspects of their genotype, have been used to examine intraspecific variation. Phenotypic variation, however, is frequently overlooked or underestimated when a new taxon is introduced, which often results in oversplitting (De Baets et al. Reference De Baets, Klug and Monnet2013, Reference De Baets, Bert, Hoffmann, Monnet, Yacobucci and Klug2015). This may cause a bias when assessing biodiversity, biostratigraphy, or biogeography (Kennedy and Cobban Reference Kennedy and Cobban1976; Dzik Reference Dzik1985, Reference Dzik1990; Hughes and Labandeira Reference Hughes and Labandeira1995; Nardin et al. Reference Nardin, Rouget and Neige2005; Korn and Klug Reference Korn and Klug2007; Monnet et al. Reference Monnet, Bucher, Wasmer and Guex2010; De Baets et al. Reference De Baets, Klug and Monnet2013). For example, incomplete knowledge of variation may introduce a bias when studying taxonomic richness using databases such as the Paleobiology Database (PBDB; e.g., Bush and Bambach Reference Bush and Bambach2015) for classical biodiversity curves through geologic times (e.g., Sepkoski et al. Reference Sepkoski, Bambach, Raup and Valentine1981).
Ectocochleate cephalopods (nautiloids, bactritids, ammonoids) are an ideal group for studying intraspecific variation through ontogeny because of their accretionary growth, which, as in other shelled mollusks, records their life history. Ammonoids are an equally well-known and well-studied extinct group of cephalopods widely regarded as being of great importance for biostratigraphy and also for diversity studies (Kennedy Reference Kennedy1977, Reference Kennedy1989; House Reference House1981, Reference House1985; Kennedy and Wright Reference Kennedy and Wright1985; House and Kerr Reference House and Kerr1989; Korn et al. Reference Korn, Klug and Walton2015). Although efforts have been made to better understand intraspecific variation (e.g., Tanabe and Shigeta Reference Tanabe and Shigeta1987; Korn and Klug Reference Korn and Klug2007; Monnet et al. Reference Monnet, Bucher, Wasmer and Guex2010; Bert Reference Bert2014; Jattiot et al. Reference Jattiot, Bucher, Brayard, Monnet, Jenks and Hautmann2015), the taxonomy of ammonoids is still suffering from a lack of robustness regarding their taxonomic richness (e.g., Hohenegger and Tatzreiter Reference Hohenegger and Tatzreiter1992; Dagys and Wetschat Reference Dagys and Wetschat1993; De Baets et al. Reference De Baets, Klug and Monnet2013, Reference De Baets, Bert, Hoffmann, Monnet, Yacobucci and Klug2015). Furthermore, in many studies dealing with intraspecific variation, the number of specimens is too low to yield data statistically sufficient to examine intraspecific variation through ontogeny (Haas Reference Haas1946; Palframan Reference Palframan1966; Crick Reference Crick1978; Courville and Crônier Reference Courville and Crônier2005). As far as fossil nautiloids are concerned, only a very limited degree of attention has been paid to intraspecific variation (e.g., Dzik Reference Dzik1984; Wani and Ayyasami Reference Wani and Ayyasami2009), which may cause an overestimation of their diversity (Tajika et al. Reference Tajika, Kürsteiner, Pictet, Lehmann, Tschanz, Jattiot and Klug2017).
Nautilus is an extant genus of ectocochleate cephalopods that has been widely used as a modern analogue for extinct ammonoids (for a critical opinion, see Jacobs and Landman Reference Jacobs and Landman1993). Although research on taxonomy and morphological variation of Nautilus has been carried out intensively by paleontologists (Tanabe et al. Reference Tanabe, Hayasaka, Saisho, Shinomiya and Aoki1983, Reference Tanabe, Hayasaka and Tsukahara1985, Reference Tanabe, Tsukahara and Hayasaka1990; Swan and Saunders Reference Swan and Saunders1987; Tanabe and Tsukahara Reference Tanabe and Tsukahara1995), the patterns of ontogenetic intraspecific variation of their main conch parameters were largely unknown. In fact, some biologists suggested that some of the established morphospecies of Nautilus need to be synonymized based on their genetic similarities (Wray et al. Reference Wray, Landman, Saunders and Bonacum1995; Bonnaud et al. Reference Bonnaud, Ozouf-Costaz and Boucher-Rodoni2004; Sinclair et al. Reference Sinclair, Briskey, Aspden and Pegg2007; Vandepas et al. Reference Vandepas, Dooley, Barord, Swalla and Ward2016).
As far as fossil organisms are concerned, studies on intraspecific variation often suffer from problems introduced by time averaging (Kidwell Reference Kidwell2002). Thus, an in-depth knowledge of an extant representative is key to better understanding intraspecific variation of extinct relatives. Enhanced knowledge of conch morphology of Nautilus may then serve as a reference to fossil nautiloids and ammonoids as well. In this study, we aim to answer the following questions: (1) What is the phenotypic intraspecific variation of extant Nautilus? (2) How does intraspecific variation change through ontogeny? (3) Does intraspecific variation differ between populations? (4) Is the pattern of intraspecific variation of Nautilus similar to or different from other cephalopods?
Materials and Methods
Conchs of 93 specimens of extant Nautilus pompilius were scanned at the Laboratory of Physical Anthropology of Kyoto University using a 16–detector array computed tomography (CT) device (Toshiba Alexion TSX-032A) with the following data-acquisition and image-reconstruction parameters: beam collimation: 1.0 mm; pitch: 0.688; image-reconstruction kernel: sharp (FC30); slice increment: 0.2 mm; tube voltage and current: 120 kV and 100 mA. This resulted in volume data sets with a spatial resolution of 0.331*0.331*0.200 mm. The specimens consisted of populations from three different geographic regions with different average conch diameter:
-
1. Nautilus pompilius from the Tagnan area of the Philippines (n=35 [adult males: n=12; adult females: n=9; juveniles: n=14]). Thirty specimens were previously examined by Tajika et al. (Reference Tajika, Morimoto, Wani, Naglik and Klug2015). Data of additional 5 specimens were produced for this study. The average conch diameter of adult specimens was 169 mm with a standard deviation of 24.5.
-
2. Nautilus pompilius from Semporna, Malaysia (n=38 [adult males: n=26; adult females: n=12]). The average conch diameter was 198 mm with a standard deviation of 4.2. The average conch diameter is much larger than that of the commonly known N. pompilius. The adult size was rather similar to that of the controversial morphospecies of N. belauensis (Saunders Reference Saunders1987; Vandepas et al. Reference Vandepas, Dooley, Barord, Swalla and Ward2016). In this study, we regard this population as a representative of N. pompilius with a large conch diameter.
-
3. Nautilus pompilius from Borneo, Indonesia (n=20 [adult males: n=11; adult females: n=8; probably male juvenile: n=1]). The average conch diameter was 167 mm with a standard deviation of 10.8.
Conchs of males and females were identified based on the aperture shape: mature males have larger shells and a broader, rounder aperture than females (e.g., Saunders and Spinosa Reference Saunders and Spinosa1978). All the examined shells were bought from a fisherman or a shell dealer in the years between 2010 and 2012.
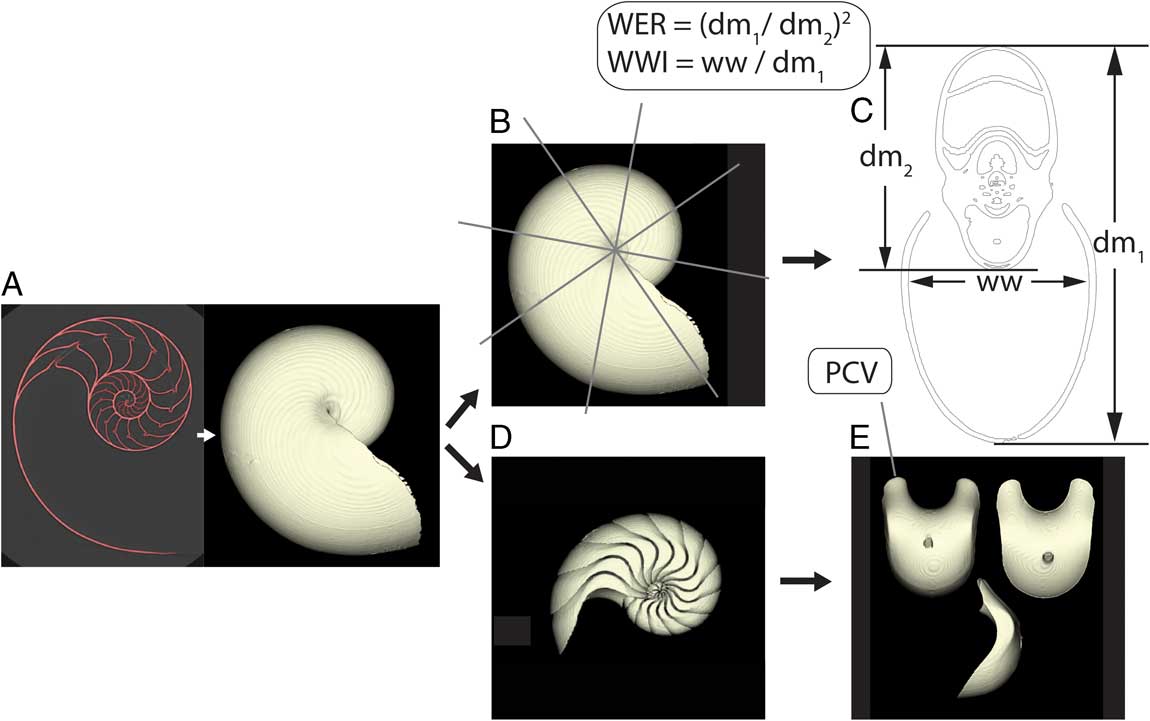
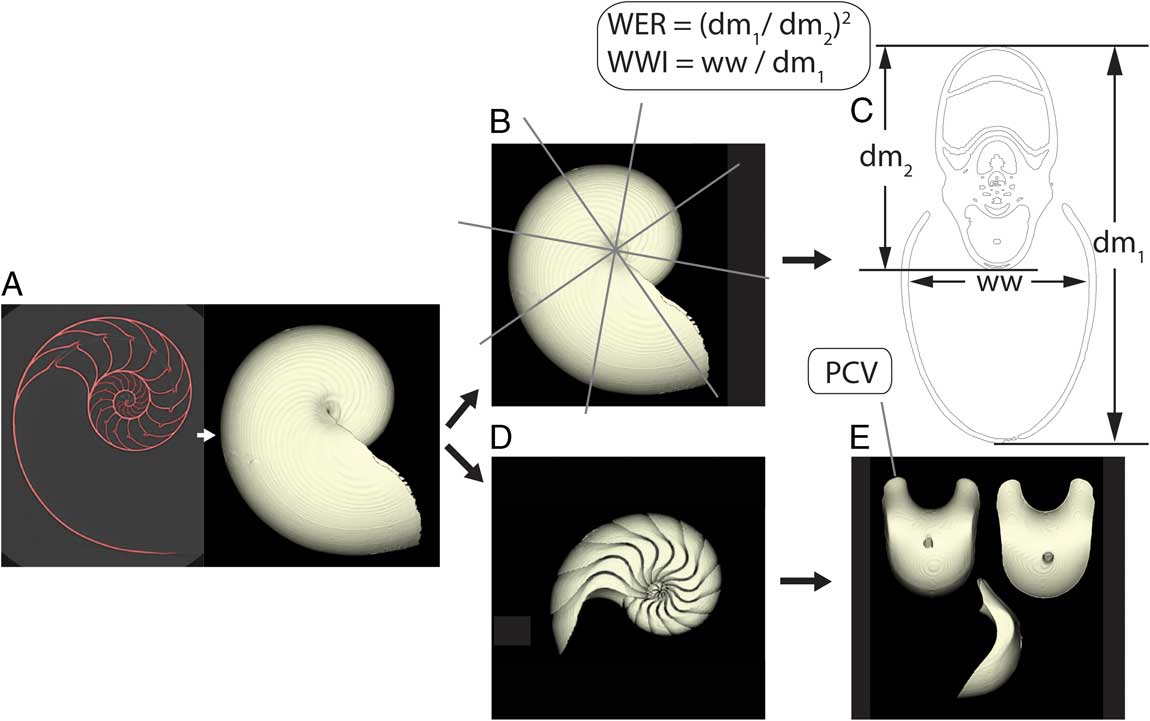
The obtained data sets were segmented on Avizo® 8.1 (FEI Visualization Sciences Group). The segmented data were then exported as STL files in order to perform 3D morphometry in Matlab, Version 8.5 (MathWorks). The STL files were used to produce cross sections every 45°, which yielded about 16 sets of measurements with different growth stages per specimen. On the produced cross section, the three parameters, conch diameter (dm1), the diameter of the preceding whorl (dm2), and the whorl width (ww) were measured (Fig. 1). Individual phragmocone chamber volumes (PCV) were also extracted with the method applied in Tajika et al. (Reference Tajika, Morimoto, Wani, Naglik and Klug2015; Fig. 1). As discussed and demonstrated by Hoffmann et al. (Reference Hoffmann, Schultz, Schellhorn, Rybacki, Keupp, Gerden, Lemanis and Zachow2014) and Tajika et al. (Reference Tajika, Morimoto, Wani, Naglik and Klug2015), scans of specimens do not retain their original volumes, mainly due to the partial volume effect (PVE). The effect of PVE was controlled by using the same scanner, standardizing the spatial resolution (0.331*0.331*0.200 mm), and keeping the same orientation and position of conch and umbilicus for every specimen. This procedure contributed to equalizing the contrast difference of the innermost thin septa and outer thick septa between scans. Also, to minimize errors occurring from segmentation (Hoffmann et al. Reference Hoffmann, Schultz, Schellhorn, Rybacki, Keupp, Gerden, Lemanis and Zachow2014), we used the same threshold value for all scans. Use of a high-precision sphere for segmentation to reduce errors in segmentation (Hoffmann et al. Reference Hoffmann, Schultz, Schellhorn, Rybacki, Keupp, Gerden, Lemanis and Zachow2014) could not be applied, because the thin innermost septa did not show a contrast clear enough to allow for such a procedure due to the PVE. Although some artifacts remained, the PVE affected the scans more or less uniformly, because we used the same machine with identical settings. Subsequently, we calculated the following parameters, which have been classically used for ammonoid and nautiloid conch morphometry (Fig. 1; Klug et al. Reference Klug, Korn, Landman, Tanabe, De Baets and Naglik2015a): whorl expansion rate (WER)=(dm1/dm2)2; whorl width index=ww/dm1 (WWI). WER and WWI were plotted against conch diameter and PCV against chamber number.
A, CT scanning, segmentation, and export of 3D files. The 2D image was segmented (marked in red). Arrow indicates reconstruction process from segmented 2D images to 3D model. B, Producing cross sections every 45 degrees. Gray lines indicate where the cross sections were produced. C, Cross section of the maximum conch diameter. Measurements of diameter (dm1, dm2) and whorl width (ww). WER, whorl expansion rate; WWI, whorl width index. D, Extraction of phragmocone. E, Extraction of individual phragmocone chamber volumes (PCV).
It should be noted that measurements for the earliest ontogenetic stages are often missing (<20–30 mm in conch diameter; volumes until the 10th chambers), because the scan resolution is not high enough to trace such small parts of the conch. Also, the low scan resolution can produce measurement errors (i.e., artifacts), which can have a great effect at the earliest ontogenetic stages. We tested the degree of measurement errors by taking the same measurements three times for the same specimen (PIM 7825; Supplementary Figure). Results show that measurements at a diameter of less than 30 mm are much more susceptible to measurement errors than in later ontogenetic stages. Specimen PIM 7825 was also scanned with a high-resolution CT scanner (Nikon XT H 225; isotropic spatial resolution of 0.091 mm) to examine the effects of resolution for measurements. The results show that the measurements from a medical CT scanner and a high-resolution scanner do not produce the same values (WER and WWI; Supplementary Figure) due to the different degrees of PVE. Nevertheless, the ontogenetic trends of the values produced with the medical CT scanner are constant, which suggests that the low-resolution medical scanner captures the main changes in conch morphology despite the noise, measurement errors, and PVE.
A series of calculations were performed to evaluate the data of WER and WWI. For each parameter of each specimen and each species, we created a series of equidistant data points. We calculated these equidistant data at a spacing of 0.5 mm using linear interpolation between two succeeding data points, which allowed us to calculate intraspecific variation of the produced equidistant data points with the same size class through ontogeny. In this study, standard deviations of WER and WWI and the coefficient of variation of PCV are used as indices of intraspecific variation based on the level of measurement of our data (Stevens Reference Stevens1946). Standard deviations and coefficients of variation were computed at each size class and then plotted against diameter with a log scale to take the logarithmic growth of Nautilus into account.
As mentioned, ontogenetic variation data with a statistically significant number of specimens are still rare in fossil cephalopods. As far as fossil nautiloids are concerned, the few data available are insufficient to assess intraspecific variation and to be compared with our results for N. pompilius. Instead, since some data on ammonoids and belemnites are readily available, we compared graphs for species belonging to these two groups to obtain a first impression of cephalopod variation in extinct groups as well. To this end, we measured conch parameters of 24 specimens of the late Emsian (Devonian) ammonoid Sellanarcestes tenuior through ontogeny. The specimens were collected from the same stratigraphic interval in the Anti-Atlas of Morocco. Cross sections were produced to calculate WER and WWI. In addition, intraspecific variation of septal spacing in the Jurassic belemnite Passaloteuthis laevigata, which was examined in Wani et al. (Reference Wani, Tajika, Ikuno and Iwasaki2018), was compared as an example of extinct phragmocone-bearing coleoids.
To examine whether or not the mean value of intraspecific variation differs between the examined Nautilus populations, an analysis of variance was carried out. In addition, a multiple-comparison test between the populations was performed to determine which pairs of population means are significantly different. To examine whether or not the ontogenetic pattern of intraspecific variation differs between the three Nautilus populations and the examined ammonoids, Spearman’s rank correlation coefficients were calculated. Since the sizes at adult stage were different among the Nautilus populations and the studied ammonoids, we standardized the ontogenetic data according to the adult sizes of each taxon. These statistical analyses were conducted using the Statistics and Machine Learning Toolbox™ of Matlab.
Results
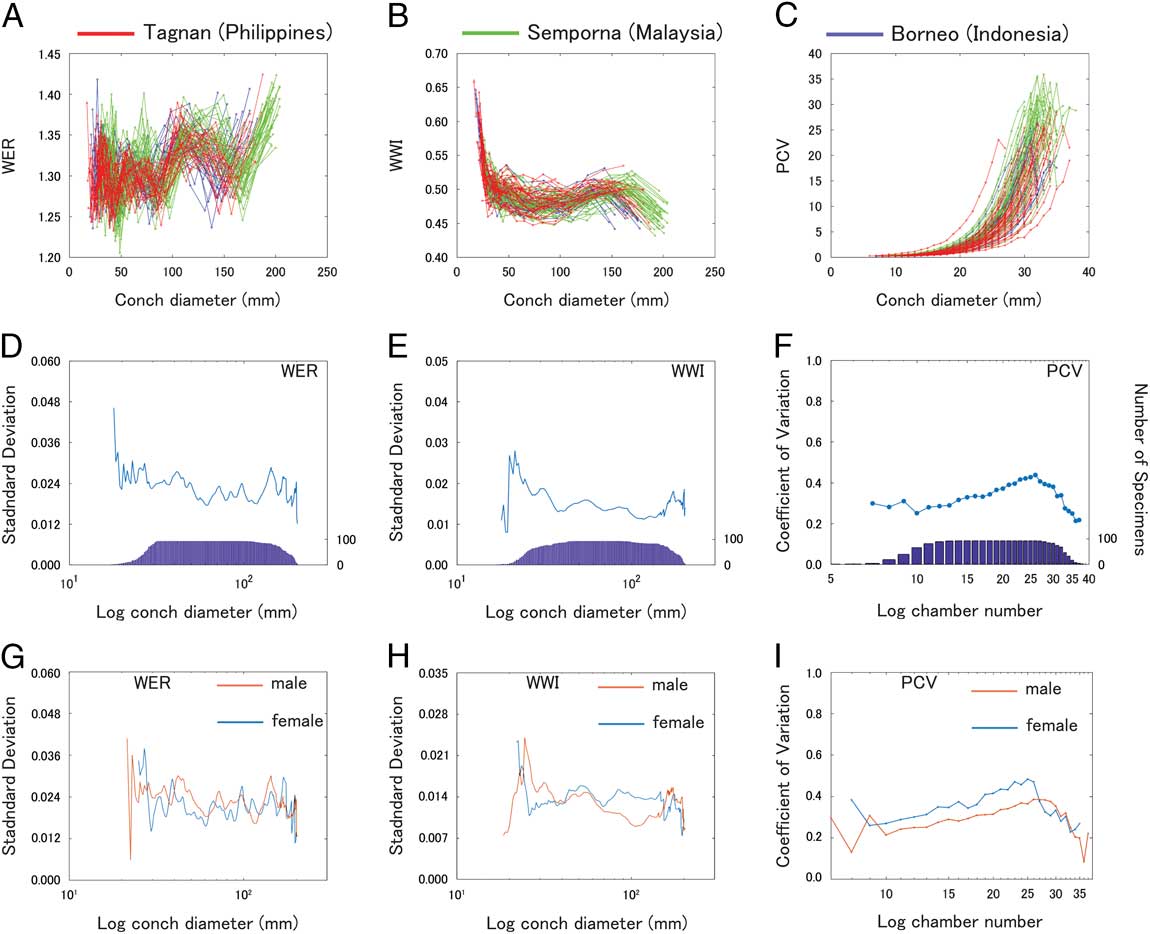
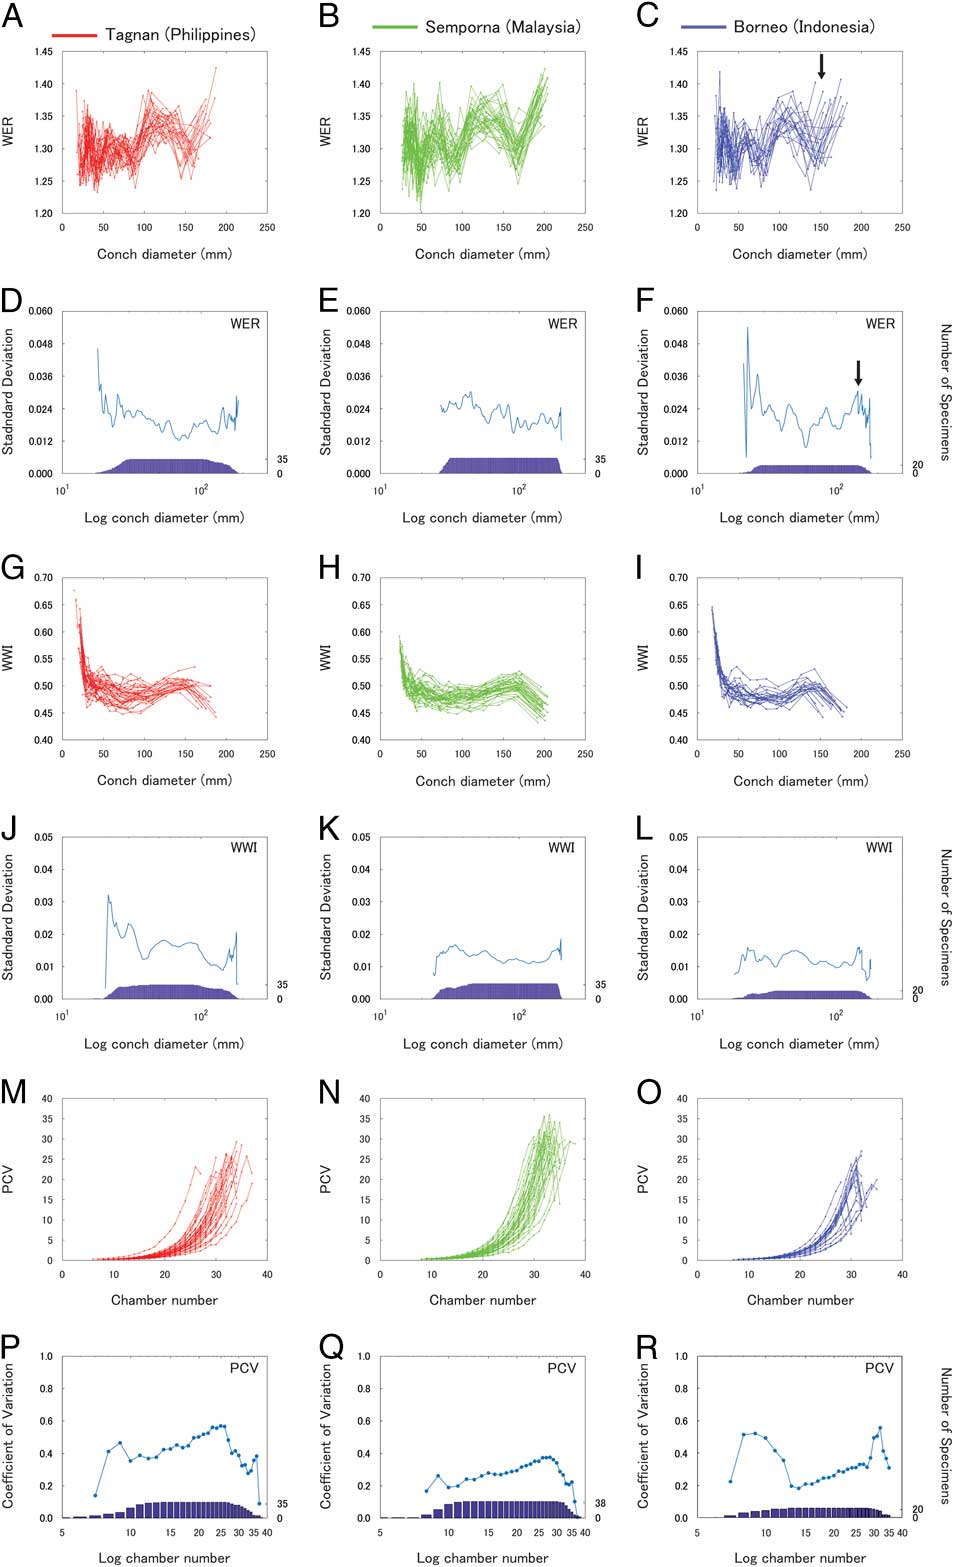
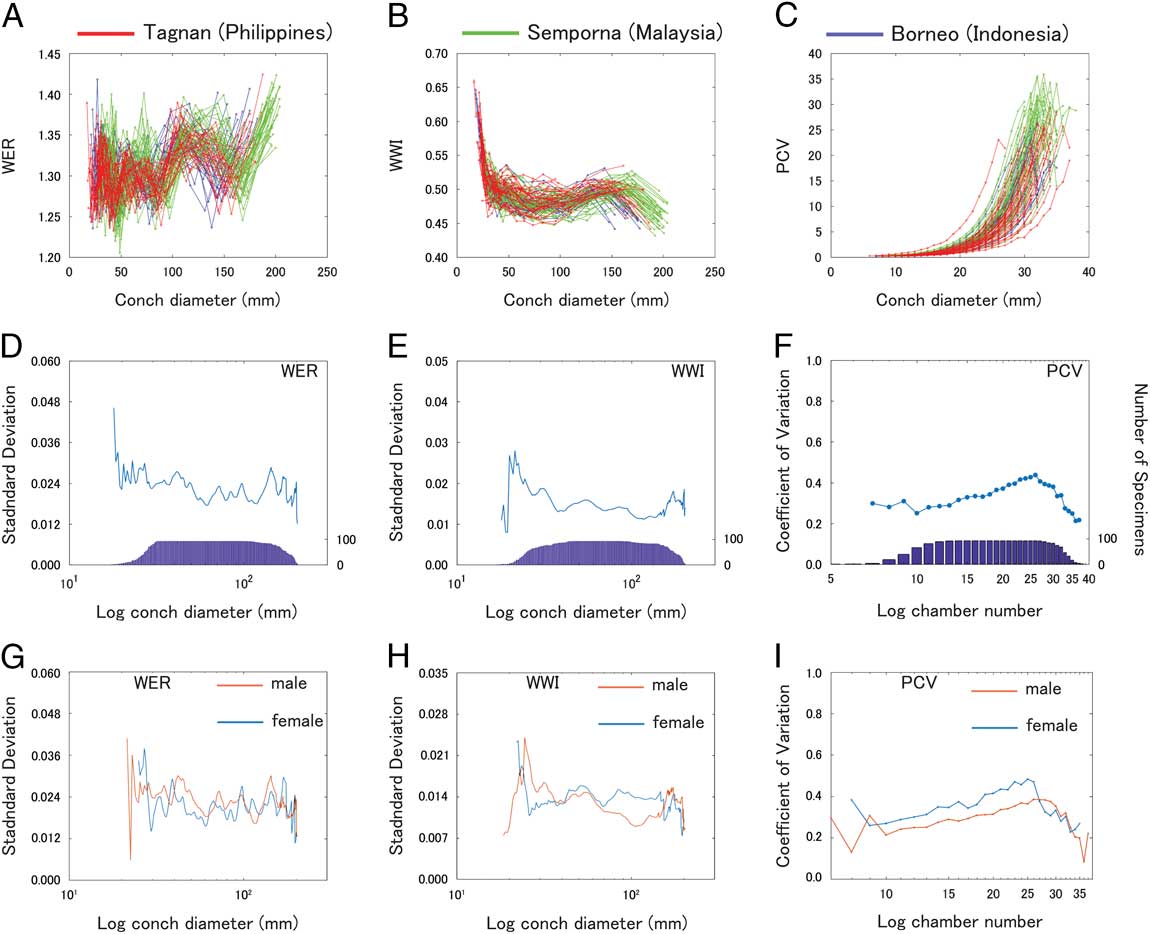
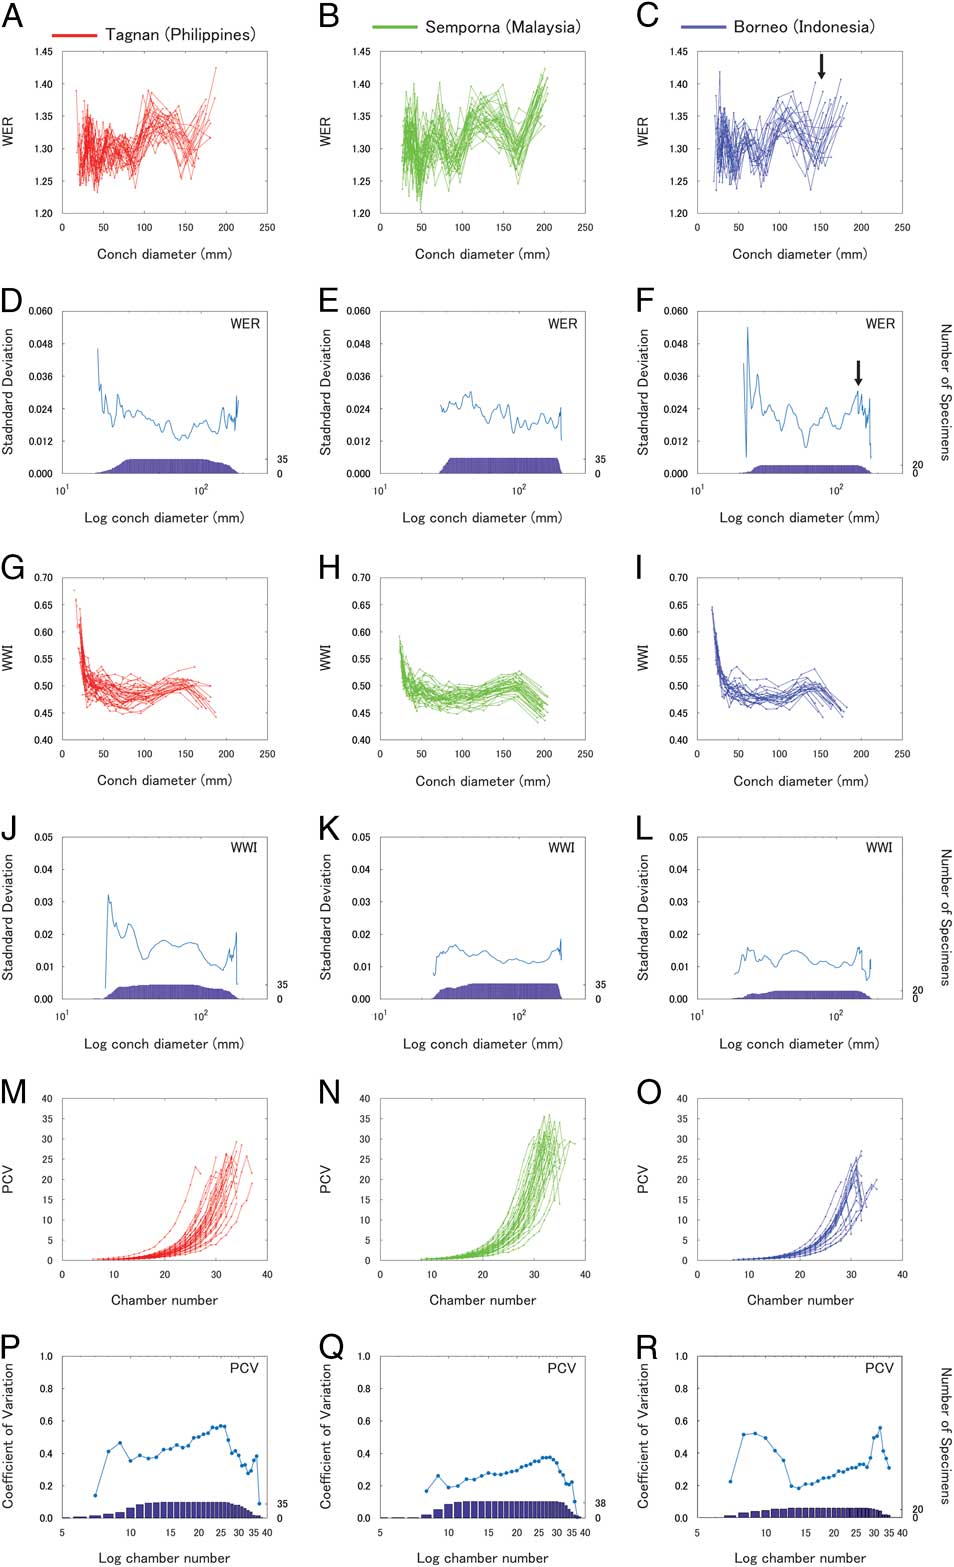
WER, WWI, PCV, and the corresponding intraspecific variation of all the examined specimens through ontogeny are shown in Figure 2 and the Supplementary Table. Differences in intraspecific variation between the two sexes are shown in Figure 2G–I. WER, WWI, and PCV and the respective intraspecific variation were compared for the three populations from the Philippines, Malaysia, and Indonesia in Figure 3. Overall, WER and WWI fluctuate with the same pattern in all populations (Fig. 3A–C). The difference occurs mainly in the timing of growth changes and also the conch diameter at which it occurs (timing and size are linked to some extent). The Malaysian population shows a rapid increase in WER at a conch diameter of around 170 mm (Fig. 3B). However, the growth change before maturity (morphologic countdown) takes place at a smaller diameter (around 140–150 mm; Fig. 3A,C) in the populations with smaller conch diameter from the Philippines and Indonesia. Intraspecific variation changes throughout ontogeny to different degrees, depending on the parameter and population. As mentioned in the “Materials and Methods” section, the number of specimens that yields statistically reliable measurements from the earliest ontogenetic stages is not sufficient and creates artifacts such as a surge or sharp decline of variation in WER and WWI at around 20 mm in conch diameter (Fig. 2D,E). A similar sharp increase or decrease occurs also at the last growth stage, which probably results from the variation of the adult size of our specimens. Also, the degree of variation in WWI of the Malaysian and Indonesian populations (Fig. 3K,L) is weaker than is seen for the WER (Fig. 3E,F). Although we could not examine the difference between males and females within a population due to the insufficient number of specimens to calculate standard deviation, males and females from all populations were compared (Fig. 2G–I).
Plots of WER, WWI, PCV, and their intraspecific variation of Nautilus pompilius through ontogeny from the Philippines, Malaysia, and Indonesia. Blue bar graphs (D–F) represent the number of examined specimens (right y-axis). A, Plot of WER. B, Plot of WWI. C, Plot of PCV. D, Intraspecific variation (standard deviation) of WER. E, Intraspecific variation (standard deviation) of WWI. F, Intraspecific variation (coefficient of variation) of PCV. G, Intraspecific variation (standard deviation) of WER of males and females from all the examined populations. H, Intraspecific variation (standard deviation) of WWI of males and females from all the examined populations. I, Intraspecific variation (coefficient of variation) of PCV of males and females from all the examined populations.
Plots of WER, WWI, PCV, and their intraspecific variation of Nautilus pompilius through ontogeny with different populations plotted in different graphs. Blue bar graphs represent the number of examined specimens (right y-axis). A, Plots of WER in the population of the Philippines. B, Plots of WER in the Malaysian population. C, Plots of WER in the Indonesian population. Arrow indicates a growth change. D, Intraspecific variation (standard deviation) of WER in the population of the Philippines. E, Intraspecific variation (standard deviation) of WER in the Malaysian population. F, Intraspecific variation (standard deviation) of WER in the Indonesian population. Arrow indicates a peak, which corresponds to the growth change indicated in C. G, Plots of WWI in the population of the Philippines. H, Plots of WWI in the Malaysian population. I, Plots of WWI in the Indonesian population. J, Intraspecific variation (standard deviation) of WWI in the population of the Philippines. K, Intraspecific variation (standard deviation) of WWI in the Malaysian population. L, Intraspecific variation (standard deviation) of WWI in the Indonesian population. M, Plots of PCV in the population of the Philippines. N, Plots of PCV in the Malaysian population. O, Plots of PCV in the Indonesian population. P, Intraspecific variation (coefficient of variation) of PCV in the population of the Philippines. Q, Intraspecific variation (coefficient of variation) of PCV in the Malaysian population. R, Intraspecific variation (coefficient of variation) of PCV in the Indonesian population.
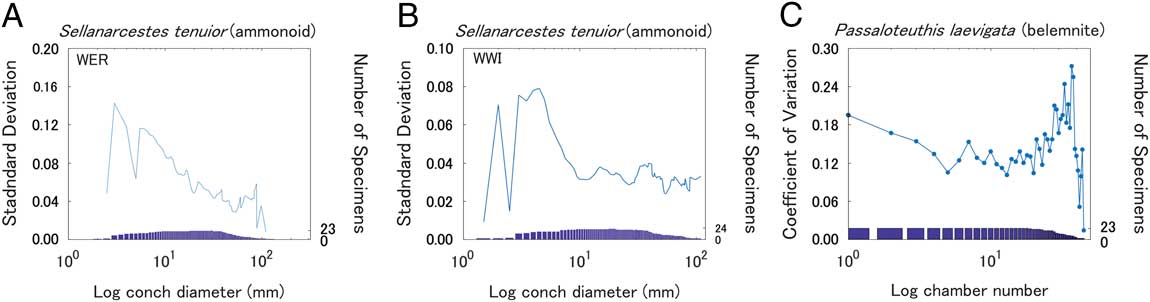
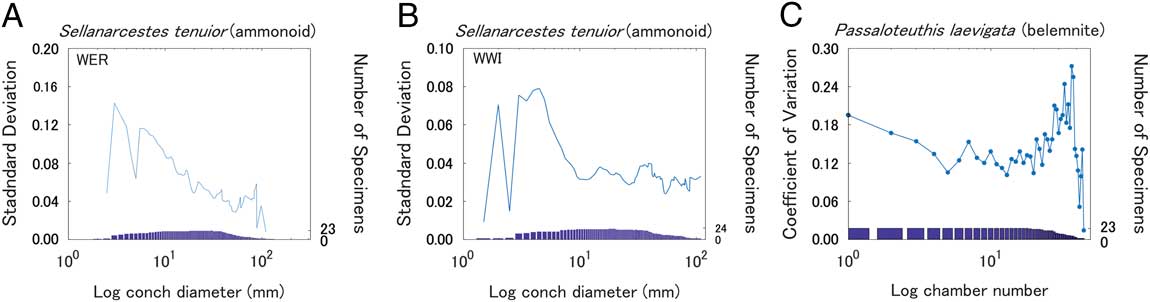
Intraspecific variation of WER and WWI in the examined ammonoid and septal spacing in belemnites are shown in Figure 4A–C. All graphs confirm intraspecific variation changes throughout ontogeny.
Intraspecific variation of (A) WER and (B) WWI of the Devonian ammonoid Sellanarcestes tenuior and (C) septal spacing of the Jurassic belemnite Passaloteuthis laevigata (reproduced from the data in Wani et al. Reference Wani, Tajika, Ikuno and Iwasaki2018). Bar graphs represent the number of examined specimens (right y-axis).
Discussion
Pattern of Intraspecific Variation in Nautilus pompilius
A consistent pattern (or commonality) of variation in all the examined parameters through ontogeny among the three populations is evident. Our data demonstrate that the intraspecific variation starts with a relatively high variability early in ontogeny, followed by a gradual decrease of variation until the middle to late ontogenetic stages. The hatching of Nautilus is known to coincide with the formation of the nepionic constriction, which is a shell thickening and a groove surrounding the (former) aperture from the umbilicus to the venter at around 26 mm in specimens with an average conch diameter (Arnold et al. Reference Arnold, Landman and Mutvei1987). The high variation of embryonic conch size and also of the corresponding conch parameters is caused by variability in the size of hatchlings. Remarkably, there are several peaks in variation through ontogeny. When variation is compared with the original plots of each conch parameter, some of these peaks correspond with the timing of the growth changes, namely the increasing and decreasing trends of the respective parameter (e.g., Fig. 3C,F, indicated by arrows). Depending on the individual, delays, accelerations, or variations in growth rates may affect the diameter at which the growth changes occur, resulting in conspicuous peaks. Although growth changes are not very pronounced, it appears that Nautilus has several growth stages (Figs. 2 and 3), which are represented by the pattern of WER changes through ontogeny in addition to the well-documented embryonic and mature modifications (Ward Reference Ward1987; Klug Reference Klug2001, Reference Klug2004; Klug et al. Reference Klug, Zatoń, Parent, Hostettler and Tajika2015b): in Figure 3A, for instance, growth stage 1 displays a fluctuating WER with intervals of rapid changes (until the diameter of slightly less than 100 mm), growth stage 2 displays an increasing trend (from slightly below 100 mm to around 120 mm in diameter), growth stage 3 displays a relatively stable trend (from 120 mm to 140 mm in diameter), growth stage 4 displays a rapid decrease (from 140 or slightly below to 160 mm in diameter), and growth stage 5 displays a rapid increase toward the end of growth. Several growth stages are also seen in the fossil record of ammonoids (Westermann Reference Westermann1996; Klug Reference Klug2001). This pattern of WER changes can be seen in the other two populations as well (Fig. 3B,C). In contrast, there are no striking differences between males and females (Fig. 2G–I).
Degree and Pattern of Intraspecific Variation among Populations
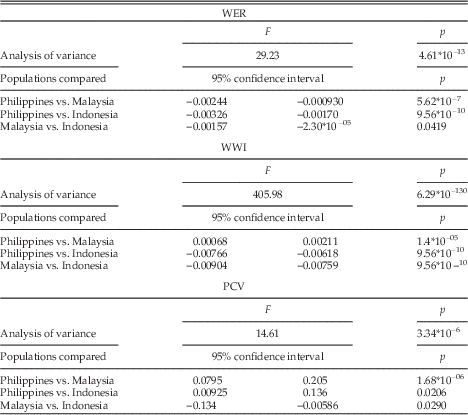
We tested the degree to which intraspecific variation differs among the three populations (Table 1). Significant differences were found in the mean values of the intraspecific variation among the populations, except for PCV between the Philippines and Indonesia, suggesting that each population tends to have a different degree of intraspecific variation. Nevertheless, this may also reflect the measurement biases discussed earlier, because the maximal or minimal value of intraspecific variation occurs at the earliest or latest ontogenetic stages.
Analysis of variance and multiple-comparison test between pairs of the three different populations of Nautilus pompilius. F, F-statistic; PCV, phragmocone chamber volume; p=probability. WER, whorl expansion rate; WWI, whorl width index.

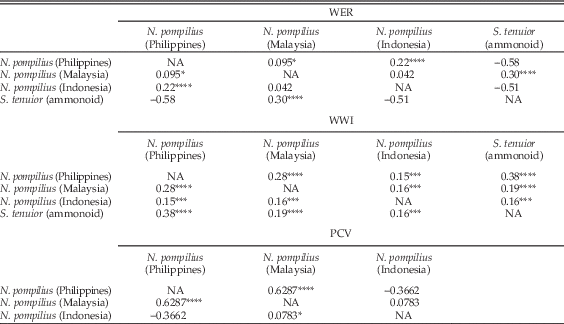
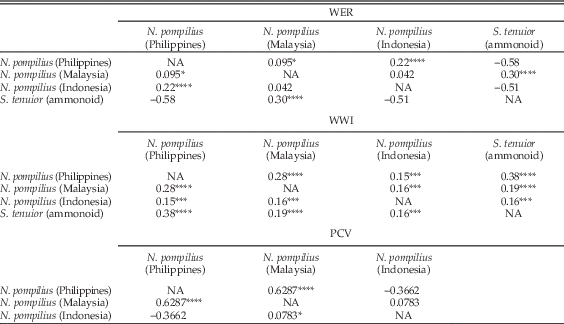
The ontogenetic pattern of intraspecific variation among the three populations was also tested. To get an overview of the patterns, Spearman’s rank correlation coefficients were calculated in each standard deviation graph (Figure 3D–F,J–L,P–Q; Table 2). Results show that the patterns obtained for each population tend to be highly and positively correlated in WER and WWI, whereas PCV does not show a high positive correlation, except between populations from the Philippines and Malaysia. The low correlation may partially be rooted in the small number of specimens at the earliest ontogeny (chamber numbers 1–10). As mentioned earlier, however, an increasing trend toward the late ontogeny (before the latest ontogeny with a sharp decline) is a commonality of the three populations.
Spearman’s rank correlation coefficients for three morphometric variables between pairs of the three extant populations and the Devonian ammonoid Sellanarcestes tenuior. NA, not available; PCV, phragmocone chamber volume; WER, whorl expansion rate; WWI, whorl width index. Significant correlations are indicated with the following levels of significance: *p=0.1; **p=0.05; ***p=0.01; ****p=0.001.
Intraspecific Variation of Ammonoids
Here we show the example of intraspecific variation of WER and WWI of the late Emsian (Devonian) ammonoid Sellanarcestes tenuior (Fig. 4A,B). In the graphs, the variation of WER and WWI starts with a very high value. As in Nautilus, it is likely that variation is overestimated at the earliest ontogenetic stages due to the small sample size and measurement errors. Similarly, the small sample size also masked the real pattern of intraspecific variation at the latest ontogenetic stages. The overall variation of WER, however, is rather similar to that of Nautilus. Around hatching, variation of the conch parameters of S. tenuior is relatively high. This is followed by a gradual decrease in variation until it starts increasing rapidly shortly before maturity (adult size of Sellanarcestes: approx. 100 mm; Klug Reference Klug2001). The intraspecific variation of WWI (Fig. 4B) shows a similar trend. Variation is the highest before hatching and then decreases. Subsequently, it fluctuates only slightly until the end of ontogeny. Spearman’s rank correlation coefficient was calculated to compare the patterns of the ammonites with those of the three Nautilus populations and highlighted a strong positive correlation among them (Table 2).
As for other studies on intraspecific variation of ammonoids, Jattiot et al. (Reference Jattiot, Bucher, Brayard, Monnet, Jenks and Hautmann2015) examined the Triassic ammonoid genus Anasibirites from Timor, Asia. In that study, measurements on a large number of specimens were taken in order to revise its species. Although ontogenetic data within a single specimen are missing in that study, intraspecific variation of some species was examined. It appears that high variation occurs at an early ontogenetic stage, followed by lower variation at later ontogenetic stages. This decreasing trend was also found by Korn (Reference Korn2017) in the early Carboniferous ammonoid Goniatites sphaericus. De Baets et al. (Reference De Baets, Klug and Monnet2013) addressed intraspecific variation with ontogenetic data of a relatively large sample size. They showed intraspecific variation and intrageneric variation of the two loosely coiled Early Emsian ammonoid genera Anetoceras and Erbenoceras (see Fig. 2 of that paper). For instance, the variation of the whorl height index (WHI) and umbilical width index (UWI) in Erbenoceras appears to be slightly higher in the middle ontogenetic stages (at the diameter from 50 to 90 mm) than in early and late ontogenetic stages. By contrast, intrageneric variation of Anetoceras appears high at early ontogenetic stages with some decrease in later ontogenetic stages, as in N. pompilius. Korn and Klug (Reference Korn and Klug2007) examined the Devonian ammonoid Manticoceras. Their results also do not exactly align with our results, probably because many of the examined specimens were not measured through ontogeny within a single specimen. It is likely that different ammonoids have different patterns of intraspecific variation, because ontogenetic trajectories also differ quite significantly (e.g., Klug Reference Klug2001).
Given the results presented here and those of earlier studies, there are commonalities in the pattern of intraspecific variation through ontogeny, at least in some groups of ammonoids (Devonian Anetoceras and Sellanarcestes tenuior, Carboniferous Goniatites sphaericus, and Triassic Anasibirites) and nautiloids (Nautilus pompilius). Although one can speculate about several possible explanations for this trend, such as ontogenetic physiological changes, change of habitat and genetics, and variation of growth changes due to differences in environmental conditions, it is difficult to conclude which factor contributed to the ontogenetic trend at this point, because physiology, habitat, and genetics of living and fossil cephalopods are not known or only incompletely known. Furthermore, the varying degrees of intraspecific variation through ontogeny may reflect different degrees of selective pressure at different ontogenetic stages, because the ecological role of cephalopods likely changes through their life cycle, as seen in (extant) cephalopods showing strong ontogenetic size changes. Another important factor influencing the rate of variation is the timing of growth changes (variation will be significantly increased due to various timing of growth changes). Nevertheless, since it is not entirely clear which ontogenetic changes are adaptive, we cannot conclude which ontogenetic stages are likely to bear higher phenotypic variation. Since the Ammonoidea are morphologically diverse and have a long stratigraphic range, further studies are needed to understand such details of ontogenetic intraspecific variation.
Intraspecific Variation of Belemnites
The hard parts of belemnites also grew by accretion; the phragmocone and proostracum grew at the anterior edge and by the addition of septa, while the rostrum grew by addition of calcium carbonate to its complete outer surface. The structure, which contains the most easily readable information on belemnite ontogeny, is the phragmocone, even though we know very little about its intraspecific variation. New data from Wani et al. (Reference Wani, Tajika, Ikuno and Iwasaki2018) give some insight into belemnite intraspecific variation. The authors measured septal spacing of 23 specimens of the Jurassic belemnite Passaloteuthis laevigata from Buttenheim, Germany. Even though septal spacing may not be directly comparable to WER and WWI of Nautilus and ammonoids, it shows an ontogenetic pattern similar to PCV (Naglik et al. Reference Naglik, Monnet, Goetz, Kolb, De Baets, Tajika and Klug2015). Thus, we reproduced the coefficient of variation of the septal spacing calculated in Wani et al. (Reference Wani, Tajika, Ikuno and Iwasaki2018) through ontogeny (Fig. 4C). It should be noted that a problem in comparing phragmocones of belemnites to those of nautilids is that one cannot obtain information on all ontogenetic stages, because the very last septum (which indicates the end of growth by septal crowding) is usually missing in belemnites. The intraspecific variation begins with a relatively high value at the first chamber and declines until the fifth chamber. This trend cannot be directly compared with results for the PCV of N. pompilius (Fig. 3P–R), because we lack information on the variation in the earliest ontogeny in N. pompilius. The variation of the belemnite then stays more or less at a coefficient of variation of around 0.12 until the 18th chamber, where a rapid increase starts. In this study, only low numbers of specimens that preserve the part of the phragmocone that was formed near the end of ontogeny are available. This might have biased our results for the latest preserved ontogenetic stages. Despite the difficulty of determining growth stages based on the graph, we do find some similarity with the overall shape of the graphs for ontogenetic intraspecific variation of PCV between N. pompilius and the belemnites : the intraspecific variation increases toward the later ontogeny in belemnites as well. Also, the high variation in the earliest and latest ontogeny in belemnites is similar to what is seen for WER and WWI in N. pompilius and some ammonoids such as S. tenuior. At this point, we cannot conclude whether the pattern of intraspecific variation of belemnite septal spacing is similar to those of other cephalopods. Nevertheless, assuming that our data represent more or less the entire ontogeny, it is likely that the increasing trend toward the end of ontogeny might be a common ontogenetic pattern of intraspecific variation. As mentioned earlier, however, further investigation is necessary, because there is only limited data on intraspecific variation of belemnites.
Conclusions
Based on new data from 3D morphometry of extant Nautilus pompilius from three different populations (Philippines, Malaysia, Indonesia), we can now state the following:
-
1. Phenotypic intraspecific variation of recent Nautilus: Intraspecific variation of N. pompilius changes throughout ontogeny in males and females from all the examined geographic populations. The degree of intraspecific variation can be considerably higher in some ontogenetic stages. High variation in early ontogeny is partially rooted in measurement errors and a lower number of specimens, while only the smaller sample size accounts for some uncertainty about the higher variation near maturity.
-
2. Changes in intraspecific variation through ontogeny: Although there are slight differences among the conchs of the three regions, there is a commonality in the pattern of intraspecific variation. Intraspecific variation in all examined parameters tends to start with high values, followed by a decreasing phase of variation. Then, it increases again to reach high variation before maturity. There is sometimes a sharp increase or decline of intraspecific variation at the latest ontogenetic stage, which may have been biased by small sample sizes and varying adult sizes. The increase or decrease may have happened around growth changes due to the fact that growth change occurred at slightly differing sizes (conch diameters) in different individuals.
-
3. Intraspecific variation among geographically separated populations: The degree of variation differs among the three populations from the Philippines, Malaysia, and Indonesia. There is also a difference in the timing of changes in variation through ontogeny, which probably resulted from different conch sizes and timing when growth changes occurred in the individuals of these populations.
-
4. Pattern of intraspecific variation in Nautilus and other cephalopods: Some ammonoid groups and a belemnite taxon show ontogenetic patterns of intraspecific variation resembling to some extent those of N. pompilius: A decreasing trend from the early to middle ontogeny appears to be common between N. pompilius and some ammonoids. Although different taxa differ in details of intraspecific variation through ontogeny, there are some groups of cephalopods that share a similar pattern of intraspecific variation. Further investigations are needed to better understand intraspecific variation in various cephalopod groups through ontogeny.
Acknowledgments
This study was kindly supported by the Swiss National Science Foundation (project numbers: 200020_169847 and 200021_149119). We thank Y. Takamatsu and M. Scherrer (both Zurich) for their help with CT scanning. R. Hoffmann (Bochum) kindly lent us a silica sphere for CT scanning. T. Clements (Leicester) proofread the paper and corrected the English. The stimulating discussions with C. Zollikofer (Zurich) were greatly appreciated. Also, we appreciate the constructive reviews of R. Hoffmann (Bochum) and J. Dzik (Warsaw).
Supplementary Material
Data available from the Dryad Digital Repository: https://doi.org/10.5061/dryad.4cb86