





The global prevalence of diabetes is rising, with projections indicating that over 1·31 billion individuals will be affected by 2050(1). Diabetes and its associated complications represent major health concerns, contributing to diminished quality of life and increased mortality risk(Reference Trikkalinou, Papazafiropoulou and Melidonis2,Reference Nakagami3) . Postprandial hyperglycaemia is linked to the onset of type 2 diabetes mellitus and CVD, making the regulation of postprandial glucose a critical aspect of chronic disease prevention(Reference Abdul-Ghani, Stern and Lyssenko4–7). Evidence suggests that lifestyle interventions, particularly dietary modifications, are effective in managing blood glucose(Reference Simões Corrêa Galendi, Leite and Banzato8–Reference Yamada, Uchida and Izumi10). Various strategies have been explored to regulate postprandial glucose levels. For instance, a meta-analysis identified that the Mediterranean diet is effective for glycaemic control in type 2 diabetes mellitus(Reference Schwingshackl, Chaimani and Hoffmann11). Mok et al. found that increasing dietary protein intake reduced the postprandial glycaemic response(Reference Mok, Haldar and Lee12). Vlachos et al. reported that reducing carbohydrate intake or increasing soluble fibre had beneficial effects on postprandial glucose(Reference Vlachos, Malisova and Lindberg13). These findings underscore the importance of dietary interventions in managing postprandial hyperglycaemia to enhance glycaemic control and mitigate type 2 diabetes mellitus-related complications.
Glucose tolerance has been shown to exhibit diurnal variation(Reference Poggiogalle, Jamshed and Peterson14,Reference Leung, Huggins and Ware15) . Several studies have reported that postprandial glucose levels are higher in the evening than in the morning, even when identical meals are consumed(Reference Jarrett, Baker and Keen16–Reference Takahashi, Ozaki and Kang18). One study involving overweight females demonstrated that a high-calorie evening meal significantly reduced glucose tolerance compared with a high-calorie morning meal(Reference Jakubowicz, Barnea and Wainstein19). Moreover, the efficacy of glycaemia-lowering foods and beverages appears to vary by the timing of intake. For example, catechin and mulberry leaf extract are more effective when consumed at dinner than at breakfast(Reference Takahashi, Ozaki and Miyashita20,Reference Takahashi, Mineshita and Yamagami21) . Another study found that ingesting a high-protein meal at dinner may help suppress postprandial glucose excursion(Reference Davis, Bonham and Nguo22). These findings highlight the significance of both meal content and timing in the effective management of blood glucose.
Glucose tolerance varies across the menstrual cycle, which comprises two phases: the follicular phase, from the first day of menstruation to ovulation, and the luteal phase, from ovulation to the onset of the next menstruation. These phases are marked by fluctuations in the sex hormones estradiol and progesterone. Estradiol peaks during the mid-follicular phase, while progesterone rises during the luteal phase(Reference Reed and Carr23,Reference Schmalenberger, Tauseef and Barone24) . In studies examining the relationship between menstrual cycle and glucose tolerance, glucose levels have been found to be lowest during the late follicular phase and highest during the luteal phase(Reference Lin, Siddiqui and Lin25,Reference Brennan, Feltrin and Nair26) . Other research indicates that the homeostasis model assessment of insulin resistance increases during the luteal phase compared with the follicular phase, with insulin sensitivity highest in the follicular phase and lowest in the luteal phase(Reference Yeung, Zhang and Mumford27–Reference Pulido and Salazar29). These patterns may be linked to sex hormone fluctuations, as progesterone has been shown to induce insulin resistance by inhibiting insulin signalling in adipocytes, whereas elevated estradiol is associated with reduced mean blood glucose(Reference Lin, Siddiqui and Lin25,Reference Wada, Hori and Sugiyama30) . Therefore, in managing glucose tolerance among premenopausal females, hormonal changes across the menstrual cycle should be considered.
However, most studies assessing this relationship have evaluated glucose levels at a single time point and have not adequately examined how different meals, such as breakfast, lunch and dinner, may influence the glycaemic response. Furthermore, sex hormones also exhibit diurnal fluctuations. For example, estradiol has been observed to peak at night(Reference Rahman, Grant and Gooley31). These findings suggest that both menstrual cycle-related and circadian variations in sex hormones are important to consider when evaluating glucose tolerance in premenopausal females. Nevertheless, their interactions remain insufficiently understood.
In the present study, we investigated differences in postprandial blood glucose at breakfast, lunch and dinner during the follicular and luteal phases. Additionally, we explored the relationship between postprandial blood glucose and sex hormone levels after each meal. We hypothesised that postprandial blood glucose would be higher in the luteal phase than in the follicular phase, particularly at dinner, due to hormonal changes across the menstrual cycle, diurnal variations in glucose tolerance and fluctuations in sex hormone levels.
Participants and methods
Participants
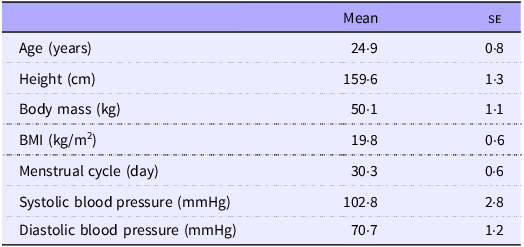
Fifteen healthy young females participated in this study. Exclusion criteria included (1) irregular menstrual cycles, (2) current or suspected pregnancy, (3) food allergies, (4) diagnosis of diabetes or dyslipidaemia, (5) use of medications or supplements for antioxidants, antiobesity or antidiabetic purposes, (6) use of medications for depression, sleep disorders or steroids, (7) sleep apnoea, (8) smoking, (9) habitual alcohol consumption, (10) presence of a pacemaker or metal in the body (excluding dental fillings), (11) shift work or travel across time zones within the preceding 2 weeks and (12) engagement in regular strenuous aerobic exercise. All participants completed a questionnaire assessing physical activity, exercise habits and general health status prior to enrolment. The study complied with the Declaration of Helsinki and received ethical approval from the institutional review board (approval no. 2024213). Written informed consent was obtained from all participants. The clinical trial was registered with the University Hospital Medical Information Network, Japan (Clinical Trial Reference: UMIN000056638). Physical characteristics of the participants are presented in Table 1.
Physical characteristics of all participants

Table 1. Long description
A table presenting the physical characteristics of fifteen healthy young female participants in a study. The table has two columns: Mean and SE. The rows are labeled as follows: Age (years), Height (cm), Body mass (kg), BMI (kg/m^2), Menstrual cycle (day), Systolic blood pressure (mmHg), and Diastolic blood pressure (mmHg). The values in the Mean column are: 24.9, 159.6, 50.1, 19.8, 30.3, 102.8, and 70.7. The values in the SE column are: 0.8, 1.3, 1.1, 0.6, 0.6, 2.8, and 1.2.
All data are presented as means and standard errors.
Study design and procedure
The study was conducted between April 2024 and May 2025 at the Institute of Science Tokyo. The study protocol is illustrated in Figure 1. Each participant completed two trial phases: the follicular phase and the luteal phase. Participants were instructed to contact the research team at the onset of menstruation. The first day of bleeding was designated as day 1. The follicular phase trial was conducted on days 9–11, and the luteal phase trial was conducted on days 21–23. Participants wore a continuous glucose monitoring device (FreeStyle Libre Pro, Abbott Japan Co., Ltd) to measure interstitial fluid glucose. To determine the menstrual phase, core body temperature and sex hormone levels were evaluated. For core temperature, participants wore a wearable sensor (CALERA Research, greenteg) on the chest from the day before testing until the test day. Mean, maximum and minimum core body temperatures at bedtime (from the previous day through the test day) and waking core temperature on the test day were recorded. The device estimated the core temperature by integrating continuous skin temperature and heat flux data. To evaluate sex hormone levels, unstimulated saliva samples were collected before each meal during both the follicular and luteal phases to measure estradiol and progesterone concentrations. Physical activity was monitored using the ActiGraph wGT3X-BT (ActiGraph Corporation) worn on the non-dominant wrist throughout the trial day; energy expenditure, metabolic equivalents and daily steps were analysed using the Freedson Combination algorithm(Reference Freedson, Melanson and Sirard32).
Study protocol.

Test meals
The test meals were provided as standardised set meals. The same set meal was served at each meal time in both follicular and luteal phase trials. The meals included ingredients such as rice, spinach, carrots, onions, pork, beef, maize, bell peppers, Alaska pollock, soyabeans, pumpkin, burdock root, flounder and eggplant. Each meal was designed to provide one-third of each participant’s estimated daily energy requirement, with macronutrient composition adjusted to generally fall within the recommended ranges of the dietary reference intakes for Japanese (2025) (13–20 % protein, 20–30 % fat and 50–65 % carbohydrate). In this study, each test meal provided approximately 562·7 kcal, 19·7 g of protein, 15·4 g of fat and 86·9 g of carbohydrates, which ranged within the dietary reference intakes for Japanese for PFC balance (14·0 % protein, 24·5 % fat and 61·5 % carbohydrate). Estimated daily energy requirements were calculated based on BMR and a physical activity factor. Physical activity was assessed prior to the experiment using the International Physical Activity Questionnaire (IPAQ). Participants were instructed to consume the test meals at 08.00, 13.00 and 18.00 and to finish each meal within 20 min. The time taken to consume the meal during the initial trial was recorded and replicated in all subsequent trials.
Standardisation of the meal and physical activity
Participants were instructed to maintain their usual dietary habits, avoid strenuous physical activity and minimise stress throughout the study period. On the day preceding each trial, they were asked to abstain from all food and beverages (except water) after 21.00. On the test day, they were asked to consume only the test meals and water.
Anthropometrics
Anthropometric measurements were conducted prior to the trial. Body weight was measured to the nearest 0·1 kg using a digital scale (InBody 230; InBody Japan Inc.). BMI was calculated as weight (kg) divided by height squared (m2). Arterial blood pressure was measured from the participants’ arms while seated by using a brachial electronic monitor (HCR-7202; OMRON Dalian Co., Ltd). Participants rested in a seated position for 5 min before blood pressure measurements were taken.
Saliva sampling and hormonal analysis
Estradiol and progesterone levels were measured to confirm that the test day corresponded to the follicular or luteal phase. Participants were instructed to avoid eating, smoking or drinking (except water) for at least 1 h before saliva collection and to rinse their mouths with water for at least 10 min prior to sampling. Saliva samples (approximately 1 ml) were collected in cryovials (Salimetrics LLC) and stored frozen. Following completion of all measurements, the samples were thawed and analysed for salivary estradiol and progesterone by using the High Sensitivity Salivary 17β-Estradiol Enzyme Immunoassay Kit (Salimetrics LLC) and the Salivary Progesterone Enzyme Immunoassay Kit (Salimetrics LLC).
Statistical analysis
Data are presented as means and standard errors. The Shapiro–Wilk test was used to assess the normality of distributions for physical characteristics, glucose concentrations, core body temperature, estradiol, progesterone, energy expenditure and daily steps. Glucose concentrations were calculated from fasting to 180 min after each meal, based on recorded meal times, and the AUC was calculated using the trapezoidal method. A two-factor repeated-measures ANOVA was used to assess the effects of the menstrual phase (follicular or luteal) and postprandial interval (0, 30, 60, 120 and 180 min) on glucose concentrations after each meal (breakfast, lunch and dinner). Moreover, a two-factor repeated-measures ANOVA was used to assess the effects of meal times (breakfast, lunch and dinner) and postprandial intervals (0, 30, 60, 120 and 180 min) on glucose concentrations during each phase (follicular or luteal phase). When significant interaction effects were identified, post hoc comparisons were conducted using the Bonferroni method. Estradiol and progesterone concentrations across meals by menstrual phase were compared using the Wilcoxon signed-rank test. Comparisons of AUC and core body temperature between the follicular and luteal phases were conducted using paired t tests or Wilcoxon signed-rank tests, as appropriate. Statistical significance was set at P < 0·05. Sample size was determined based on prior studies examining the effects of the menstrual cycle on glucose tolerance and the impact of meal timing on postprandial interstitial fluid glucose levels(Reference Brennan, Feltrin and Nair26,Reference Brown, Jiang and McElwee-Malloy33,Reference Takahashi, Yoshida and Toku34) . All analyses were conducted using Predictive Analytics Software version 23.0 for Windows (SPSS Japan Inc.).
Results
Participant characteristics
The clinicodemographic characteristics of the participants are summarised in Table 1.
Postprandial glucose concentrations after breakfast, lunch and dinner by menstrual cycle
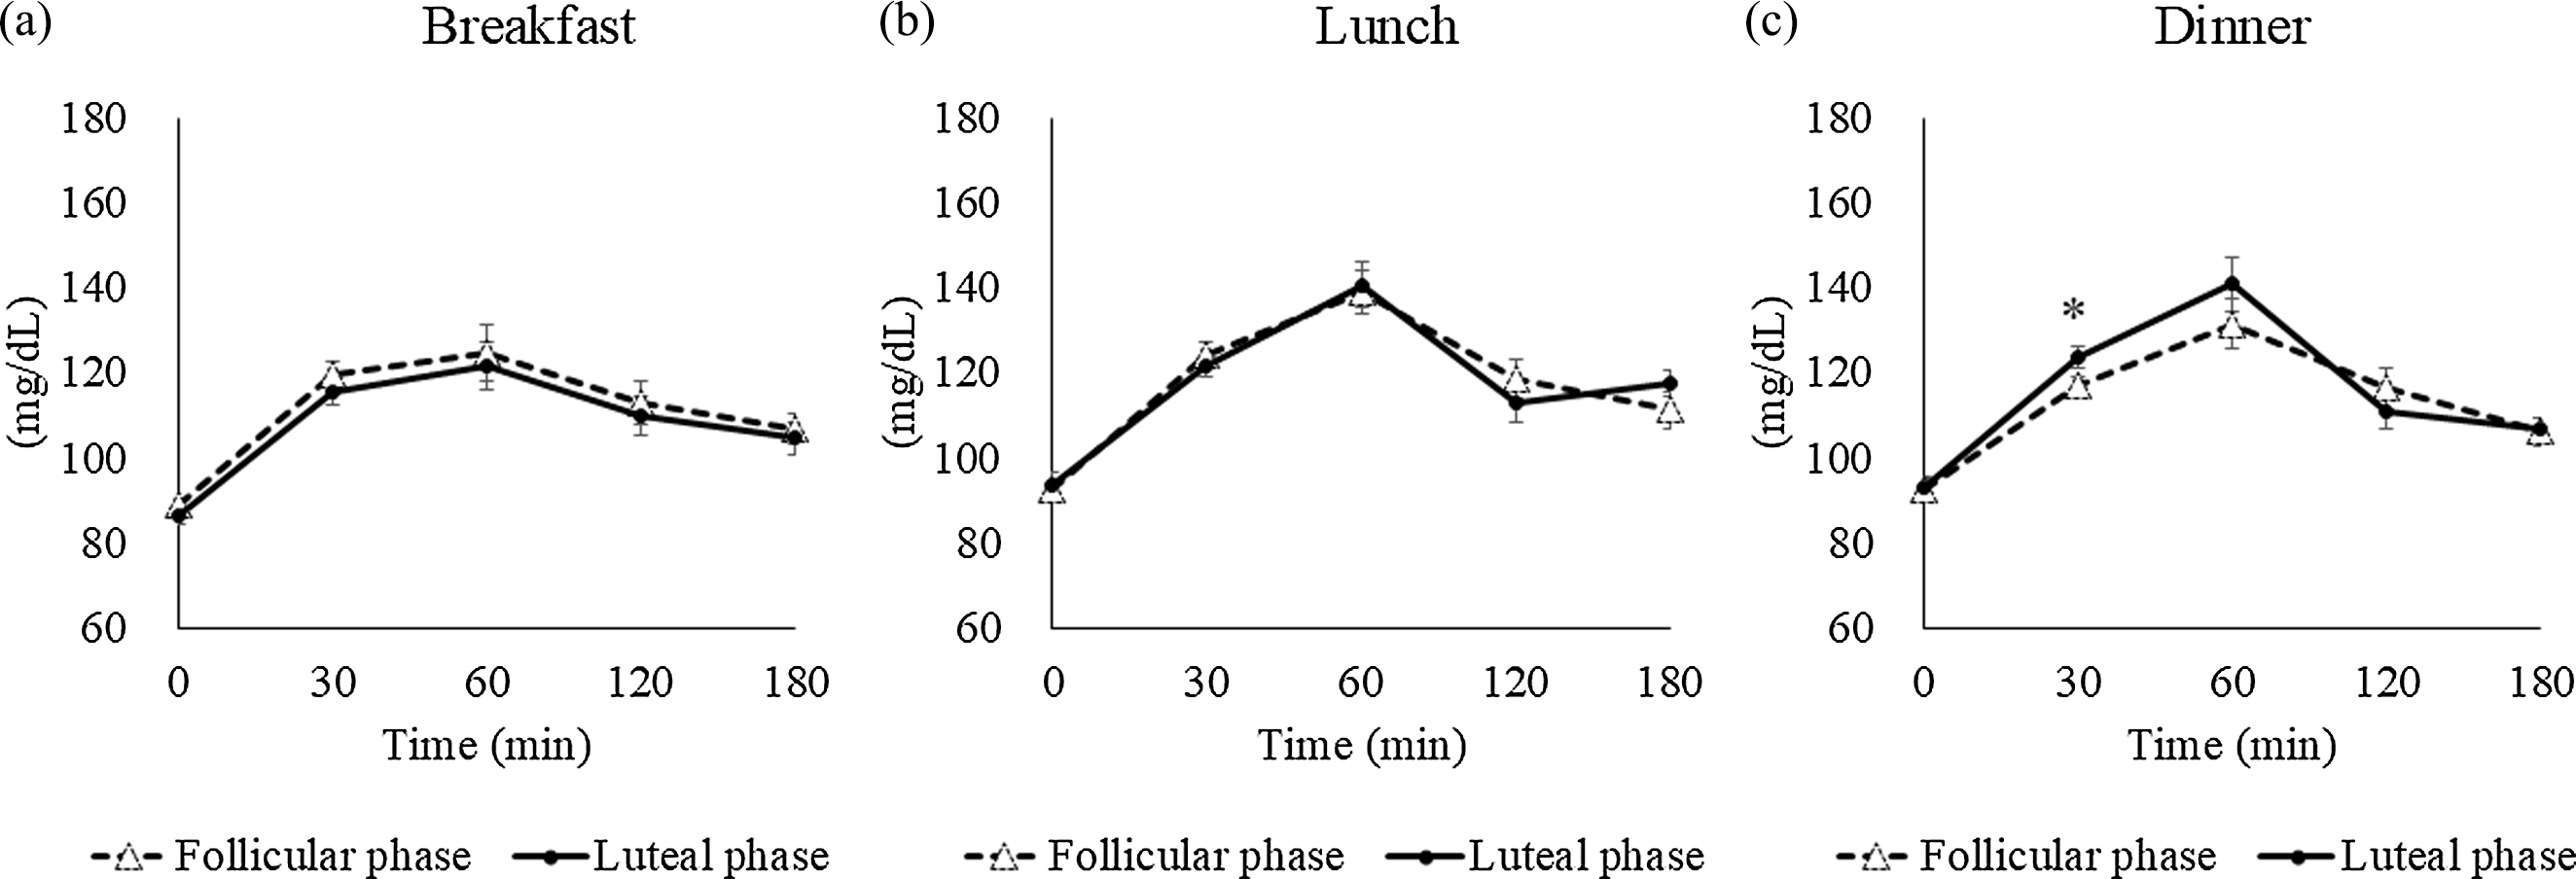
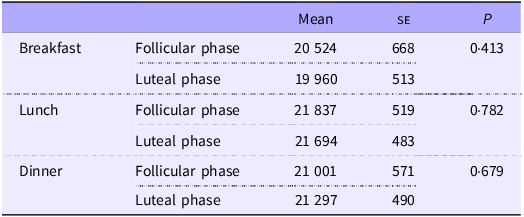
Comparisons of postprandial glucose concentrations between the follicular and luteal phases are shown in Figure 2, with corresponding AUC values presented in Table 2. No significant differences were found in glucose concentrations by phase at breakfast (phase: P = 0·373, time: P = 0·001, phase × time: P = 1·000) or lunch (phase: P = 0·962, time: P = 0·001, phase × time: P = 0·321). However, for dinner, two-factor ANOVA revealed a significant interaction between phase and time (P = 0·039). Post hoc analysis indicated significantly higher glucose concentrations at 30 min in the luteal phase compared with the follicular phase (P = 0·043). No significant differences in AUC values were observed between phases for any meal.
Postprandial glucose concentrations over 3 h in each phase (follicular and luteal): breakfast (a), lunch (b) and dinner (c). Values are means and standard errors. *P < 0·05 compared with the follicular phase (Bonferroni correction for post hoc comparisons).

AUC for 3-h postprandial blood glucose levels (mg × min/dl) for each meal

Table 2. Long description
The table presents the mean, standard error (SE), and P-values for postprandial glucose concentrations during the follicular and luteal phases for breakfast, lunch, and dinner. The table has four rows and three columns. Column headers are Mean, SE, and P. Row labels are Breakfast Follicular phase, Breakfast Luteal phase, Lunch Follicular phase, Lunch Luteal phase, Dinner Follicular phase, and Dinner Luteal phase. Row 1: Breakfast Follicular phase, Mean: 20524, SE: 668, P: 0.413. Row 2: Breakfast Luteal phase, Mean: 19960, SE: 513, P: 0.413. Row 3: Lunch Follicular phase, Mean: 21837, SE: 519, P: 0.782. Row 4: Lunch Luteal phase, Mean: 21694, SE: 483, P: 0.782. Row 5: Dinner Follicular phase, Mean: 21001, SE: 571, P: 0.679. Row 6: Dinner Luteal phase, Mean: 21297, SE: 490, P: 0.679.
All data are presented as means and standard errors.
Diurnal fluctuations in postprandial glucose concentrations by menstrual cycle
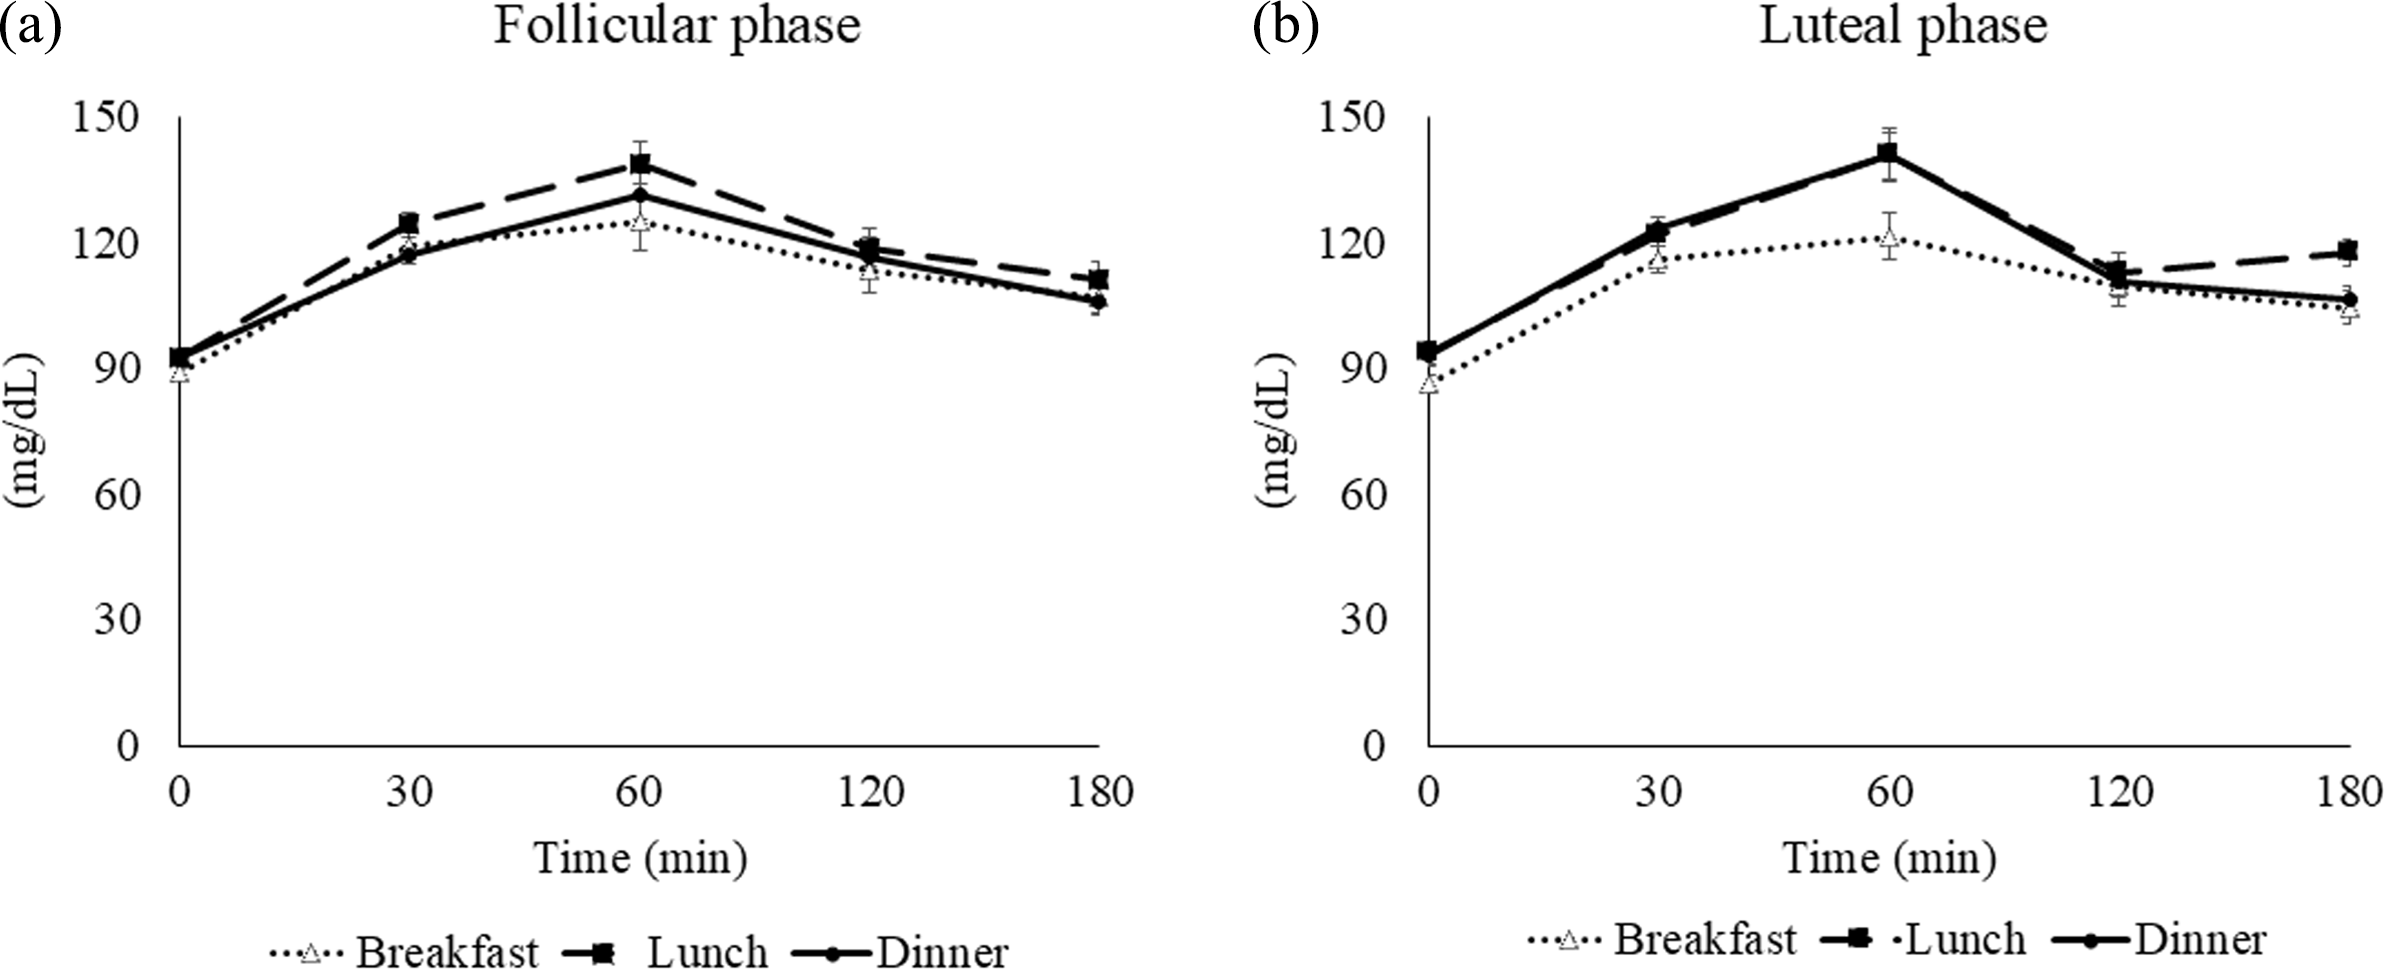
Figure 3 depicts the diurnal variation of postprandial blood glucose levels by menstrual cycle. In the follicular phase, no significant interaction between meal times and postprandial interval and main effect of meal timing were observed. In the luteal phase, no interaction effects were observed. However, a main effect of meal times was observed (time: P = 0·001, meal times: P = 0·001, meal times × time: P = 0·007). Multiple comparisons revealed higher levels after lunch and dinner than after breakfast (P = 0·012 and 0·018, respectively).
Postprandial glucose concentrations over 3 h for each meal (breakfast, lunch and dinner): follicular phase (a) and luteal phase (b). Values are means and standard errors represented by bidirectional bars.

Fluctuations in sex hormones
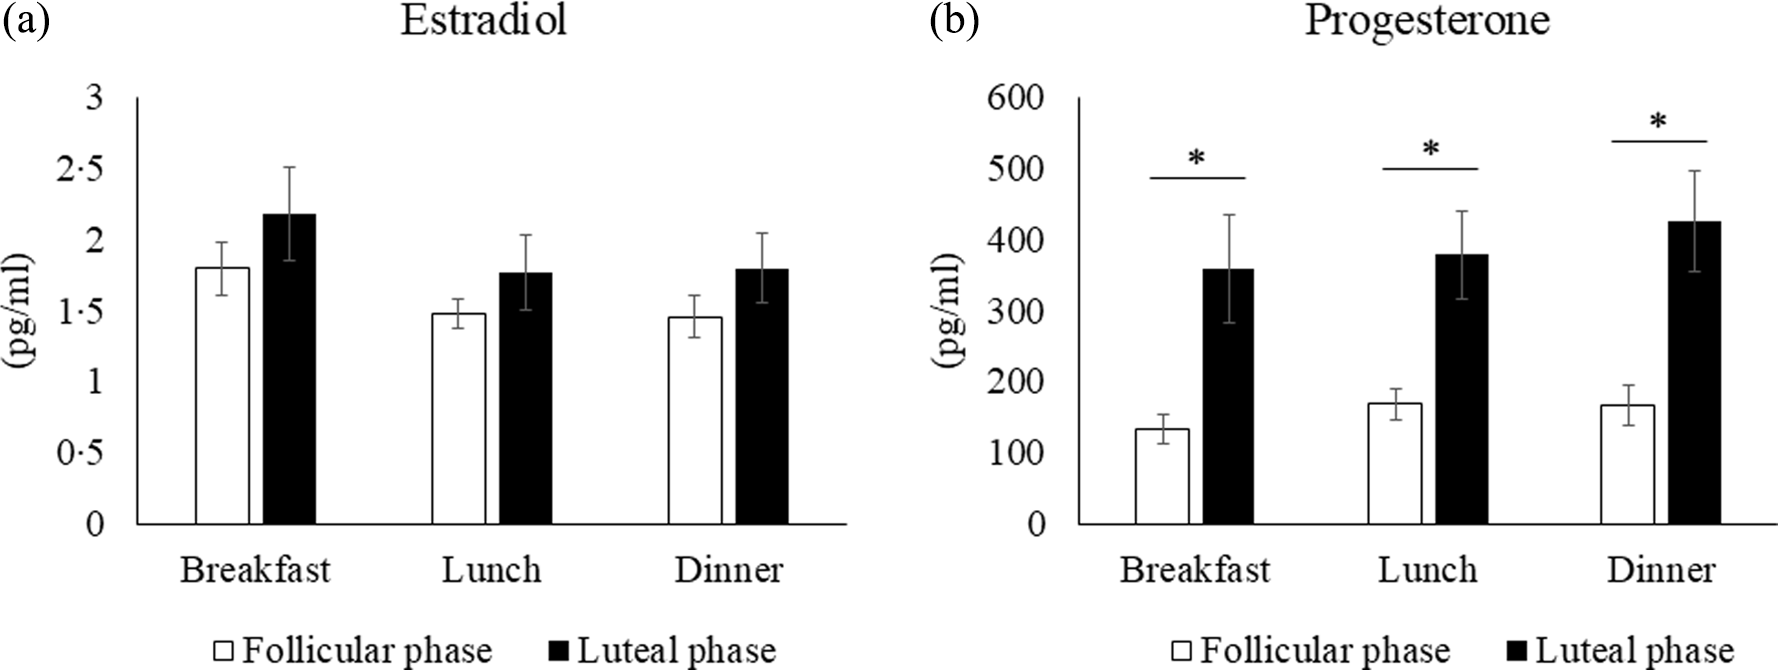
Figure 4 illustrates comparisons of sex hormone concentrations by menstrual cycle across meal times. No significant differences were observed in estradiol levels between phases at any meal (breakfast: P = 0·173, lunch: P = 0·638, dinner: P = 0·211). Progesterone concentrations were significantly higher in the luteal phase than in the follicular phase at all meal times (breakfast: P = 0·005, lunch: P = 0·001, dinner: P = 0·001).
Sex hormone concentrations by menstrual cycle phase at each meal: estradiol (a) and progesterone (b). *P < 0·05 compared with the follicular phase (Wilcoxon signed-rank test).

Variation in core temperature by menstrual cycle
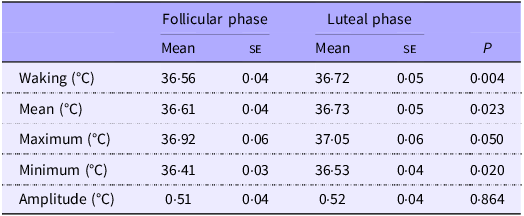
Table 3 summarises core body temperature measurements from the evening before to the trial day. Waking core body temperature was significantly higher in the luteal phase than in the follicular phase (P = 0·004). Similarly, the mean, maximum and minimum bedtime temperatures were significantly higher in the luteal phase than in the follicular phase. However, no significant difference was noted in the amplitude of the bedtime core temperature between the phases.
Core body temperature variations by menstrual phase

Table 3. Long description
A table comparing core body temperature variations by menstrual phase. The table has five rows and six columns. The columns are labeled as Follicular phase Mean, Follicular phase SE, Luteal phase Mean, Luteal phase SE, and P. The rows are labeled as Waking (degrees C), Mean (degrees C), Maximum (degrees C), Minimum (degrees C), and Amplitude (degrees C). Row 1: Waking (degrees C), Follicular phase Mean, 36.56; Follicular phase SE, 0.04; Luteal phase Mean, 36.72; Luteal phase SE, 0.05; P, 0.004. Row 2: Mean (degrees C), Follicular phase Mean, 36.61; Follicular phase SE, 0.04; Luteal phase Mean, 36.73; Luteal phase SE, 0.05; P, 0.023. Row 3: Maximum (degrees C), Follicular phase Mean, 36.92; Follicular phase SE, 0.06; Luteal phase Mean, 37.05; Luteal phase SE, 0.06; P, 0.050. Row 4: Minimum (degrees C), Follicular phase Mean, 36.41; Follicular phase SE, 0.03; Luteal phase Mean, 36.53; Luteal phase SE, 0.04; P, 0.020. Row 5: Amplitude (degrees C), Follicular phase Mean, 0.51; Follicular phase SE, 0.04; Luteal phase Mean, 0.52; Luteal phase SE, 0.04; P, 0.864.
All data are presented as means and standard errors.
Physical activity
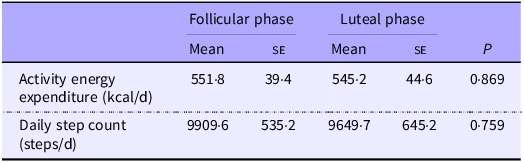
Activity energy expenditure and step count on the trial day are reported in Table 4. No significant differences were found in physical activity between the follicular and luteal phases.
Physical activity by menstrual phase

Table 4. Long description
A table comparing activity energy expenditure and daily step count between follicular and luteal phases. The table has four rows and three columns. Column headers are Follicular phase Mean, Follicular phase SE, Luteal phase Mean, Luteal phase SE, and P. Row labels are Activity energy expenditure (kcal/d) and Daily step count (steps/d). Row 1: Activity energy expenditure (kcal/d), Follicular phase Mean 551.8, Follicular phase SE 39.4, Luteal phase Mean 545.2, Luteal phase SE 44.6, P 0.869. Row 2: Daily step count (steps/d), Follicular phase Mean 9909.6, Follicular phase SE 535.2, Luteal phase Mean 9649.7, Luteal phase SE 645.2, P 0.759.
All data are presented as means and standard errors.
Discussion
To our knowledge, this is the first study to compare blood glucose fluctuations across breakfast, lunch and dinner between the follicular and luteal phases of the menstrual cycle in young females. The main finding was that postprandial glucose concentrations were higher after dinner during the luteal phase than during the follicular phase. These results highlight the importance of considering both the menstrual cycle and time of day in managing blood glucose levels in premenopausal females, particularly the necessity of attention to glucose control at dinner during the luteal phase.
Several factors may contribute to the elevated glucose concentrations observed in the luteal phase, especially at dinner. One key factor is the role of sex hormones. Progesterone, known to promote insulin resistance, predominates during the luteal phase. In the present study, salivary progesterone concentrations were elevated in the luteal phase, consistent with previous findings. Wada et al. demonstrated that progesterone inhibits the translocation of glucose transporter 4 to the plasma membrane by altering the phosphorylation of insulin receptor substrate-1(Reference Wada, Hori and Sugiyama30). Furthermore, progesterone may induce insulin resistance by disrupting insulin signalling in adipocytes. The luteal phase is also characterised by a secondary rise in estradiol(Reference Farage, Neill and MacLean35). De Pirro et al. reported that insulin binding is reduced when both progesterone and estradiol levels are elevated(Reference De Pirro, Fusco and Bertoli36,Reference De Pirro, Forte and Bertoli37) . Moreover, progesterone may antagonise the insulin-sensitising effect of estradiol(Reference D’Eon, Sharoff and Chipkin38–Reference Puah and Bailey40). This interplay between hormones during the luteal phase likely contributes to reduced glucose tolerance and elevated postprandial glucose levels compared with the follicular phase.
Conversely, the relatively lower glucose concentrations observed at dinner during the follicular phase may reflect the diurnal variation of estradiol. It was hypothesised that a nocturnal increase in estradiol during the follicular phase could maintain insulin sensitivity at dinner, thereby suppressing the rise in glucose levels compared with the luteal phase. However, the present study did not observe significant diurnal variations in estradiol, which may reflect two factors. First, samples were collected at a single time point before dinner, unlike in the study by Rahman et al., who assessed hormonal fluctuations at 2-h intervals using plasma estradiol, and therefore may not have captured the evening rise in estradiol(Reference Rahman, Grant and Gooley31). Second, although significant correlations between salivary and serum estradiol have been reported, salivary measurements may still lack sufficient precision to detect subtle hormonal fluctuations, as previous research has indicated an upward bias in salivary estradiol relative to serum values(Reference Arslan, Blake and Botzet41). Future studies should consider serum estradiol with more frequent sampling to more accurately characterise estradiol fluctuations.
Another contributing factor may be circadian variation in glucose tolerance. Glucose tolerance is known to decline over the course of the day, with higher postprandial glucose levels typically observed in the evening(Reference Leung, Huggins and Ware15). This study found no significant intraday glucose variation during the follicular phase, whereas in the luteal phase, glucose concentrations were significantly higher after lunch and dinner than after breakfast. This may be attributed to circadian reductions in metabolic functions such as insulin secretion, amino acid metabolism, glycolytic activity, tricarboxylic acid cycle performance and diet-induced thermogenesis, all of which have been shown to decrease in the evening(Reference Takahashi, Ozaki and Kang18,Reference Mingrone, Nolfe and Castagneto Gissey42,Reference Morris, Garcia and Myers43) . The present findings suggest that the higher glucose concentrations after dinner during the luteal phase may reflect the combined effect of reduced insulin sensitivity and diminished evening glucose tolerance. The absence of significant differences between breakfast and lunch across menstrual phases may be due to preserved glucose tolerance earlier in the day.
Other potential influencing factors include sleep duration and physical activity(Reference Tsereteli, Vallat and Fernandez-Tajes44,Reference Way, Hackett and Baker45) . To control for these variables, participants were instructed to maintain consistent lifestyle habits across trials. Sleep duration on the night before each trial did not differ significantly between phases (follicular phase: 383·8 (se 21·2) min; luteal phase: 378·7 (se 16·5) min). Moreover, ActiGraph measurements revealed no significant differences between phases in activity energy expenditure or daily steps (Table 4). The influence of oral contraceptives on glucose tolerance has also been reported, but no participants in this study were using such medications(Reference Cree, Brennan and Poppitt46,Reference Cortés and Alfaro47) . These controls suggest that the observed differences in glucose concentrations were unlikely to have been confounded by lifestyle factors or medication use.
A key strength of this study lies in its evaluation of postprandial blood glucose concentrations after different meals within the same individuals at different stages of the menstrual cycle while controlling for dietary intake, meal timing and physical activity. Nevertheless, this study also has some limitations. First, we assessed only a single day each in either phase and determined the menstrual cycle phase from changes in core body temperature and sex hormone concentrations. However, given the variability in individual menstrual cycles and the potential for day-to-day fluctuations in hormone secretion, glucose regulation may differ depending on the specific evaluation day. Future studies should assess 2 or 3 consecutive days in each phase to more accurately capture the effects of the menstrual cycle on glycaemic regulation in females. Second, different results may be observed in females with menopause, changes in sex hormones during pregnancy or underlying conditions, such as diabetes mellitus or glucose intolerance. Our findings should be validated in larger and more diverse populations. Third, we focused solely on glucose concentrations. To elucidate the underlying mechanisms, future studies should include more outcome measures, such as insulin, C-peptide and HbA1c. Such data will contribute to the development of personalised glycaemic management strategies for premenopausal females. Fourth, the equal energy distribution of the test meals may have led to a conservative estimate of these phase-dependent differences, particularly at dinner. Indeed, participants were asked via questionnaire to estimate the approximate proportion of each meal relative to their total daily intake, which indicated habitual distributions of approximately 19 % at breakfast, 33 % at lunch and 47 % at dinner. This pattern aligns with the tendency across diverse populations, including Western countries and Japan, for energy intake to increase progressively throughout the day, peaking at dinner(Reference De Castro48–Reference Farsijani, Mao and Cauley51). However, we adopted equal energy distribution across meals to ensure that any observed differences in postprandial blood glucose would capture the effects of menstrual cycle phase and meal timing rather than differences in meal size. Accordingly, the between-meal differences observed in this study may be even more pronounced in daily life, underscoring the importance of post-dinner glycaemic management during the luteal phase. Future studies should employ habitual meal distribution protocols and free-living observational designs pairing continuous glucose monitoring with concurrent dietary assessment to elucidate the influence of the menstrual cycle phase on daily postprandial glucose fluctuations.
Conclusion
This study demonstrated that postprandial glucose concentrations after dinner were higher in the luteal phase than in the follicular phase among healthy young females. These findings underscore the importance of considering meal timing in relation to the menstrual cycle when managing postprandial blood glucose levels.
Acknowledgements
The authors thank all participants for their contributions to this study. The authors also acknowledge Editage for English language editing of the manuscript.
This work was supported by JST SPRING (Japan Grant Number JPMJSP2180 to S.F.) and the Japan Society for the Promotion of Science (KAKENHI grant no. 26K14505 to MT).
S. F.: Conceptualisation-Lead, Data curation-Lead, Formal analysis-Lead, Funding acquisition-Lead, Investigation-Lead, Methodology-Lead, Project administration-Lead, Resources-Lead, Software-Lead, Supervision-Equal, Validation-Lead, Visualisation-Lead, Writing – original draft-Lead and Writing – review and editing-Lead; K. F.: Methodology-Equal and Writing – review and editing-Supporting; A. K.: Conceptualisation-Supporting and Methodology-Supporting; S. I.: Validation-Supporting; Y. K.: Conceptualisation-Equal, Methodology-Equal and Writing – review and editing-Equal; M. T.: Conceptualisation-Equal, Data curation-Equal, Formal analysis-Equal, Funding acquisition-Equal, Investigation-Equal, Methodology-Equal, Project administration-Equal, Resources-Equal, Software-Equal, Supervision-Equal, Validation-Equal, Visualisation-Equal, Writing – original draft-Equal, and Writing – review and editing-Equal.
The authors have no conflicts of interest to declare.
The data supporting the findings of this study are available from the corresponding author upon reasonable request.
This study was conducted in accordance with the Declaration of Helsinki and was approved by the Ethics Committee of the Institute of Science Tokyo (approval number: 2024213).


 Open access

