Introduction
Polyvinylidene fluoride (PVDF) is a widely studied polymer for its high ferroelectric response among polymers.[Reference Kawai1–Reference Fukada3] PVDF is a semi-crystalline material, possessing a unique molecular conformation with a repeated unit of (−CF2−CH2−), that has a large dipole moment of 7.58 × 10⁻²⁸ C cm.[Reference Ye, Jiang, Wu and Zeng4] It can be morphed into four different states; α, β, γ, and δ, where it is naturally found in the electrically unresponsive, α-phase.[Reference Sajkiewicz, Wasiak and Gocłowski5] Since its discovery, PVDF β-phase has gained a large amount of scientific interest due to its unique planar zigzag (TTT) conformation that presents the highest net-dipole moment among its crystal phases.[Reference Salimi and Yousefi6] Along with its high piezoelectric response, its chemical robustness, mechanical properties, high flexibility, and low-cost make it an ideal material to be used in the areas of tactile and strain sensors, transducer, energy storage and harvesting, etc.[Reference Kim, Torres, Villagran, Stewart, Lin and Tseng7] One of the real application using PVDF devices is a novel energy harvesting backpack that can generate electrical energy from the differential forces between the wearer and the pack. The shoulder straps of the backpack were made of piezoelectric PVDF films which endure up to 105 N tensile loads and charge portable electronics.[Reference Granstrom, Feenstra, Sodano and Farinholt8] In order to fabricate this PVDF device, there are several traditional fabrication methods for preparing PVDF films such as solvent casting, spin coating, and hot embossing,[Reference Chiolerio, Lombardi, Guerriero, Canavese, Stassi and Gazia9] which are simple effective ways to fabricate PVDF films. However, these traditional methods have disadvantages such as time consuming, design limit and large scale, and complexity of fabrication process.[Reference Kim, Fernando, Li, Lin and Tseng10–Reference Sun, Chang, Li and Lin12]
Recently, additive manufacturing technology has been introduced to print piezoelectric 3D structures.[Reference Kim, Torres, Villagran, Stewart, Lin and Tseng7, Reference Kim, Torres, Islam, Islam, Chavez and Garcia Rosales13–Reference Kim, Zhu, Qu, Aaronson, McCall and Chen15] It is reported that the fused filament fabrication (FFF) 3D printing process significantly improves homogeneous dispersion of piezoelectric ceramic nanoparticles in the poly(vinylidene) fluoride (PVDF) matrix. This enhanced piezoelectric properties by alleviating agglomeration and removing voids and cracks[Reference Kim, Torres, Villagran, Stewart, Lin and Tseng7,Reference Kim, Fernando, Li, Lin and Tseng14] within the 3D-printed nanoblend structure. In addition, the FFF 3D printing technique is integrated with corona poling, which is one of the traditional poling processes, to simplify the fabrication of piezoelectric PVDF films in two sequential processes.[Reference Kim, Torres, Wu, Villagran, Lin and Tseng16] FFF 3D printing-based piezoelectric nanoblends have improved recently contributing to the advances in design flexibility and simple fabrication of low-cost flexible sensor (d 31 ~0.048 pC/N) and energy storage (ε = 118 and δ = 0.11 at 1 kHz) devices.[Reference Kim, Torres, Wu, Villagran, Lin and Tseng16,Reference Kim, Johnson, Chavez, Rosales, Tseng and Lin17] Bodkhe et al. developed the solvent evaporation-assisted single-step printing process to print piezoelectric PVDF nanoblends 3D structure sensor (d 31 ~18 pC/N) without electrical poling process. This process combines the paste extrusion fabrication (PEF) 3D printing process with a conventional solvent casting which enables PVDF to naturally be polarized due to solvent evaporation and aligned along with ceramic nanoblends.[Reference Bodkhe, Turcot, Gosselin and Therriault18] However, these FFF and PEF 3D printing processes have some disadvantages, for example, weak tensile strength perpendicular to the build axis, poor surface finish, and delamination from temperature fluctuation compared to other additive manufacturing techniques.[Reference Vaezi, Chianrabutra, Mellor and Yang19]
In contrast, stereolithography (SLA) 3D printing process has an ability to resolve these issues.[Reference Song20] While the FFF 3D printing deposits melted polymer chains on top of previously solidified polymer layer without a real chemical bonding between them, SLA 3D printing enables the polymer chains to cross-link as the layer is being formed. As a result of this, there is a greater level of uniformity in mechanical properties in the part.[Reference Stansbury and Idacavage21] For example, mechanical anisotropy of the SLA 3D-printed parts was seen in approximately 1%, while 50% difference in mechanical properties for FFF 3D-printed ones.[Reference Dizon, Espera, Chen and Advincula22]
SLA was the first additive manufacturing process introduced in the mid-1980s.[Reference Hull23] It builds a 3D structure based on photopolymerization of liquid resin comprised of monomer, photoinitiator, and other additives. The ratio and additives induce the desired mechanical properties. For these reasons, using digital light processing 3D printing under the category of SLA 3D printing, researchers designed piezoelectric blends to optically fabricate photosensitive polymer-based BaTiO3 (BT) nanoblends with the surface modification method.[Reference Kim, Zhu, Qu, Aaronson, McCall and Chen15] This photosensitive polymer was induced to encapsulate piezoelectric nanoparticles during photopolymerization. This technique can produce a 3D structure of piezoelectric blends, possessing a high piezoelectric coefficient (d 33 ~39 pC/N) through the thermal poling post-process.[Reference Kim, Zhu, Qu, Aaronson, McCall and Chen15] Recently, more researches have been carried out to study 3D printing of shape memory polymer (SMP) using the SLA technique with a modified heat resin tank to enable SMP to be photopolymer printable.[Reference Zarek, Layani, Cooperstein, Sachyani, Cohn and Magdassi24]
Application of the utilization of the inherent piezoelectric properties of the PVDF to the SLA 3D printing technique could be an attractive way to fabricate photopolymer-based PVDF 3D structure. PVDF polymer is a highly non-reactive thermoplastic fluoropolymer produced by the polymerization of vinylidene difluoride which is widely used in applications such as membrane, flexible sensor, and energy harvesting in human body and industry, requiring the highest purity and resistance to solvents, acids, and hydrocarbons.[25] In addition, the SLA 3D printing technique can provide better surface finish, design freedom, compared to FFF 3D printing and other traditional methods.[Reference Chiolerio, Lombardi, Guerriero, Canavese, Stassi and Gazia9] However, the PVDF and photopolymer resin (PR) are not miscible with one another. Hence, mixing PVDF directly with the PR produces sediments and agglomerates of PVDF and eventually produces a poor piezoelectric response. This is because of the agglomeration of a high amount of solid PVDF powder in the resin and thereby the interface between PVDF agglomerates and the PR is not strongly connected to each other. This is considered as polymer blends consisting of polymer particles dispersed in the resin matrix. As a result, the external forces are unable to properly apply onto PVDF polymer molecular chains. Therefore, it is necessary to remove any agglomeration of PVDF by dispersing each individual PVDF molecular chain into the PR further to enhance the piezoelectric response. Typically, strong polar solvents, such as N,N-Dimethylformamide (DMF), N-Methyl-2-pyrrolidone, are widely used to uniformly disperse PVDF molecular chains for piezoelectric sensor and Li-ion battery applications.[Reference Liu, Hashim, Liu, Abed and Li26–Reference Žagar and Žigon29]
In this study, we investigated the fabrication of piezoelectric photopolymer-based PVDF blends by exploiting the top-down projection-based SLA 3D printing technique. The performance of the 3D-printed piezoelectric blends was evaluated in terms of β-phase transformation and piezoelectric coefficient. The β-phase transformation was investigated by the FTIR spectroscopy whereas the piezoelectric coefficient was measured by the dynamic load frame. The DMF was utilized as a solvent to uniformly disperse the PVDF molecular chains into the PR. In this regard, optimal ratios between PVDF and DMF, and between PVDF and the PR in terms of 3D printability, precipitation, and piezoelectric properties were also studied. This study is focused on the development of polymer formulation and printing parameters to demonstrate the ability to fabricate all-polymer piezoelectric structures using SLA 3D printing. The novelty of this study is the demonstration to fabricate such polymer blends using commercially available machines and matrix resins.
In future, it is believed that this work will potentially provide a cornerstone for researchers to develop 3D printing techniques of all polymer-based piezoelectric PR, for the possible use in the areas of biotechnology and sensor industry requiring flexible polymer blends with higher quality finished surface and design flexibility.
Experimental
Materials
Commercial PR (clear resin, formlabs®, Somerville, MA, USA) was used as the main component for photopolymer-based PVDF blends. It is composed of mixtures of methacrylate monomer, methacrylate oligomer, and photoinitiator. PVDF powder (MW~534,000; Sigma-Aldrich, San Bruno Blvd, San Francisco, CA) was used as piezoelectric polymer additives. DMF (OmniSolv®) was used as the solvent material to disperse PVDF into the PR.
Fabrication process
PVDF powder was dissolved in DMF at a temperature of 75°C in a water bath for 15 min. The PR was added to PVDF solution under maintained temperature. Then a total of 100 g of the final mixture was stirred by magnetic stirrer (600 rpm) for 20 min to achieve uniform dispersion. Schematic synthesis process is illustrated in Supplementary Fig. S1(a). The commercial SLA 3D printer (Form 1+) purchased from formlabs® was used to 3D print sample films in the dimension of 30 × 5 × 1 mm as shown in Supplementary Figs. S1(b) and S1(c). A layer thickness of 100 µm was used for all the samples as the printing resolution. After 3D printing, the samples were cleansed with ethanol and then dried for 15 h in a vacuum oven (25 in Hg) to remove the DMF. Electrical poling was conducted under 3 MV/m for 15 h at room temperature in order to test them in the dynamic load frame for piezoelectric response.
Structural, morphological, and functional characterizations
The morphology of the nanoblends was observed in a scanning electron microscopy (SEM, TM-1000, Hitachi). X-ray diffraction was performed on each sample in order to characterize crystallinity using CuKα radiation on a D8 Discover diffractometer (Bruker, USA). Fourier transform infrared spectroscope (FTIR, Agilent Technologies Cary 630 ATR-IR) analysis was performed in the 600–1600 cm−1 wavenumber range at room temperature in order to characterize the infrared spectrum of absorption of 3D-printed samples. Piezoelectric output current and voltage were measured by fatigue load frame (Bose ElectroForce) and Pico-ammeter (Keithley 6485).
Experimental set-up
To quantify the piezoelectric property of PVDF/PR blends, 3D-printed samples were prepared with 3 × 10 mm silver paint electrodes on the top and bottom surfaces. The electrodes were then extended with Cu tape to allow a proper connection with the Pico-ammeter for current measurement as shown in Supplementary Fig. S2(a). Dynamic force was applied on the 3D-printed samples to measure the periodic output current. Fatigue load frame generated 30 cyclic loads on the sample under different ranges from 0 to 20, 40, 60, and 80 N at 1 Hz, while the Pico-ammeter was used to measure the current output. To prevent noise from the fatigue machine during the measurement, two grips holding the sample were covered with insulating tape as shown in Supplementary Fig. S2(b).
Results and discussion
Polymerization mechanism
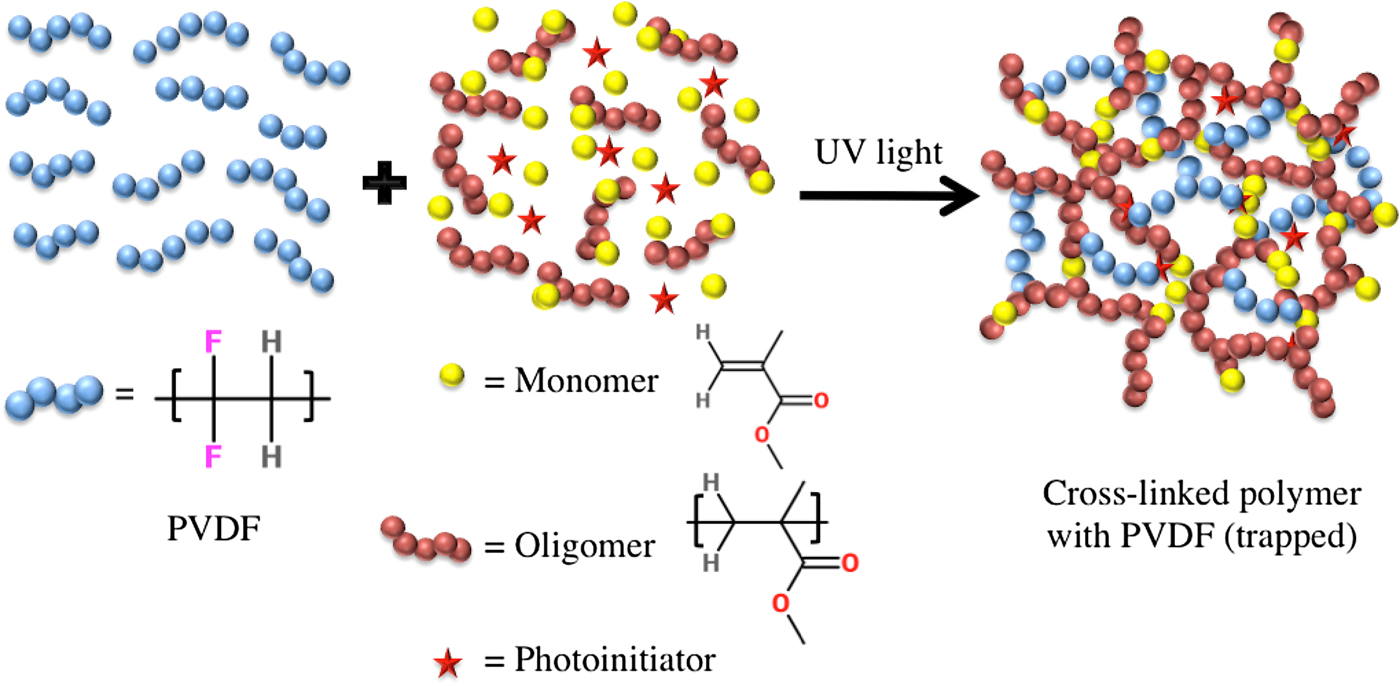
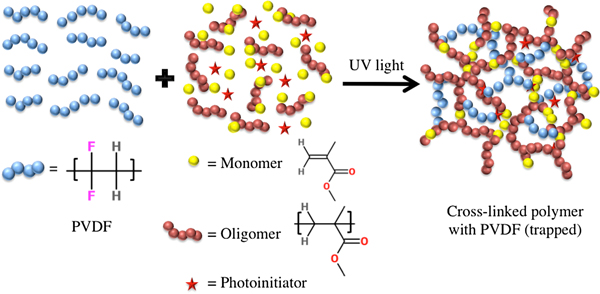
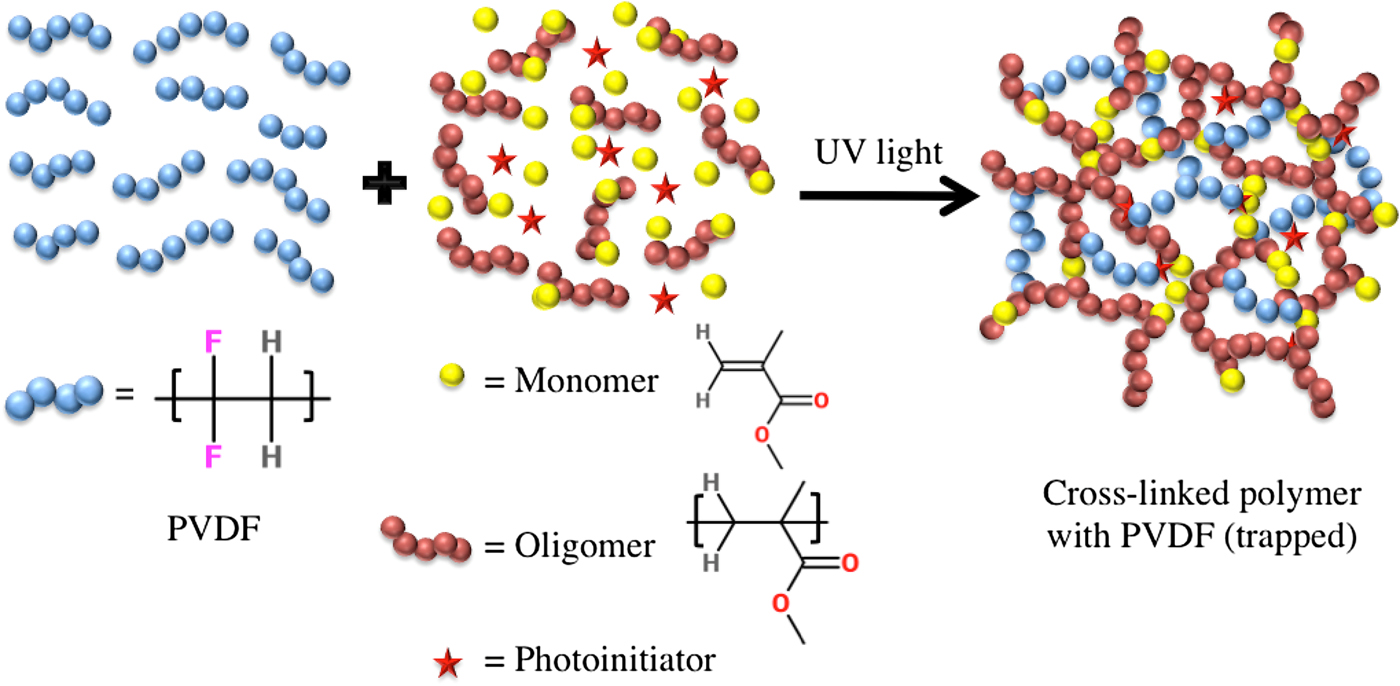
Figure 1 schematically illustrates the photopolymerization of the methacrylate monomer and oligomer along with the PVDF that is previously dispersed in the PR. When the mixture is exposed to UV light, the photoinitiator absorbs the light energy and dissociates into free radicals, which are highly reactive, and initiates the radical catalyzed polymerization of the oligomer and the monomer. This step where free radicals are generated called as the initiation step of the photopolymerization. After the radical is generated, it triggers the polymerization of the monomer and the oligomers increasing the chain length and cross-linking of the polymer, which is also called as the propagation. In detail, each free photogenerated radical has an unpaired electron and is highly unstable so that this free radical attacks and breaks the C=C of the methacrylate monomer and the oligomer into repeating units of [–C–C–]n to combine and create myriads of carbon radicals.[Reference Cai and Jessop30] These newly generated carbon radical attacks more of the C=C of the methacrylate and combine with them to form the long polymer chain with cross-linking. This process continues until every single monomer and oligomer is consumed to form the polymer.[Reference Song20] At this stage of the polymerization, the propagation step stops and it leads to the termination step. In the termination step, two radicals combine together to make a sigma bond and this step consumes all the radicals and terminates the polymerization process. However, during the propagation step, the PVDF molecules become trapped within the three-dimensional cross-linked structure of the polymer.
Schematic representation for the photopolymerization of the methacrylate monomer and oligomers along with the PVDF solution in DMF.
Enhancement of piezoelectricity and manufacturability
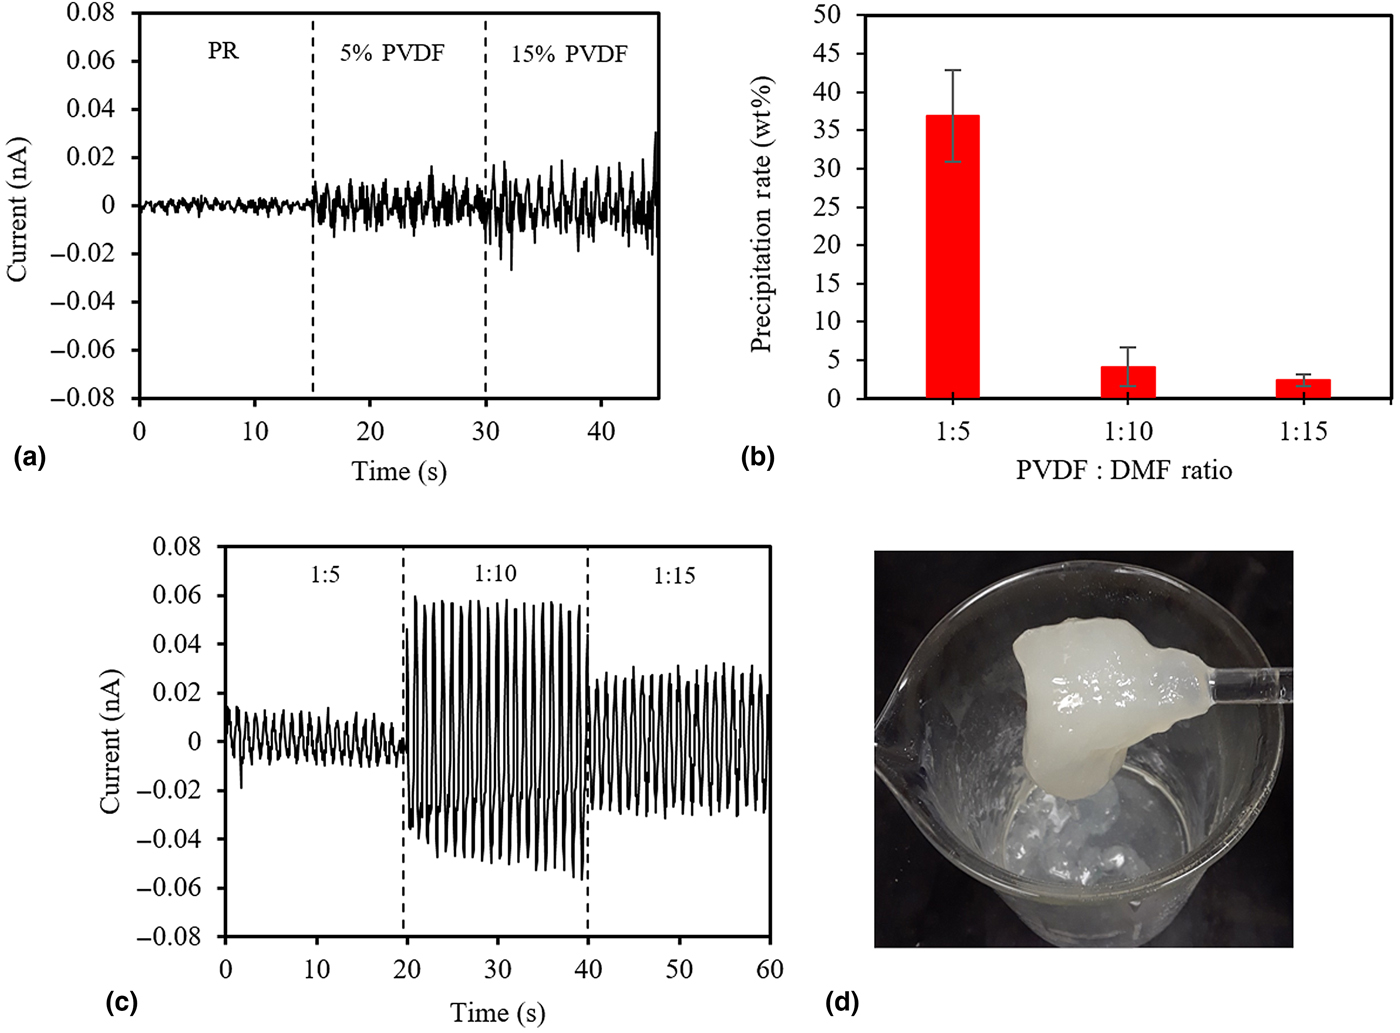
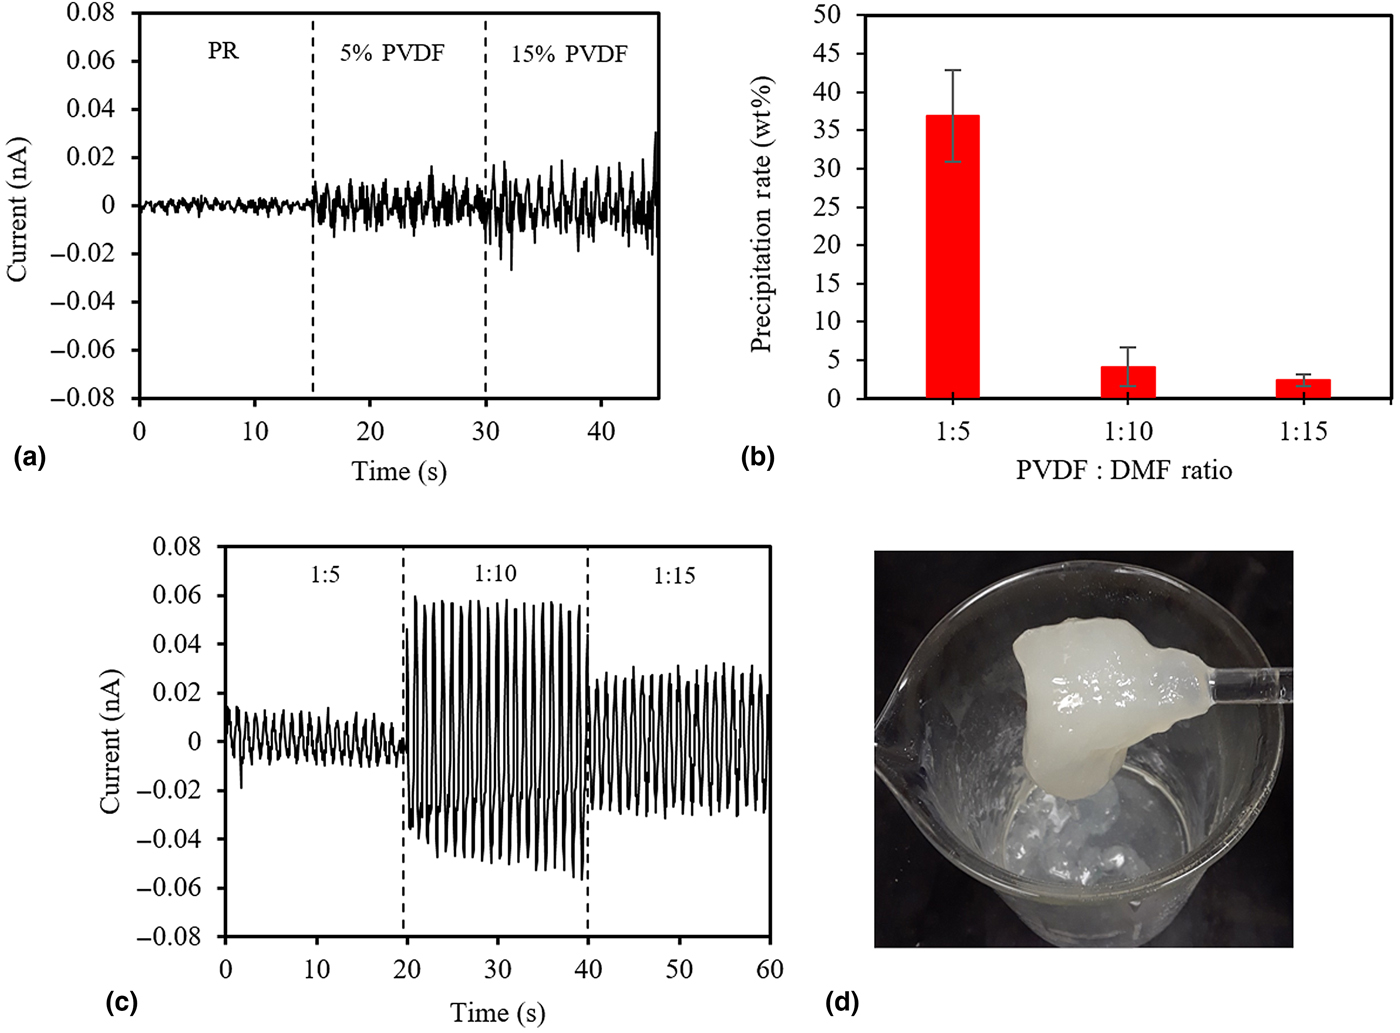
Firstly, it is necessary to determine whether or not the dissolution process of PVDF is required in order to attain maximal piezoelectricity. Therefore, 5 and 15 wt%-PVDF powders were directly dispersed into the PR at 75°C and sonicated for 15 min for uniform dispersion. Afterward, all the processes were performed as described in the Experimental section. The characterization of piezoelectricity was simplified by using a fatigue load frame and the Pico-ammeter to measure the output current from the SLA 3D-printed blends. Figure 2(a) shows that the current output of SLA 3D-printed blends slightly increases to ±0.015 nA, as the PVDF amount increases from 0 to 15 wt%. This insignificant enhancement of piezoelectricity observed can be explained by the PVDF agglomerates present in the resin. In addition, the low piezoelectric coupling efficiency between PVDF agglomerates and the PR have led to the low piezoelectric output current. In order to avoid the agglomeration of the PVDF and enhance the coupling efficiency, the strong solvent is necessary to dissolve the PVDF powder homogeneously in the PR. In this study, PVDF powder is dissolved in DMF as a strong polar solvent. However, it was observed that the PVDF precipitated in the PR because it is assumed that the PR is much weaker (i.e., poorer) solvent for PVDF than DMF. It was found that there is a saturation point where the PR can accommodate the PVDF solution. Similar phenomena were reported by other studies as well.[Reference Inceoglu, Olugebefola, Acar and Mayes31–Reference Wang, Li and Teo33] However, this study demonstrates various process variables and conditions to enhance the dispersion in the PR without the agglomeration of the PVDF, which is eventually compatible with SLA 3D printing technique. By experimental iteration changing the ratio of PVDF:DMF in the PR, the optimal ratio of PVDF and DMF for the PR can be obtained. As shown in Fig. 2(b), the precipitation percentage diminishes from 36.9 to 2.4 wt% as increasing the DMF amount. This means that more DMF solvent reduces precipitation of PVDF molecules and helps it disperse within the PR. It is noted that the precipitation rate was calculated by measuring the bulk precipitated polymer out of total resin blend mixture as shown in Fig. 2(d). Figure 2(c) shows that the piezoelectric current output results on samples made of 2 wt%-PVDF/PR with various DMF solvent ratios. It was found that 1:10 ratio performs the best compared to other ratios. It generated an output current of ±0.055 nA which is 3.5 times higher than the one from 15 wt%-PVDF/PR without dissolution process (Note that all PVDF/PR samples without electrical poling showed no current output). 1:15 ratio shows lower current output because it is assumed that a higher amount of DMF solvent, which is almost close to the amount of the PR, dilutes PVDF content as well as the PR. In addition, since 1:15 ratio contains higher DMF solvents, the final product becomes softer as ratio increases. Additionally, the PR becomes no n-printable at more than 1:15 ratio due to the overwhelmed amount of DMF solvent.
(a) Piezoelectric output current of pure PR, 5 and 15 wt%-PVDF/PR blends under dynamic force of 60 N at 1 Hz before dissolution treatment, (b) precipitation rate (wt%) at PVDF:DMF ratio of 1:5, 1:10, and 1:15, and (c) piezoelectric output current of 2 wt%-PVDF/PR at PVDF:DMF ratio of 1:5, 1:10, and 1:15, and (d) bulk precipitation polymerization observed when PVDF was mixed with PR in a 1:5 ratio.
Characterizations by SEM, XRD, and FTIR analyses
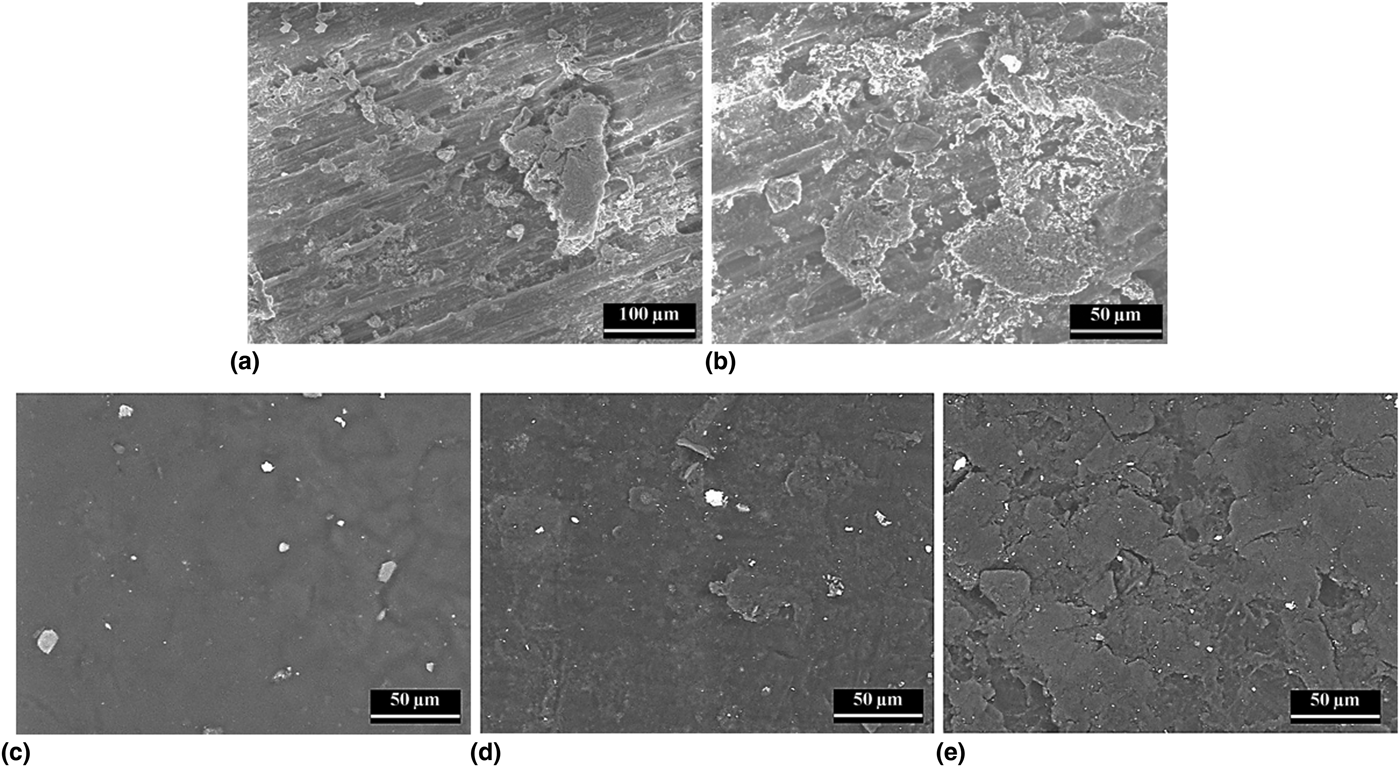
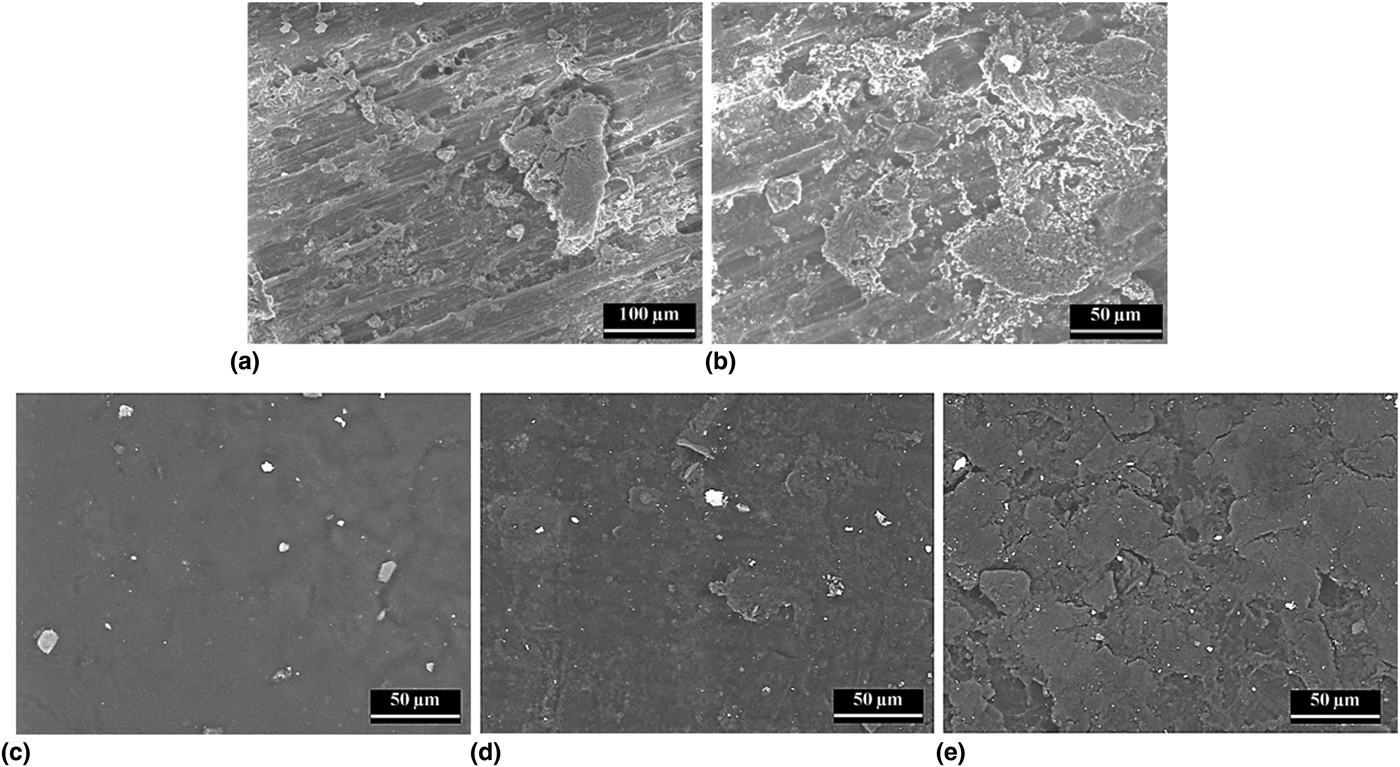
Based on the attained optimal ratio (1:10) for PVDF:DMF, increasing contents (1, 2, 4, and 5 wt%) of PVDF within the PR and pure PR are 3D printed and characterized to analyze the surface morphology and phase of PVDF of each sample using SEM, XRD, and FTIR. In Figs. 3(a) and 3(b), surface images of 5 wt%-PVDF/PR without DMF dissolution treatment indicate that a high amount of PVDF particles was agglomerated on the PR matrix and the PVDF agglomerates were clearly dissociated from the PR matrix, thus PVDF particles are not soluble in the PR. (Note that it is difficult to capture high quality of morphology due to reflection of electron beam from PVDF agglomerates.) Figure 3(c) shows a surface image of pure PR which has a smooth surface. It is noted that white particles shown on the surface are debris or contaminates. On the contrary of pure PR, the surface of the sample becomes coarser as increasing PVDF as shown in Figs. 3(d) and 3(e). Apparently, no PVDF agglomerates were found but PVDF is well associated with the PR matrix. It could be inferred that precipitation polymerization in the micro-scale has occurred within the PR.
SEM images for surfaces of 3D-printed (a and b) 5 wt%-PVDF/PR blends without DMF dissolution treatment, (c) pure PR, (d) 2 wt%-PVDF/PR, and (e) 5 wt%-PVDF/PR blends with DMF dissolution treatment.
The XRD patterns of each sample are characterized as shown in Supplementary Fig. S3(a). Reflections at 20.0° (110) and 18.4° (020) corresponding to α-phase of PVDF are observed at all the samples that contain PVDF.[Reference Kim, Fernando, Li, Lin and Tseng14] Since PVDF content in 3D-printed blends is small, quantitative analysis for β- and γ-phases transformation using the XRD would be difficult to be determined. Therefore, the FTIR analysis was conducted for quantitative analysis of phase transformation on PVDF after electric poling process and determine the presence of different functional groups in the PVDF/PR blends.
The FTIR spectra for α-, β-, and γ-phases were analyzed at IR absorption bands of 762, 808, and 835 cm−1, respectively, as shown in Supplementary Fig. S3(b).[Reference Kim, Fernando, Li, Lin and Tseng14, Reference Cai, Lei, Sun and Lin34–Reference Ince-Gunduz, Alpern, Amare, Crawford, Dolan and Jones36] Due to the transparency of the 1 and 2 wt%-PVDF/PR samples and limited sensitivity of FTIR instrument on small PVDF concentration, it is assumed that peaks correspond to α- and β-phases were not detected except for 4 and 5 wt%-PVDF/PR samples. Based on the Lambert–Beer law,[Reference Kim, Torres, Villagran, Stewart, Lin and Tseng7, Reference Kim, Torres, Islam, Islam, Chavez and Garcia Rosales13, Reference Kim, Fernando, Li, Lin and Tseng14] β-phase contents of 4 and 5 wt%-PVDF/PR were calculated as 35.6% and 32.3%, respectively, before electric poling and increased to 39.0% and 35.4% after electric poling as shown in Supplementary Fig. S1. A peak corresponds to γ-phase was slightly shifted to the right and grew sharply as PVDF content increases, meaning that the electric poling process has induced some of PVDF dipoles to be aligned for active materials. The presence of different functional groups in the methacrylate PR and its blends with PVDF was also conducted to determine by FTIR spectroscopic analysis. The FTIR spectra of the commercial methacrylate PR showed the presence of hydroxyl (O–H), aliphatic (C–H), and carbonyl (C=O) functional groups by their characteristic stretching vibrations at 3331, 2920, and 1700 cm−1, respectively, as shown in Supplementary Fig. S4.[Reference Ishtiaque Shuvo, Rodriguez, Islam, Karim, Ramabadran and Noveron37–Reference Pal, Islam, Moore, Reyes, Pardo and Varela-Ramirez39] The ester (C–O–CH3) functional group could also be identified by the characteristic vibrations at 1240 and 1104 cm−1.[Reference Biswas, Libera, Darling and Elam40] The alkyl CH bending of CH3 and CH2 could be located at 1452 and 1530 cm−1.[Reference Biswas, Libera, Darling and Elam40] Moreover, the peak at 1635 cm−1 corresponds to the C=C stretching vibration of the methacrylate monomer. All of these vibrational frequencies are characteristic to the methacrylate in the monomeric form with the presence of some OH-containing functional groups in the resin. We assume that the OH vibrations originated from the physisorbed moisture. Similar phenomenon was observed by previously published reports.[Reference Duan, Zhang, Li, Yang, Lu and Wang41] On the other hand, as shown in Supplementary Fig. S4, the FTIR spectra of the methacrylate PR after the polymerization demonstrated all the characteristic peaks of the resin except the disappearance of the C=C peak at 1636 cm−1, which suggests an efficient photopolymerization of the resin. The methacrylate polymer also showed the OH-containing functional groups at 3331 cm−1. Similar FTIR spectrum was observed by previously published reports, where it was considered to happen due to the physisorbed moisture.[Reference Duan, Zhang, Li, Yang, Lu and Wang41] Moreover, the FTIR spectra of the PVDF-containing methacrylate polymer blend showed additional peaks in Supplementary Fig. S4, which are characteristic to the functional group of the PVDF. For example, the C–F stretching vibrations of the α, β, and γ-crystalline phases of the PVDF could be observed at 762, 808, and 835 cm−1, respectively.[Reference Bai, Wang, Zhou and Zhang42] From the FTIR analysis, it was observed that all the PVDF-containing methacrylate polymer blends (viz. 5% PVDF) had no or very low percentage of moisture compared to the pure methacrylate polymer. We assume that the hydrophobic nature of the PVDF prevented the moisture physisorption on the blends.
Piezoelectric properties
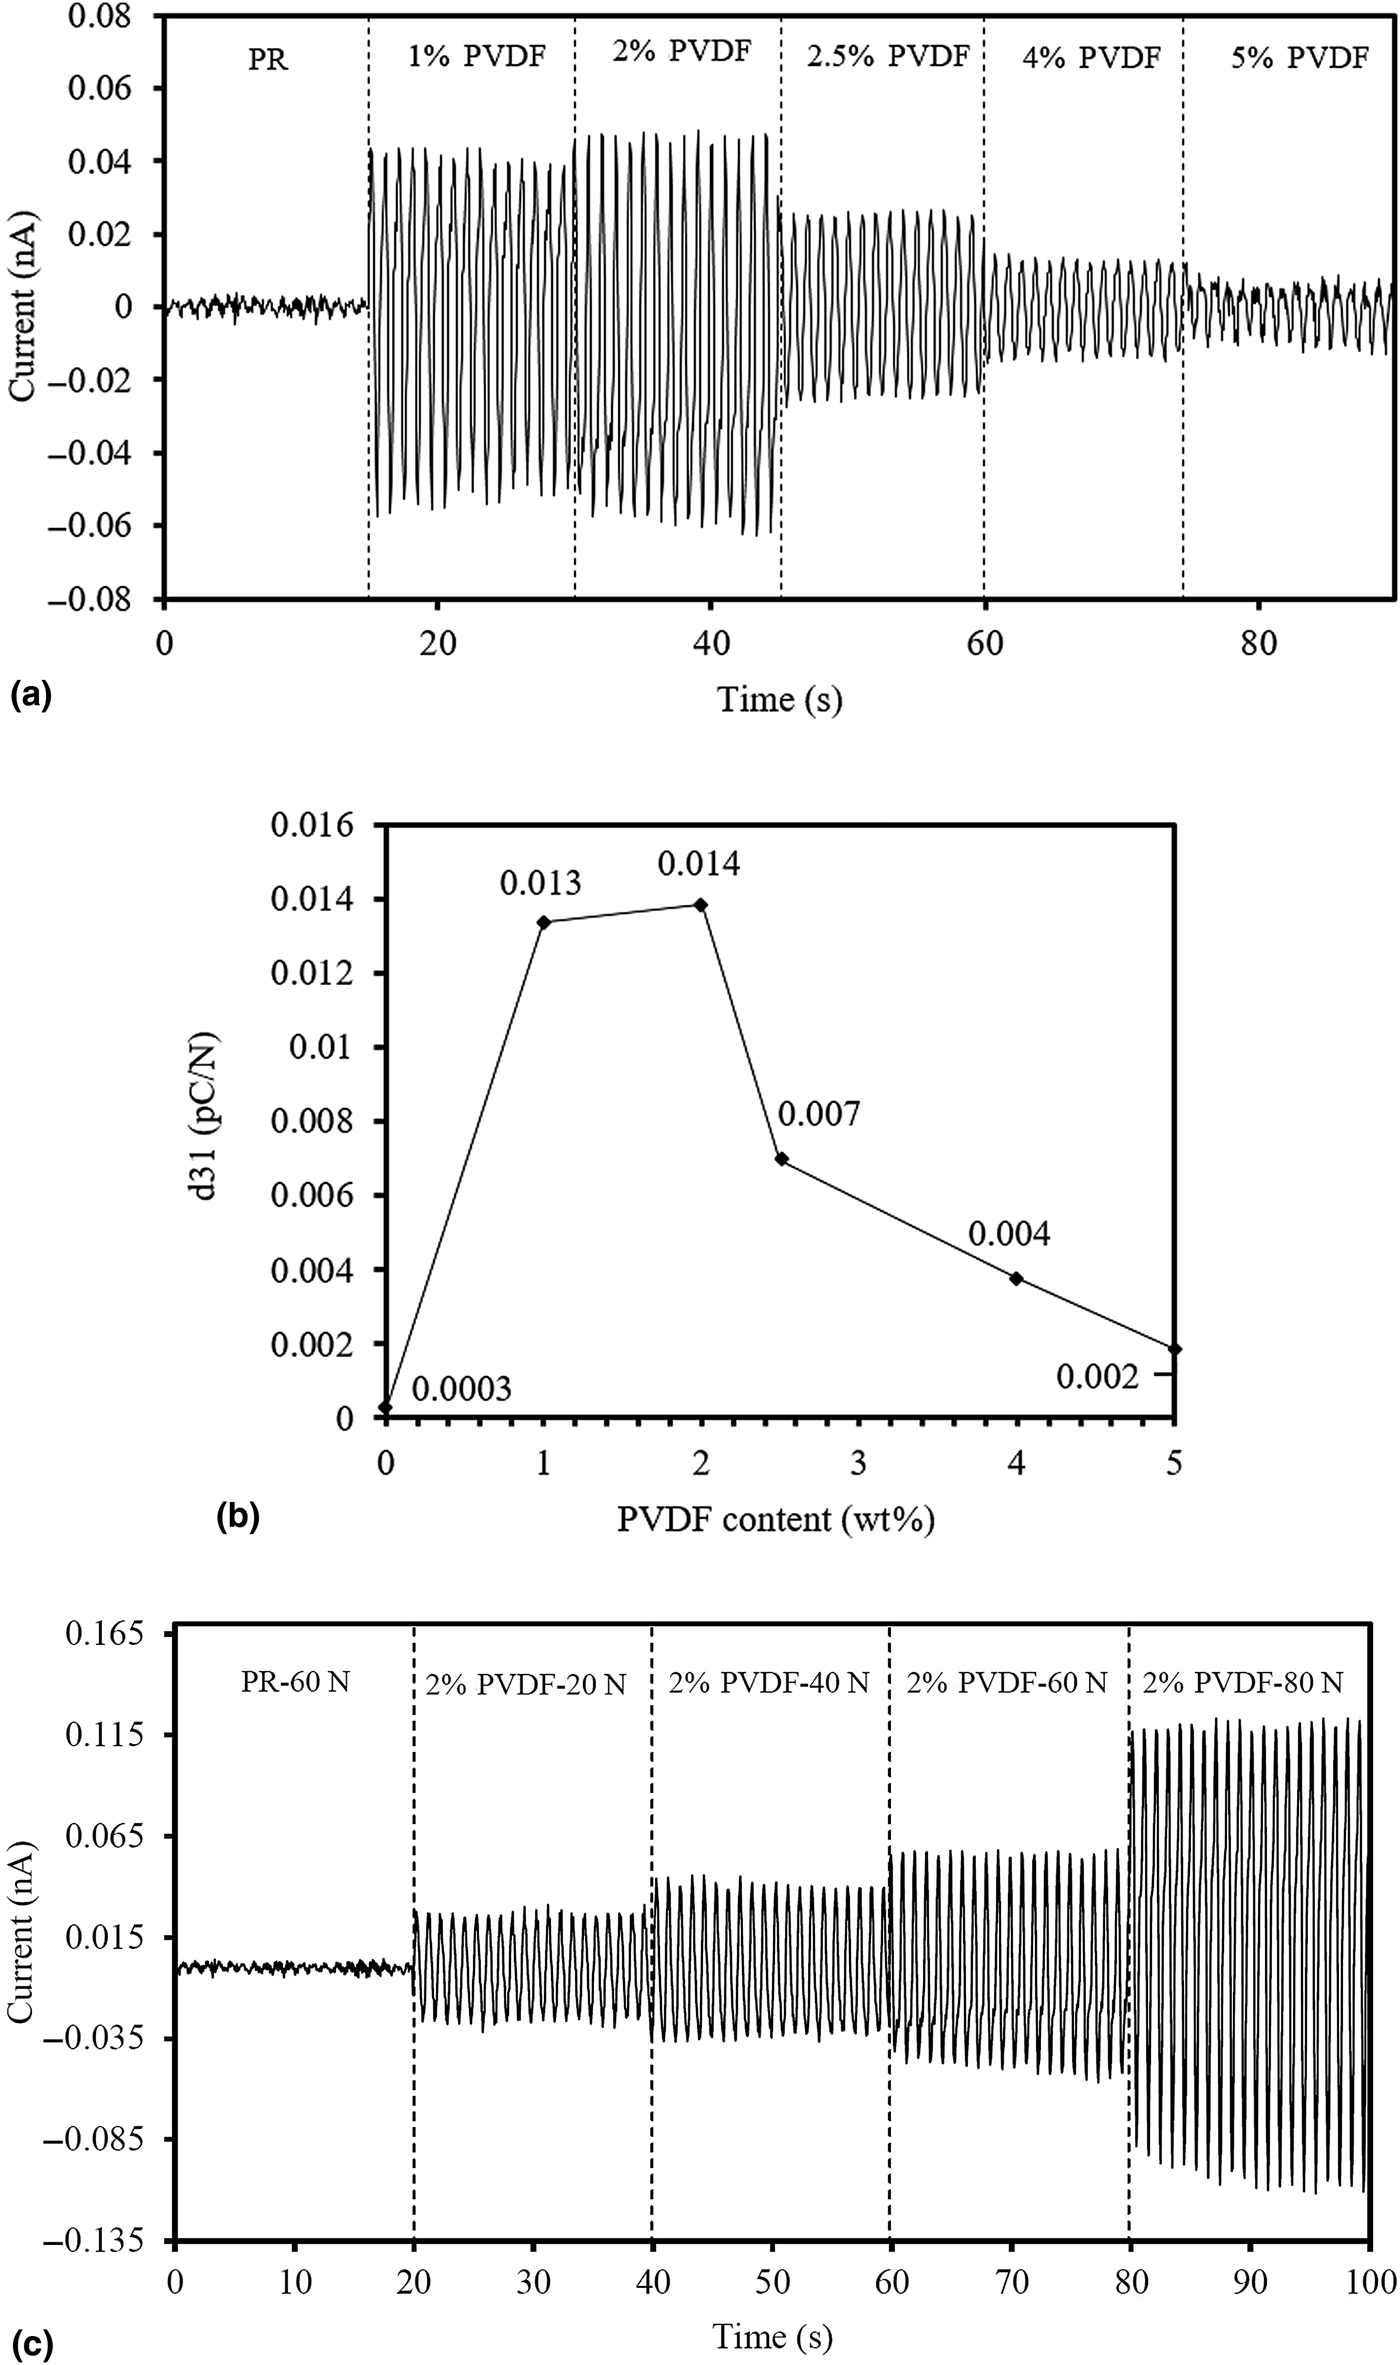
SLA 3D-printed blends samples with increasing PVDF contents in the PR and pure PR were tested in a fatigue load frame to measure piezoelectric responses and calculate piezoelectric coefficient (d 31). Figure 4 shows the results for current output and piezoelectric coefficients of pure PR, 1, 2, 2.5, 4, and 5 wt%-PVDF/PR. In Fig. 4, as increasing PVDF contents in the PR, generated current outputs drastically increase by ±0.053 nA at 2 wt%-PVDF. However, it gradually decreases beyond 2 wt%. It is assumed that the precipitation of PVDF molecular chains was significantly occurred within the PR matrix after 2 wt% content so that less mechanical stress was induced on PVDF molecular chains. Supplementary Fig. S1(c) and Fig. 3(e) provide good evidences that PVDF/PR blends become more opaque and coarser surface shown in SEM images as PVDF content increases due to precipitation. Therefore, this will lower the piezoelectric response although PVDF content increases in the PR. Based on the current output, d 31 of each sample can be calculated by the following equation[Reference Kim, Fernando, Li, Lin and Tseng10]:
 $$D_i = d_{ij}\sigma _j,$$
where D i is the electrical displacement, σ j is the applied stress, and d ij is the piezoelectric coefficient. In this case, subscripts i and j are defined as 3 and 1, respectively, as shown in Supplementary Fig. S2(a). Therefore, the equation can then be expressed as D 3 = d 31σ 1. Considering areas of electrode and cross section, Eq. (2) can then be expressed as
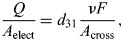 $$\displaystyle{Q \over {A_{{\rm elect}}}} = d_{31}\displaystyle{{\nu F} \over {A_{{\rm cross}}}},$$
where Q is charge, A elect and A cross are areas of electrode and cross section, respectively, ν is Poisson's ratio, and F is an applied force. Then, the piezoelectric coefficient can be expressed as
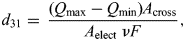 $$d_{31} = \; \displaystyle{{\lpar {Q_{{\rm max}}-Q_{{\rm min}}} \rpar A_{{\rm cross}}} \over {A_{{\rm elect}}\; \nu F}},$$
where Poisson's ratio is determined as 0.333[Reference Vinogradov and Holloway43] and Q max and Q min are maximum and minimum charges, respectively, where measured for each cycle. These charges can be attained with numerical integration expressed as
 $$Q_{\lpar i \rpar } = \; Q_{i-1}\displaystyle{{I_i\; + \; I_{i + 1}} \over 2}\; \times \lpar {t_{i + 1}-t_i} \rpar, $$
where I i is the output current at ith and t i is the time at ith. And after each 30 peak is calculated through the Eq. (3), taking the average on d 31of each 30 peaks turned to the piezoelectric coefficient as shown in Fig. 4. The result of d 31 as shown in Fig. 4 indicates that SLA 3D-printed 2 wt%-PVDF/PR has the highest d 31 with 0.014 pC/N which is 46% higher than the one from the pure PR. Additionally, d 31 shows the same trend compared with the piezoelectric current output.
Measurement of piezoelectric properties: (a) current output, (b) piezoelectric coefficients of pure PR, 1, 2, 2.5, 4, and 5 wt%-PVDF/PR under applied force of 60 N and 1 Hz, and (c) piezoelectric current output generated from 2 wt%-PVDF/PR at increasing applied forces from 20 to 80 N.
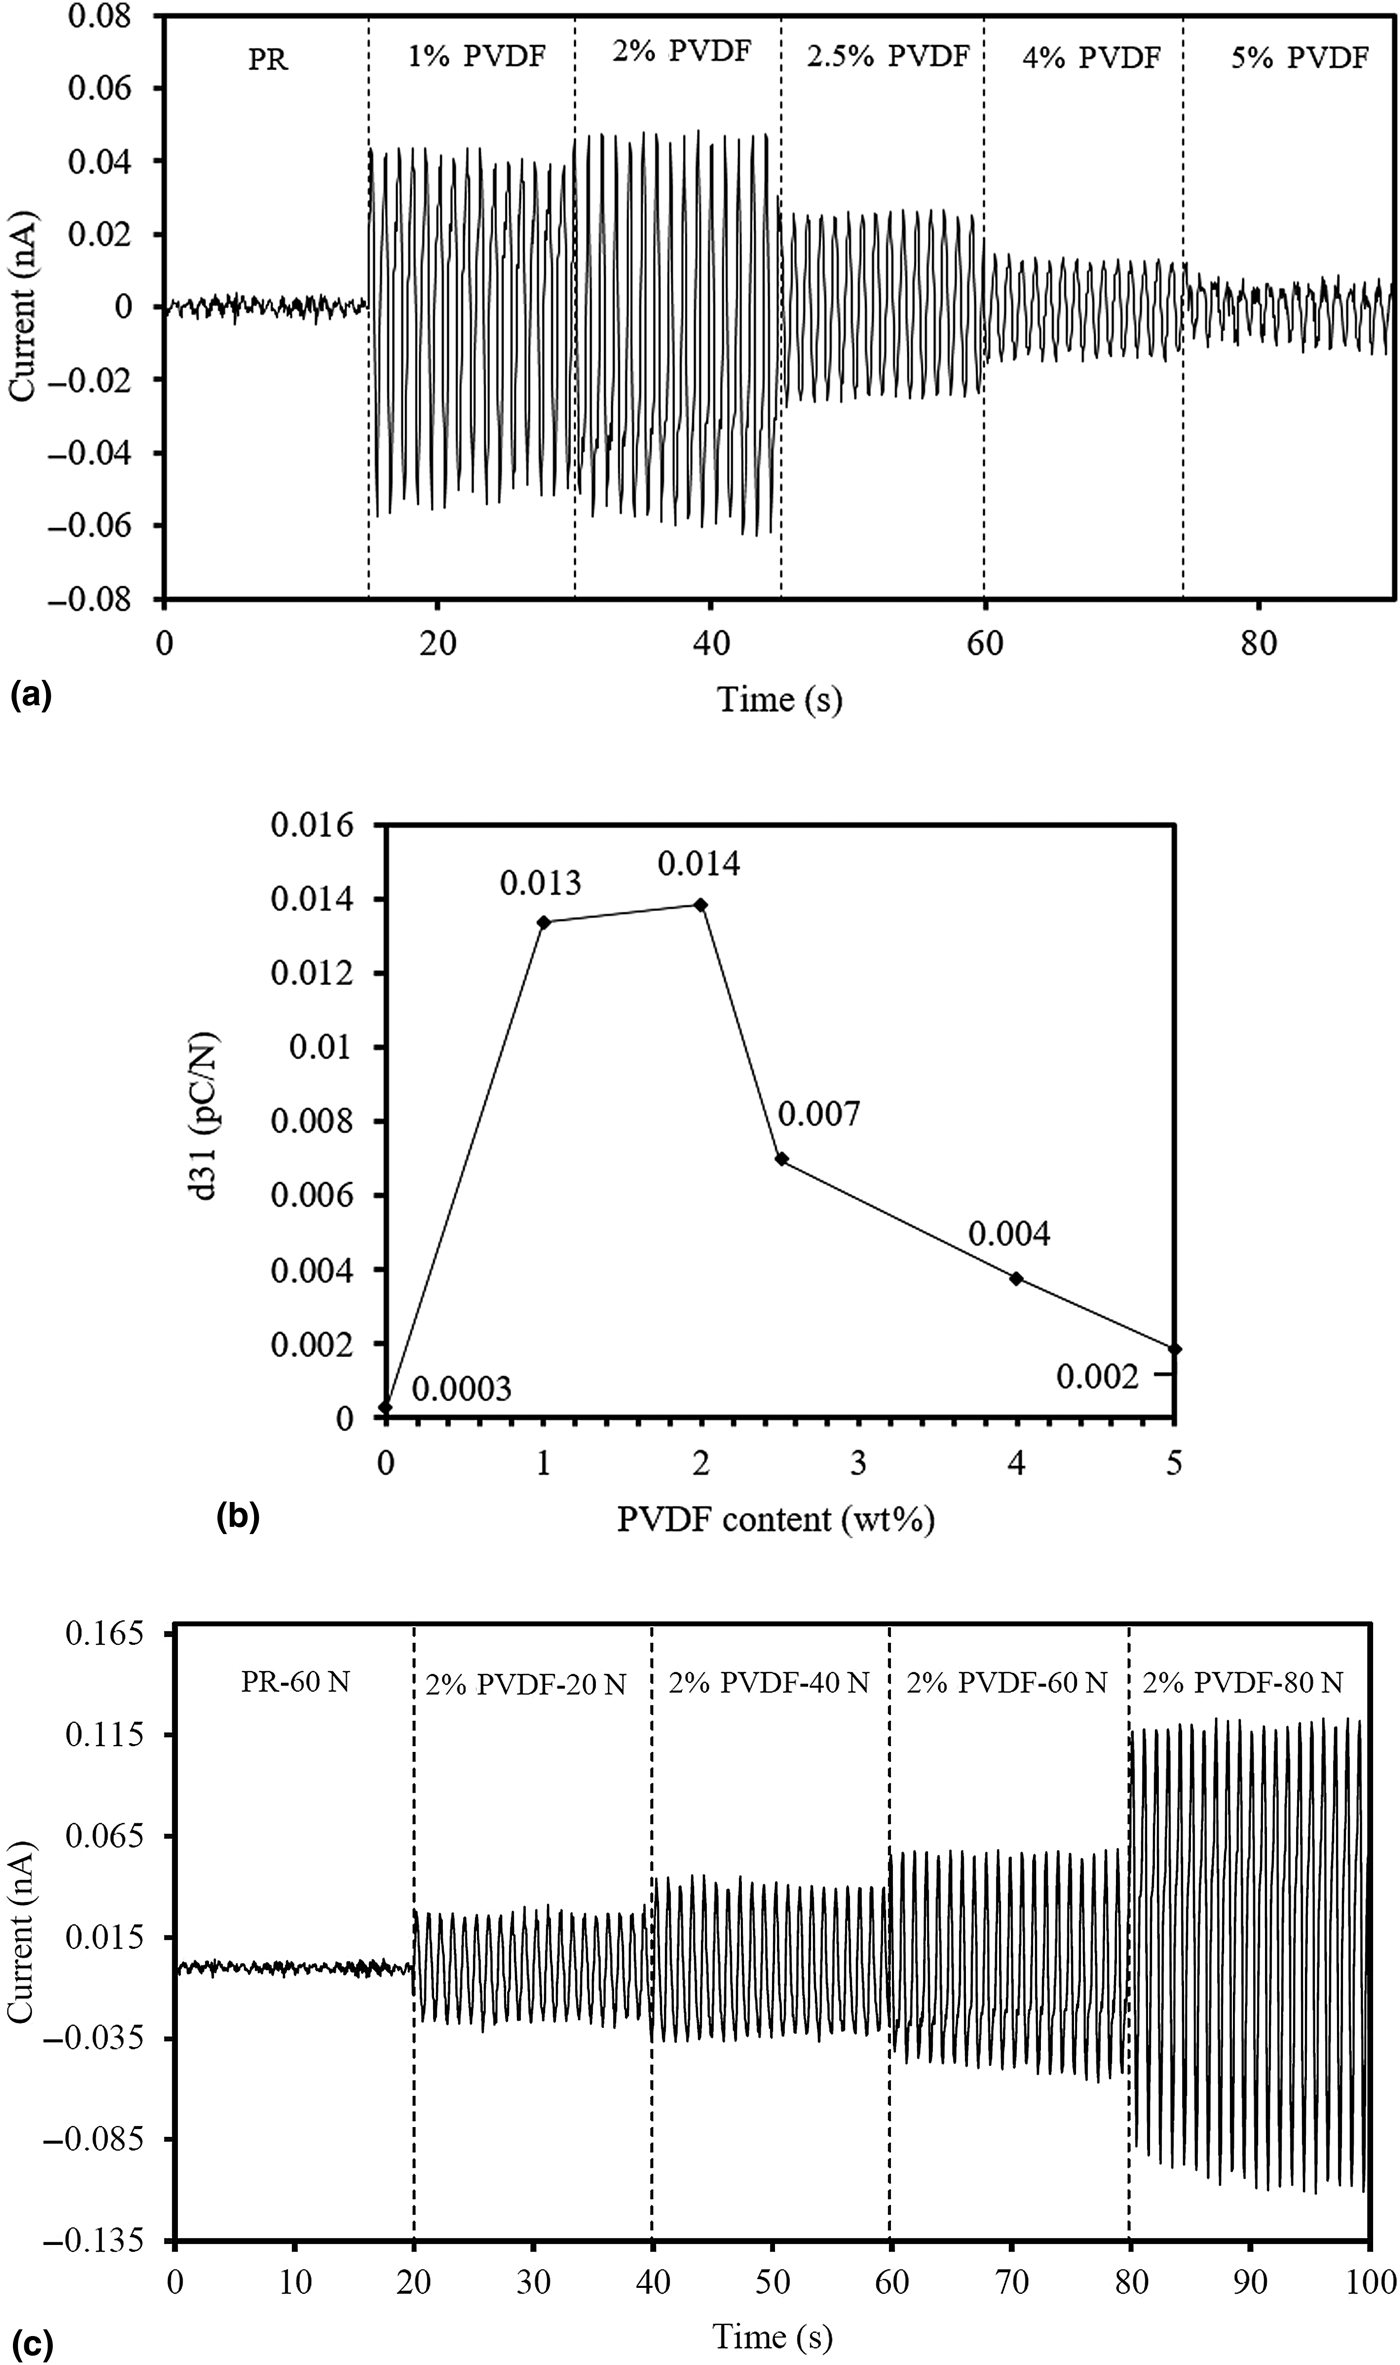
Different dynamic forces from 20 to 80 N were applied on the 2 wt%-PVDF/PR blends as shown in Fig. 4(c). As increasing the force applied on the sample, the current output gradually increases and reaches ±0.121 nA under 80 N. Additionally, the sample ruptured when 90 N was applied.
Conclusions
Piezoelectric PR-based PVDF blends were fabricated using the SLA 3D printing technique. The blends were characterized using XRD, SEM, and dynamic testing. Dynamic testing and pico-ammeter were used to measure the piezoelectric properties of the blend and its potential use in pressure sensing applications. Due to the insolubility between PVDF and the PR causing PVDF sediments and agglomerates, DMF solvent was used to disperse PVDF molecular chains uniformly into the PR. The optimal ratio between PVDF and DMF was experimentally investigated 1:10 with high performing piezoelectric properties and manufacturability. At fixed 1:10 ratio, an increasing amount of PVDF content within the PR was studied and it was found that 2 wt%-PVFD/PR blends show the highest piezoelectric properties with ±0.053 nA and 0.014 pC/N. At increased dynamic forces, it was observed that the blends generate ±0.180 nA under 80 N. These results demonstrate the feasibility in its commercial application for pressure sensors. These compounds and the SLA 3D printing technique are expected to broaden the use of additive manufacturing to print piezoelectric nanoblend devices for sensor applications. For further research, other solvents can be studied to solubilize PVDF amount in the PR in order to enhance the piezoelectricity as well as mechanical properties.
Supplementary material Data
The supplementary material for this article can be found at https://doi.org/10.1557/mrc.2019.109
Acknowledgments
This work is supported by the National Science Foundation (NSF) under NSF-PREM Grant No. DMR-1205302 and partially supported by the National Science Foundation (DUE-TUES-1246050).