


Despite the extent of workplace injuries in Australia our knowledge of their ecology is restricted to general parameters such as their causes (Driscoll, Harison, Bradley, & Newson, Reference Driscoll, Harrison, Bradley and Newson2008), their incidence (Safe Work Australia, 2012) or details of specific conditions such as back injury (Hush, Reference Hush2008) or psychological health (Wall, Morrissey, & Ogloff, Reference Wall, Morrissey and Ogloff2008). Although work-related injury and vocational rehabilitation are intricately related (e.g., Dersh, Gatchel, Polatin, & Mayer, Reference Dersh, Gatchel, Polatin and Mayer2002; Krause, Frank, Dasinger, Sullivan, & Sinclair, Reference Krause, Frank, Dasinger, Sullivan and Sinclair2001; Shrey, Reference Shrey1996), a search of the Australian Journal of Rehabilitation Counselling (2006–2013) and the International Journal of Rehabilitation Research (2006–2015) did not locate any formal studies that dealt with the ecology of injury (i.e., the relationship between people, their workplace injuries and the environment). The purpose of this report is to describe the nature and extent of work-related injuries in Australia because this is the stage backdrop against which rehabilitation players have performed their roles.
For the most part, this paper adopts the definition of the government statistician with respect to work-related injury or illness, namely: ‘any injury or illness or disease which first occurred in the last 12 months, where a person suffers either physically or mentally from a condition that has arisen out of, or in the course of, employment. The injury or illness was considered to be in scope if the respondent first became aware of it in the last 12 months, even though the cause of the injury or illness may have occurred outside the 12 month reference period. Included are injuries or illnesses that occurred while commuting to and from work, outside the place of work but while on work duty, or during work breaks’ (Australian Bureau of Statistics, 2014, p. 46). This definition is derived from the work of the International Labour Organization (1998) with respect to work-related injury, wherein an occupational injury is defined as ‘any personal injury, disease or death resulting from an occupational accident; an occupational injury is therefore distinct from an occupational disease, which is a disease contracted as a result of an exposure over a period of time to risk factors arising from work activity’ (1998, p. 2).
Workplace injury is not identified as a separate causal category in national reports on disabilities (e.g., Athanasou, Reference Athanasou2014, Reference Athanasou2015). This is despite the fact that (a) its occurrence far exceeds that of disability conditions such as cancer, diabetes, heart disease, stroke or dementia (Australian Bureau of Statistics, 2013, Table 12) and (b) that occupational factors account for much of the prevailing musculoskeletal conditions, acquired hearing loss or respiratory diseases (Schulte, Reference Schulte2005).
Certainly, workplace injury has been the subject of some studies in Australia but the effort has been fragmented. Generally research on this topic has occurred through an administrative lens with one eye on managing the level of compensation claims. An example is the statistical bulletin published by regulatory authorities such as WorkCover New South Wales (2012/2013). For example in 2012–2013 there were a total of 105,009 employment injuries in New South Wales with 33,579 injuries incurring at least one week of weekly benefit entitlement as well as 103 fatalities. Barling, Kelloway, & Iverson (Reference Barling, Kelloway and Iverson2003) used data from the 1995 Australian Workplace Industrial Relations Survey and indicated that some 17 per cent of the 9908 employees who participated in the study had reported a workplace injury.
Probably the number of workplace accidents is under-reported and fatalities may be a de facto indicator of the seriousness of the problems associated with workplace injury. In 2005, Concha-Barientos, Nelson, Fingerhut, Driscoll and Leigh (Reference Concha-Barrientos, Nelson, Fingerhut, Driscoll and Leigh2005) estimated that fatal and non-fatal occupational injuries resulted in 10.5 million disability-adjusted life years (i.e., lost years of healthy life) for an active world-wide population of about 2.9 billion workers. An early report on occupational fatalities showed that Australia had a fatality rate well above that of established market economy nations and five times that of the UK (Takala, Reference Takala1999). By 2005, the comparison of Australia with other nations had improved. At that time the accident rate for non-fatal accidents was below the overall average for all nations but still four times that of the UK. There were around 210,000 non-fatal accidents with less than or equal to three day's absence for an estimated working population of 8,617,000 in Australia (Hamalainen, Takala, & Saarela, Reference Hamalainen, Takala and Saarela2006; Table 3, p. 145).
Time lost from work has been another aspect that has been investigated. In 1998–1999, compensated injuries in Australia resulted in an average of 2 months lost work and the estimated cost at that time was around $7,000 (National Occupational Health and Safety Commission, 2000). Over the period 1995–2008, a total of 448,868 claims were reported in Victoria. Around 30 per cent were recurrent claims that accounted for some 104,556 years of time lost from work (Ruseckaite & Collie, Reference Ruseckaite and Collie2013). Kenny (Reference Kenny1995) investigated claims for workers’ compensation of 3041 workers within the Hunter-Newcastle region of New South Wales. The median time lost from work was 2.78 weeks. The contribution of: (a) the nature of injury; (b) worker variables; and (c) organisational variables on the amount of time lost was evaluated. Kenny reported that the nature of the injury accounted for 28% of the variance in the amount of time lost. Worker characteristics accounted for 34% of the variance in time lost.
The study by Kenny deconstructed work injury into components. It focused on the workplace but also considered pre- and post-injury factors. Factors that were related potentially to the frequency of workplace injuries and return to work outcomes included: gender, age, family responsibilities, education, income, ethnicity, stress levels, substance use, psychosocial impact of injury, type of work, industry, low skill level of the occupation, length of work, shift work, workplace factors and employer responsiveness and compensation system variables.
Aims of the Study
Accordingly, this study uses the official statistics to explore issues related to the precursors of injury, the context of injury and its consequences. It is based on a secondary analysis of the published and unpublished data from the Australian Bureau of Statistics (2014). It addresses the following questions: (a) what is the incidence of workplace injury in Australia; (b) is the incidence related to socio-demographic variables (age, sex, education); (c) what workplace factors (e.g., occupation, industry) are related to injury; (d) what outcomes are associated with workplace injury; and (e) are there employment implications for those with a workplace injury?
Method
Participants
The results for this report were derived from the 7th national survey of Work-Related Injuries by the Australian Bureau of Statistics, (2014). This is a stratified, random, multiple household survey conducted as a supplement to the monthly labour force survey of 42,100 private dwellings. It includes urban and rural areas but excluded indigenous community collection districts located in very remote regions of Australia. The final sample comprised 27,300 persons.
Procedures
A multi-stage sampling approach was used (state and territory then geographical strata then statistical local areas then population census collection districts then dwellings). Trained interviewers screened households for a person with a work-related injury aged 15 years and over, using a computer-assisted personal interview procedure. Interviewers were through programmed algorithms. Basic social and demographic data were collected. Questions were wide-ranging and related to the personal and social aspects of work-related injury, the restrictions in daily living, the assistance required as well as employment restrictions. A list of the data items and their categories is available freely from the author upon request. Participation in such household surveys is mandated in accordance with the Census and Statistics Act, 1905. Participants are advised of the confidentiality and privacy of the data collection. Published data is released with randomly adjusted cell values through a process called ‘perturbation’ and this is done in order to ensure that individuals are not capable of being identified.
Analysis
As this was census data only a secondary analysis utilising descriptive statistics (histograms, cross-tabulations) are reported but tests for the statistical significance of the difference in proportions were computed (Ferguson, Reference Ferguson1976, pp. 173–175). Further details are provided in the results section.
Results and Discussion
Incidence and Prevalence of Workplace Injury in Australia
In 2013–2014 work-related injury and illness was reported by 531,800 persons. The proportion of those who have suffered a workplace injury or illness in the last 12 months has decreased consistently over time. For males and females combined it has fallen from 6.3% in 2005–2006 to 4.2% in 2013–2014.
Demographic Background of Work-Related Injury
The rate of work-related injuries per thousand people is related to age and sex. It is far lower for females (35.6 per thousand persons) than for males (48.9 per thousand persons). The differences in the proportions are statistically significant (z = −3.63, p < 0.0003). Moreover, there are age differences and these operate differently within each sex. The pattern is illustrated in Figure 1. For males it is high in the younger groups and remains relatively constant until age 54 then declines. The pattern for females is affected by their age-related participation rate in the labour force. The rate of work-related injuries and illnesses declines for the age group 25–34 then increases to age 64 and subsequently declines markedly after age 64.
Age and sex difference in work-related injuries and illnesses per thousand employees.

Educational achievement is also related to workplace injury. In one sense, education is a proxy for the type of work with higher level qualifications required typically for the ‘safer’ forms of work. People with a bachelor's degree had a 0.238 probability of injury compared with 0.436 for those with no post-school qualification. The highest probability (0.679) of a workplace injury was for those in labouring type jobs (Certificate I/II) and this was followed closely by 0.611 for those at around a trade level (Certificate III/IV). By any measure these are very high rates of injury compared to the remainder of the workforce.
Workplace Factors Related to Injury
There are a number of work-related factors that impinge upon illness and injury. These include the fact that most injuries occur to employees (93%), to full-time employees (77.3%) but especially to the 48.4% of all those who worked more than 35–39 hours per week. Shift-work arrangements made up 29.6% of all work injuries and illnesses. Length of employment was a factor and 70.4% had worked more than two years but at the same time those who had worked less than 6 months made up around one-sixth of injuries. The picture is complex and it appears that full-time workers who exceed the 35–39 hours are a high risk group, especially if they have been doing this for a number of years. The logic behind this is simple if one takes into account the probability of an accident per hour multiplied by the increased number of working hours and multiplied again by the extended number of years.
Occupation and Industry
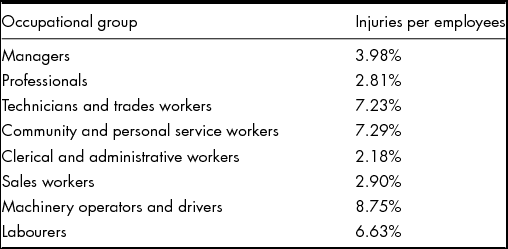
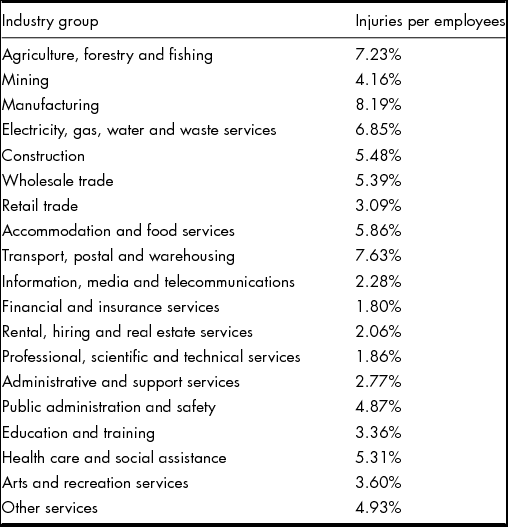
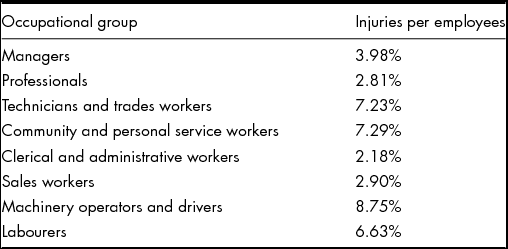
Occupation and industry are also related to the extent of work injuries and illnesses (Tables 1 and 2). While the raw figures are of interest they can also be misleading as they disguise the probability of injury. For example 73,900 professional reported a work-related injury or illnesses in the last 12 months compared with 68,500 labourers. This overlooks the fact that there are far more professionals (2,627,700) compared with labourers (1,032,700) in the Australian labour force. The proportion of injuries per employee for professionals is 2.81% compared with 6.63% for labourers. Machinery operators and drivers have the highest rate of injury and as most likely expected, clerical workers have the lowest rate of injury. The results are summarised for both occupation and industry in Tables 1 and 2. Three industries dominate workplace injuries and these are manufacturing (8.19%), transport (7.63%) and agriculture, forestry mining with 7.23%.
Injury Rate Per Employee – Occupational Level (N = 11,435,200)
Injury Rate Per Employee – Industry Level (N = 11,435,200)
Outcomes Associated with Work-Related Injury or Illness
Work-related injuries in Australia are dominated overwhelmingly by chronic joint or muscle conditions and sprain/strain injuries. They account for more than half of all injuries (see Figure 2). In the same way that work-related injuries are dominated by two conditions, the same level of domination also occurs in relation to their origin or causes (see Figure 3). Lifting, pushing, pulling or bending accounted for 34% of all injuries. This was followed by 20.0% for being hit or cut by an object or vehicle. Falls on the same level (i.e., slips or falls) accounted for one-eighth of injuries.
Type of work-related injury or illness.
Origins of work-related injury or illness.
Employment Implications Following Injury
This section examines three aspects, namely, health status following injury, the length of absence and the extent of return to work following an accident or injury.
There are lingering effects of injuries that affect a sizable proportion of people. More than four-fifths of the group who had suffered a workplace injury in the last 12 months rated their health as excellent, very good or good but a significant proportion (13.3%) rated their health as fair or poor.
The number of days absent from work is related to the extent of the injury. Many injuries do not result in substantial absence while others are more likely to entail 5 days or more of absence. In Figure 4 the modal absence for each type of injury is classified into none, mild (1–4 days absence) and moderate-severe (5 days or more). Falls were more likely than not to bring about moderate-severe lengths of absence. Exposure to mental stress was also related to prolonged absence. Vehicle accidents were linked with mild to moderate levels of absence. Injuries that were not related to prolonged absence were: prolonged standing, working in cramped or unchanging positions; contact with chemicals, repetitive movement with low muscle loading; lifting, pushing, pulling or bending; and hitting or being hit by an object or vehicle.
Days or shifts absent from work in the last 12 months due to type of most recent work-related injury or illness sustained.
Only a small proportion of employees failed to return to work following an injury. This is around 2% but amounts to 11,100 persons out of the 531,800 who suffered an injury or illness. For most injuries there is no loss of work (38.6%) but a substantial proportion (17.9%) involve a loss of 11 days or more from work. The raw figures are summarised in Figure 5. A broader indicator of return to work is to consider the proportion that had suffered a workplace injury in the last 12 months and were employed in the week of the survey. This was 92% (percentage rounded). It indicates that return to work is overwhelmingly possible but that a substantial proportion – some 8 per cent – did not return to work. Of course, this is affected by the 12 month survey-timeframe but some 3% were unemployed and just over 5% were not in the labour force. The combined figure of 8 per cent is higher than the 2.1% who had not returned to work since the injury occurred. This a better estimate because it includes those who returned to work then resigned or those whose position was terminated as a result of injury. The major source of financial assistance to those injured at work was some form of workers compensation (34.5%) or sick leave (19.8%). Just under two fifths did not receive any financial assistance (38.7%).
Absence from work following an injury.
Discussion
The findings from this Australian survey indicated the work-related injury and illness has affected around half a million Australians who worked in the last 12 months. Occupational injury is heterogeneous in nature and its presence in public health is masked because it is subsumed by a variety of medical conditions. Nevertheless, it is amongst the largest of all the causes of disability. The dimensions of the topic of workplace injury were always known to be large but they are deeper than appear at first glance, especially since around 500,000 cases from minor through very severe to fatalities are added year-in and year-out in Australia. It is an area that is ripe for further research.
To summarise, work-related injury affected 4.3 per cent of those who had worked at some time in the last 12 months (around 531,800 Australians). It was far lower for females (35.6 per thousand persons) than for males (48.9 per thousand persons). The highest probability (0.679) of a workplace injury was for those in labouring type jobs. Full-time workers who exceeded 35–39 hours per week were are a high risk group. Injuries are dominated by chronic joint or muscle conditions and sprain/strain injuries. They accounted for more than half of all injuries. The two main causes were: (a) lifting, pushing, pulling or bending and (b) being struck by an object or vehicle. Mental stress was also related to prolonged absence from work. For most injuries there is no loss of work but for some 18% there was a loss of 11 days or more from work. There has been a reduction in work-related injuries from 2005 to 2014 but this is likely to be an underestimate as it excludes (a) fatalities and (b) those persons who had longstanding injuries or illnesses and who had not worked in the last 12 months. The major limitations of this study relate to the validity of self-reporting and the potential sampling error even from such a national household survey.
There are a number of implications for rehabilitation practice from these findings. First, there is clearly a restriction in the range of clientele encountered in rehabilitation. The incidence of work-related injury was not distributed randomly throughout the population. It is a statistically biased cohort weighted heavily in terms of one's age, sex and education. In summary, the modal client is likely to be male, aged 15–45 years and engaged in labouring work. The overall influence of these factors means that vocational rehabilitation deals with a socio-economically constrained caseload.
A second implication for professional rehabilitation arises from the type of injury. Work-related injuries in Australia are dominated overwhelmingly by chronic joint or muscle conditions and sprain/strain injuries. This poses a test to any approach to professional rehabilitation education and training or personal injury management that overlooks the dominance of these conditions. Certainly major texts (Falvo, Reference Falvo2014; Flanagan, Zaretsky, & Moroz, Reference Flanagan, Zaretsky and Moroz2011; Frank, Rosenthall, & Caplan, Reference Frank, Rosenthall and Caplan2010) mention musculoskeletal conditions, however, they are covered only minimally and completely out of proportion to their dominance in disability and rehabilitation. As one example, musculoskeletal disorders account for only 16 out of the 745 pages in the 4th edition of Medical Aspects of Disability. A Handbook for the Rehabilitation Professional (Flanagan, Zaretsky, & Moroz, Reference Flanagan, Zaretsky and Moroz2011).
The third implications from the descriptive analysis of the official data relates to the outliers in the health effects of work-related injury and illness in terms of absence and return to work. If more than 10 days absence is taken as a criterion for a severe injury then around one-fifth of all those who were injured fell into this category. By any standard this means that there are large numbers of people who will be requiring some vocational rehabilitation services. While the results of this national survey indicated that return to work is overwhelmingly possible, a substantial proportion – some 8 per cent – did not return to work (i.e., unemployed or not in the labour force). Of course, this is affected by the injury-return to work and survey-timeframes but it presents a chronic, persistent and real-life challenge for those engaged in vocational rehabilitation on a daily basis.
From a theoretical perspective, the results were broadly consistent with the model first hypothesized by Kenny (Reference Kenny1995). A generalised and holistic framework or time sequence for the analysis of work-related injury and disability is proposed. The factors may be visualised in chronological sequence but it is recognised that the model is recursive. Return to work is mediated by age, gender, education, occupation, industry, the type of injury and its health effects. While generalisations can be made for the purposes of policy, it is likely that for each person the potential for prolonged restriction employment is a probabilistic function of multiple interacting factors. In summary, the findings of this study are consistent with analyses of individual components of work-related injury such as the nature of the injury, worker characteristics and industry/occupational factors (e.g., Ruseckaite & Collie, Reference Ruseckaite and Collie2013; Schulte, Reference Schulte2005). Each factor individually and in concert was relevant to work-related injury.
Acknowledgement
The helpful comments of the two anonymous reviewers are gratefully acknowledged.
Funding
This research received no specific grant from any funding agency in the public, commercial or not-for-profit sectors.
Declaration of Conflicting Interests
None.