In recent years, several definitions and theoretical models of executive functions (EFs) have been formulated (see e.g., Barkley, Reference Barkley1997; Fuster, Reference Fuster1997; Lezak, Reference Lezak1995; Stuss & Benson, Reference Stuss and Benson1986). The term ‘executive functions’ refers to a series of cognitive processes that are necessary for goal-directed behavior (Luria, Reference Luria1966; Stuss & Benson, Reference Stuss and Benson1986). For this reason, EF is considered to be a construct that encompass cognitive subprocesses, such as (a) set shifting, (b) working memory, (c) inhibition, (d) planning, and (e) fluency (Pennington & Ozonoff, Reference Pennington and Ozonoff1996). From a neurofunctional point of view, EFs are thought to rely on the prefrontal cortex (PFC) and its reciprocal connections with related cortical areas and subcortical brain structures (Fuster, Reference Fuster1997).
A controversial issue in EF studies is whether these functions represent a unitary system or a construct integrated by multiple, related but separate components (i.e., the unity-but-diversity view). A line of evidence in favor of the unitary view of EFs comes from studies that supports the existence of a common subjacent mechanism that could explain the variations in frontal lobe functioning and account for its dysfunctions (see e.g., Duncan, Emslie, Williams, Johnson, & Freer, Reference Duncan, Emslie, Williams, Johnson and Freer1996). Also in line with the unitary nature, previous studies have found that the structure of EFs can be explained by a single factor in preschool children (Wiebe, Espy, & Charak, Reference Wiebe, Espy and Charak2008; Wiebe et al., Reference Wiebe, Sheffield, Nelson, Clark, Chevalier and Espy2011), healthy adults (de Frias, Dixon, & Strauss, Reference de Frias, Dixon and Strauss2006), and frontal lobe patients (Della Sala, Gray, Spinnler, & Trivelli, Reference Della Sala, Gray, Spinnler and Trivelli1998).
Conversely, other authors support a multidimensional view of EFs. For example, Stuss and Alexander (Reference Stuss and Alexander2000) claim for a multidimensional hypothesis since they consider the EFs as different cognitive processes which are related with distinct cerebral regions within the frontal lobe. In this sense, the authors state that EF is not a unitary construct- there is not a frontal homunculus. Recently, behavioral and neuroimaging studies have demonstrated that EFs in healthy children and adults have both a unitary and diverse nature, meaning that both aspects should be considered when studying EFs (Collette et al., Reference Collette, van der Linden, Laureys, Delfiore, Degueldre, Luxen and Salmon2005; Lehto, Juujärvi, Kooistra, & Pulkkinen, Reference Lehto, Juujärvi, Kooistra and Pulkkinen2003; Miyake et al., Reference Miyake, Friedman, Emerson, Witzki, Howerter and Wager2000). According to this view, the nature of EFs is diverse because their structure is explained by separate factors, but simultaneously unitary, because these factors are not completely independent meaning the existence of one or several common subjacent mechanisms.
The evidence that support a multi-dimensional construct comes from various lines of study: (a) based on the use of exploratory factor analysis (EFA) and confirmatory factor analysis (CFA) techniques, various studies have identified a structure integrated by separated but related components (Lehto et al., Reference Lehto, Juujärvi, Kooistra and Pulkkinen2003; Miyake et al., Reference Miyake, Friedman, Emerson, Witzki, Howerter and Wager2000); (b) neuroimaging studies have shown that the EFs of updating, shifting, and inhibition may activate shared brain areas, as well as specific frontal and subcortical regions (Collette et al., Reference Collette, van der Linden, Laureys, Delfiore, Degueldre, Luxen and Salmon2005); (c) clinical observations indicate the presence of a dissociation in the performance of different executive tasks (Godefroy, Cabaret, Petit-Chenal, Pruvo, & Rousseaux, Reference Godefroy, Cabaret, Petit-Chenal, Pruvo and Rousseaux1999), meaning that a deficit might be demonstrated in the performance of one EF task but not another; and (d) previous research has analyzed the development of these functions from childhood to adolescence and demonstrated that EF components follow different developmental trajectories (Brocki & Bohlin, Reference Brocki and Bohlin2004; Huizinga, Dolan, & van der Molen, Reference Huizinga, Dolan and van der Molen2006; Klenberg, Korkman, & Lahti-Nuuttila, Reference Klenberg, Korkman and Lahti-Nuuttila2001; Levin et al., Reference Levin, Culhane, Hartmann, Evankovich, Mattson, Harward and Fletcher1991; Welsh, Pennington, & Groisser, Reference Welsh, Pennington and Groisser1991).
Thus, while there is a clear tendency toward the hypothesis suggesting a multi-dimensional structure of EFs, there is disagreement regarding the number of factors or latent components within the construct. Overall, the evidence obtained from previous studies, which were based on factor-analysis techniques, indicates a structure integrated by three executive components in both healthy children and adults. Several key findings from these studies include the following: (a) Welsh et al. (Reference Welsh, Pennington and Groisser1991), who studied children aged 3–12, found three factors. Factor I was interpreted as the Speeded responding dimension, factor II was hypothesized to reflect support for Set maintenance, and factor III was interpreted as a Planning dimension. (b) Levin et al. (Reference Levin, Culhane, Hartmann, Evankovich, Mattson, Harward and Fletcher1991) performed principal component analysis (PCA) and found a similar structure composed of three factors in children aged 7–15. (c) Miyake et al. (Reference Miyake, Friedman, Emerson, Witzki, Howerter and Wager2000) used CFA and structural equation modeling (SEM) to identify the latent components of the construct among 137 young adults; these researchers found three moderately correlated but separate factors, which were defined as: Shifting, Updating, and Inhibition. (d) Lehto et al. (Reference Lehto, Juujärvi, Kooistra and Pulkkinen2003) employed both EFA and CFA on children aged 8–13 and found a three-factor solution that was interpreted following the model proposed by Miyake et al. (Reference Miyake, Friedman, Emerson, Witzki, Howerter and Wager2000) as: Working memory, Inhibition, and Shifting. (e) Brocki and Bohlin (Reference Brocki and Bohlin2004) conducted a study among children aged 6–13 and obtained a factor solution consisting of Disinhibition, Speed/arousal, and Working memory/Fluency. However, though there is substantial evidence that provide support for a three-factor structure, there is also some evidence supporting a two-factor structure (see, e.g., Senn, Espy, & Kaufmann (Reference Senn, Espy and Kaufmann2004) study in preschool-aged children; Huizinga et al. (Reference Huizinga, Dolan and van der Molen2006) study conducted in children and adolescents aged 7–21; St Clair-Thompson & Gathercole (Reference St Clair-Thompson and Gathercole2006) study conducted with children aged 11 and 12; and van der Sluis, de Jong, & van de Leij (Reference van der Sluis, de Jong and van der Leij2007) study in children aged 9–12), and a four-factor structure in both children (e.g., Klenberg et al., Reference Klenberg, Korkman and Lahti-Nuuttila2001; Pineda et al., Reference Pineda, Ardila, Rosselli, Cadavid, Mancheno and Mejia1998) and adults (e.g., Fisk & Sharp, Reference Fisk and Sharp2004; Pineda, Merchán, Rosselli, & Ardila, Reference Pineda, Merchán, Rosselli and Ardila2000; Rodríguez-Aranda & Sundet, Reference Rodríguez-Aranda and Sundet2006).
Factor analysis techniques have also proved useful for analyzing the latent cognitive activity to various child disorders that occur with EF alterations and for testing measurement invariance across different demographic characteristics (e.g., according to sex, age, and SES).
Regarding the EF components in different child populations, previous studies have analyzed the factor structure of EFs in children with Attention Deficit Hyperactivity Disorder (ADHD) (López-Campo, Gómez-Betancur, Aguirre-Acevedo, Puerta, & Pineda, Reference López Campo, Gómez-Betancur, Aguirre-Acevedo, Puerta and Pineda2005; Pineda et al., Reference Pineda, Ardila, Rosselli, Cadavid, Mancheno and Mejia1998) and among head-injured children (Brookshire, Levin, Song, & Zhang, Reference Brookshire, Levin, Song and Zhang2004; Levin et al., Reference Levin, Fletcher, Kufera, Harward, Lilly, Mendelsohn and Eisenberg1996). As for the factor structure of EFs in children with ADHD the results are not definitive. For instance, Pineda et al. (Reference Pineda, Ardila, Rosselli, Cadavid, Mancheno and Mejia1998) analyzed this factor structure in children with and without ADHD; they found a structure comprised of four factors in the group without ADHD, whereas the group with ADHD exhibited a structure composed of three factors. According to the authors, this data actually support the hypothesis of executive dysfunction in children with ADHD. Nevertheless, in a later study, Lopez-Campo et al. (Reference López Campo, Gómez-Betancur, Aguirre-Acevedo, Puerta and Pineda2005) noted that EF components in children with ADHD and controls are similar (i.e., three factors), so they concluded that the differences between both groups would be mainly quantitative. In turn, some studies that examined the EF factor structure in children with cerebral injuries ascertained a structure constituted by four and five factors. For example, Levin et al. (Reference Levin, Fletcher, Kufera, Harward, Lilly, Mendelsohn and Eisenberg1996) found a structure comprising five factors in a group of head-injured and control children. However, in a subsequent study Brookshire et al. (Reference Brookshire, Levin, Song and Zhang2004) came across two different structures depending on time of postinjury, namely a five-factor structure in a group of typically developing and traumatic brain injury children at 36 months postinjury, but a structure of four factors in a group of head-injured children evaluated 3 months postinjury. Though both studies differ as for the number of factors met, the former are consistent with the idea that the severity of the injury (mild-moderate vs. severe) has a substantial effect on most factors.
Regarding measurement invariance of EF structure, there is evidence supporting an invariant structure across sex, age, and SES. For instance, de Frias et al. (Reference de Frias, Dixon and Strauss2006) found a unitary structure among healthy adults that was invariant (configural and metric) across sex and age. Wiebe et al. (Reference Wiebe, Espy and Charak2008) consistently found a single-factor structure in preschool-aged children that was invariant across sex and SES. In a subsequent study, the authors found that the unitary structure was invariant (metric, scalar and residual) across sex, although they only observed its metric and scalar invariance via SES (Wiebe et al., Reference Wiebe, Sheffield, Nelson, Clark, Chevalier and Espy2011).
Testing EF measurement invariance across SES is interesting because of the abundant scientific literature that has documented a relationship between SES and EFs. For example, previous studies have demonstrated that low socioeconomic status (LSS) children obtain lower scores than medium socioeconomic status (MSS) children do in several tasks assessing EFs (Arán Filippetti & Richaud de Minzi, Reference Arán Filippetti and Richaud de Minzi2011; Farah et al., Reference Farah, Shera, Savage, Betancourt, Giannetta, Brodsky and Hurt2006; Noble, McCandliss, & Farah, Reference Noble, McCandliss and Farah2007; Noble, Norman, & Farah, Reference Noble, Norman and Farah2005). For this reason, the present study intends to first analyze whether EFs in the MSS group have a diverse or unitary nature and, based on these results, to analyze whether this structure is the same in a sample of LSS children.
Moreover, analyzing the latent structure of EFs in different samples is important because the differences among studies regarding the dimensional nature of the EF construct (i.e., unitary vs. diverse) may partially result from sample characteristics. For instance, although a multidimensional structure has been demonstrated among child (Brocki & Bohlin, Reference Brocki and Bohlin2004; Huizinga et al., Reference Huizinga, Dolan and van der Molen2006; Klenberg et al., Reference Klenberg, Korkman and Lahti-Nuuttila2001; Lehto et al., Reference Lehto, Juujärvi, Kooistra and Pulkkinen2003; Levin et al., Reference Levin, Culhane, Hartmann, Evankovich, Mattson, Harward and Fletcher1991; Welsh et al., Reference Welsh, Pennington and Groisser1991) and adult populations (Fisk & Sharp, Reference Fisk and Sharp2004; Miyake et al., Reference Miyake, Friedman, Emerson, Witzki, Howerter and Wager2000; Pineda et al., Reference Pineda, Merchán, Rosselli and Ardila2000; Rodríguez-Aranda & Sundet, Reference Rodríguez-Aranda and Sundet2006), recent findings suggest that EFs may be better explained by a single factor in preschool-aged children (Fuhs & Day, Reference Fuhs and Day2011; Wiebe et al., Reference Wiebe, Sheffield, Nelson, Clark, Chevalier and Espy2011) (see however, Espy, Kaufmann, McDiarmid, & Glisky, Reference Espy, Kaufmann, McDiarmid and Glisky1999; and Senn et al., Reference Senn, Espy and Kaufmann2004, who found evidence supporting a diverse structure among preschool children). In turn, although previous studies have analyzed the dimensional nature of the EF construct among English-speaking children (Levin et al., Reference Levin, Culhane, Hartmann, Evankovich, Mattson, Harward and Fletcher1991; Welsh et al., Reference Welsh, Pennington and Groisser1991), Finnish-speaking children (Klenberg et al., Reference Klenberg, Korkman and Lahti-Nuuttila2001; Lehto et al., Reference Lehto, Juujärvi, Kooistra and Pulkkinen2003), and Swedish-speaking children (Brocki & Bohlin, Reference Brocki and Bohlin2004), among others, few studies have analyzed the latent structure and measurement invariance of EF tasks across SES in Spanish-speaking children. Studying the dimensional nature of EFs among Spanish-speaking children enables a better understanding of the cultural and linguistic influences on executive functioning. Besides, the identification of components within the construct is not only important from a theoretical point of view for diagnosis and intervention purposes, but it also generates relevant data for evaluating these functions because one of the difficulties in the field has been identifying specific tasks to measure each EF component.
The present study
The aims of the present study were as follows: (a) to analyze and define the latent structure of various tasks assessing EFs in Spanish-speaking children, (b) to test EF measurement invariance across child SES, and (c) to compare the performance of each EF factor according to SES and child age. To address these objectives, both CFA and multi-group CFA (MGCFA) were performed. Given the previous theoretical and empirical evidence, we postulated the following hypotheses:
Hypothesis 1. The structure of the EFs in Spanish-speaking children is integrated by separate but related executive components. Because there is evidence supporting unitary (Fuhs & Day, Reference Fuhs and Day2011; Wiebe et al., Reference Wiebe, Espy and Charak2008; Wiebe et al., Reference Wiebe, Sheffield, Nelson, Clark, Chevalier and Espy2011), bidimensional structure (Huizinga et al., Reference Huizinga, Dolan and van der Molen2006; St Clair-Thompson & Gathercole, Reference St Clair-Thompson and Gathercole2006; van der Sluis et al., Reference van der Sluis, de Jong and van der Leij2007) and a three-factor structure (Lehto et al., Reference Lehto, Juujärvi, Kooistra and Pulkkinen2003) in child populations, several theoretical models will be tested to analyze whether the structure is unitary or diverse. In the event that it is diverse, we will analyze the number of components within the construct.
Hypothesis 2. Few studies have analyzed measurement invariance of EFs across child SES. As mentioned before, Wiebe et al. (Reference Wiebe, Espy and Charak2008) found a single-factor structure in preschool-aged children that was invariant across sex and SES. However, in a subsequent study they only observed its metric and scalar invariance via SES (Wiebe et al., Reference Wiebe, Sheffield, Nelson, Clark, Chevalier and Espy2011). Thus, the evidence is not completely conclusive and is restricted to preschool-aged children. To our knowledge, there are no studies that have tested measurement invariance of EFs in Spanish-speaking children across SES. In the present study, it was expected that the structure of EFs is invariant across SES, meaning that this structure is equivalent among the groups.
Hypothesis 3. Research indicates that LSS children show a low performance in tasks that value different EFs compared with children of MSS (Arán-Filippetti & Richaud de Minzi, Reference Arán Filippetti and Richaud de Minzi2011; Farah et al., Reference Farah, Shera, Savage, Betancourt, Giannetta, Brodsky and Hurt2006; Noble et al., Reference Noble, McCandliss and Farah2007; Noble et al., Reference Noble, Norman and Farah2005). Besides, it has been stated that the age factor influence the performance of tasks which assess EFs (Brocki & Bohlin, Reference Brocki and Bohlin2004; Huizinga et al., Reference Huizinga, Dolan and van der Molen2006; Klenberg et al., Reference Klenberg, Korkman and Lahti-Nuuttila2001; Levin et al., Reference Levin, Culhane, Hartmann, Evankovich, Mattson, Harward and Fletcher1991; Welsh et al., Reference Welsh, Pennington and Groisser1991). Therefore, it was expected to find quantitative differences among EF components, depending on the SES and child age.
Considering the model proposed by Miyake et al. (Reference Miyake, Friedman, Emerson, Witzki, Howerter and Wager2000) and further replicated with children by Lehto et al. (Reference Lehto, Juujärvi, Kooistra and Pulkkinen2003), the present study analyzed the following EFs: (a) Working Memory, (b) Cognitive Flexibility and (c) Inhibition.
To tap the Working memory factor, we selected Digit Span tasks -Digit Span forward (DF) and backward (DB)- and Letter-Number Sequencing (LNS) of WISC-IV. We included both Digit Span tasks, considering previous studies which propose the analysis of DF and DB tasks separately (Rosenthal, Riccio, Gsanger, & Pizzitola Jarratt, Reference Rosenthal, Riccio, Gsanger and Pizzitola Jarratt2006). Hence, DF would offer a measure of the phonological loop (component of the working memory model of Baddeley & Hitch, Reference Baddeley, Hitch and Bower1974) while, in turn, DB would place major demands on the executive system (Rosenthal et al., Reference Rosenthal, Riccio, Gsanger and Pizzitola Jarratt2006). As regards LNS, a previous study indicated the former task as a working memory one since during his execution different premotor cortex, orbitofrontal cortex, dorsolateral prefrontal cortex, and posterior parietal cortex regions would be activated (Haut, Kuwabara, Leach, & Arias, Reference Haut, Kuwabara, Leach and Arias2000).
To measure the Cognitive flexibility factor we selected a number of tasks in order to assess both types of cognitive flexibility proposed by Eslinger and Grattan (Reference Eslinger and Grattan1993): reactive flexibility and spontaneous flexibility. Reactive flexibility refers to the aptitude to modify one’s behavior, alternating among different sets of stimuli in terms of certain demands. In this sense, Wisconsin Card Sorting Test (WCST) is a common test used to value the aforementioned reactive flexibility (Eslinger, Biddle, Pennington, & Page, Reference Eslinger, Biddle, Pennington and Page1999). The WCST (Heaton, Chelune, Talley, Kay, & Curtiss, Reference Heaton, Chelune, Talley, Kay and Curtiss1993) is a well-known measure of EF (Greeve, Stickle, Love, Bianchini, & Stanford, Reference Greve, Stickle, Love, Bianchini and Stanford2005), more precisely of cognitive flexibility or set-shifting. Accordingly, the factor that integrates the variables of the WCST has been termed ‘Cognitive flexibility’ in previous studies (Boone, Pontón, Gorsuch, González, & Miller, Reference Boone, Pontón, Gorsuch, González and Miller1998; Rodríguez-Aranda & Sundet, Reference Rodríguez-Aranda and Sundet2006). In one study, Miyake et al. (Reference Miyake, Friedman, Emerson, Witzki, Howerter and Wager2000) found that the shifting ability predicts the number of perseverative errors on the WCST; from these results, he deduced that the WCST taps the ‘Shifting’ component of the EFs. Similarly, Fisk and Sharp (Reference Fisk and Sharp2004) suggested that the factor that included in their study the WCST indicators could reflect the ‘Shifting’ component proposed by Miyake et al. (Reference Miyake, Friedman, Emerson, Witzki, Howerter and Wager2000). Spontaneous flexibility makes reference to a subject capacity to generate different responses and produce new ideas; precisely, Verbal fluency task is a test used for the assessment of this type of flexibility (Eslinger et al., Reference Eslinger, Biddle, Pennington and Page1999). It has been stated that either Semantic verbal fluency (SVF) or Phonological verbal fluency (PVF) tasks set demands on executive processes and are sensitive to frontal lobe dysfunction (Henry & Crawford, Reference Henry and Crawford2004).
Finally, to tap the Inhibition factor, we chose the Stroop task, the Matching Familiar Figures Test-20 (MFFT20) and the Porteus maze. Stroop test assesses inhibitory capacity and the resistance to interference (Archibald & Kerns, Reference Archibald and Kerns1999; Gerstadt, Hong, & Diamond, Reference Gerstadt, Hong and Diamond1994). It has been specified that the cognitive processes underlying the former task are executive processes mediated by the frontal lobe (Adleman et al., Reference Adleman, Menon, Blasey, White, Warsofsky, Glover and Reiss2002). Consistently, previous studies have demonstrated that those tasks based on the Stroop paradigm load on a factor of the executive system called ‘Inhibition’ (Miyake et al., Reference Miyake, Friedman, Emerson, Witzki, Howerter and Wager2000; St Clair-Thompson & Gathercole, Reference St Clair-Thompson and Gathercole2006). In turn, the MFFT20 is a test that allows EF measurement, particularly the inhibitory function (see Pennintong & Ozonoff, Reference Pennington and Ozonoff1996). Different empirical studies have regularly found that the indicators of MFFT20 -errors or latency- also load on some factor of the executive system; it has been assumed that the former indicators integrate a factor related to Impulse control and Set maintenance (Welsh et al., Reference Welsh, Pennington and Groisser1991) and the Inhibition (Lehto et al., Reference Lehto, Juujärvi, Kooistra and Pulkkinen2003). Finally, Porteus mazes becomes a task widely used to value the EF, specifically the planning ability (Krikorian & Bartok, Reference Krikorian and Bartok1998). Since Lehto et al. (Reference Lehto, Juujärvi, Kooistra and Pulkkinen2003) found that the latency on the MFF and the Tower of London (TOL), another well-known task to measure planning (Shallice, Reference Shallice1982), grouped as a single factor that they called ‘Inhibition’, we presupposed it could likely load on this factor. Indeed, Porteus mazes task would offers a measure of cognitive impulsivity (Arce & Santisteban, Reference Arce and Santisteban2006) and it would be significantly correlated to MFF as adequately demonstrated (Weintraub, Reference Weintraub1973).
Method
Participants
The sample consisted of 248 participants from the city of Santa Fe, Argentina. All children were monolingual native Spanish speakers. To analyze the effects of SES, we selected two groups according to the characteristics of their educational institutions (socioeconomic coefficient) and neighborhoods of origin. The Department of Education suggests certain socioeconomic coefficient that is determined on the basis of family income, establishing a scale that goes from very good to deficient (source: Department of Education of the Province of Santa Fe, Argentina). The groups are described below:
The medium socioeconomic status (MSS) group: 124 children aged 8 to 12. The children attend an urban school and live in middle-class neighborhoods. The socioeconomic coefficient of the school, which is determined based on the family’s income, was “good”. Most parents are independent professionals, professors, storekeepers, or public or private administration employees. On the basis of the information collected from the school, the children met the following inclusion criteria: (a) no clinical, neurological, or psychiatric history; (b) attend school on a regular basis; and (c) no grade repetition or need for corrective programmes.
The lower socioeconomic status (LSS) group: 124 children aged 8 to 12, who attend a school at the periphery of the town and live in peripheral neighborhoods. The socioeconomic coefficient of the school was “deficient”. Most parents in this category are unemployed or unqualified workers, laboring as street vendors or domestic workers or doing odd jobs. The neighborhoods in which this group resides have a high concentration of low-income residents with diverse housing needs. Public services (i.e., sewer, telephone, water supply network and natural gas) are not provided. Data were obtained from the neighborhood health centre to ensure that the children included in the sample were not malnourished, underweight or displaying neurological or psychiatric disorders. The school has a psychopedagogic department staffed by a psychologist, an educational psychologist and a social worker who initiate the detection and school accompaniment of children with learning difficulties. This department determined that the evaluated children did not need pedagogic or psychological treatments or speech therapy.
After both groups were selected, Graffar’s modified scale was used (Méndez-Castellano & de Méndez, Reference Méndez-Castellano and de Méndez1994) to identify differences between the groups in terms of four socioeconomic indicators: family head profession (FHP), maternal education level (MEL), main source of family income (MSFI) and housing conditions (HCs). It is worth-noting that in the former scale, for every variable, higher scores correspond to higher poverty. This scale was selected because SES is a composite variable that includes measures of family income, occupational status and parental education (Ensminger & Fothergill, Reference Ensminger, Fothergill, Bornstein and Bradley2003). Therefore, it is important to consider the three defining indicators when analyzing the SES effect on cognitive performance. By comparing the two groups, significant differences were found for FHP, F(1, 246) = 695.48, p < .001, ηp² = .74, MEL, F(1, 246) = 1516.67, p < .001, ηp² = .86, MSFI, F (1, 246) = 671.21, p < .001, ηp² = .73 and HCs, F(1, 246) = 721.73, p < .001, ηp² = .75. Consistent with the scale, children of families belonging to the LSS group obtained higher average values for the four analyzed indicators.
Measures
Intellectual abilities
Kaufman Brief Intelligence Test (K-BIT) (Kaufman & Kaufman, Reference Kaufman and Kaufman1990): This test measures verbal and nonverbal intelligence and consists of two subtests: Vocabulary and Matrices. By summing the scores obtained in both subtests, a measure of general intelligence can be determined.
Executive functioning
Wisconsin Card-sorting Test (WCST) (Heaton et al., Reference Heaton, Chelune, Talley, Kay and Curtiss1993).
This test measures EFs, particularly cognitive flexibility or set shifting. In the beginning, four stimulus cards are presented to the participant. Afterwards, the participant is given a pile of extra cards and requested to match each card to one of the stimulus cards. Whenever the participant places a card, he/she is told whether the option is right or wrong, but the categories are not explained to the children while they are classifying. In a CFA study, it was observed that the WCST strongly reflected the EF construct (Greve et al., Reference Greve, Stickle, Love, Bianchini and Stanford2005). The indicator included in the CFA was the number of categories completed (CC).
Stroop Color–Word Test (Golden, 1978).
This task measures resistance to interference and inhibitory control. The task includes three conditions: (a) the word condition, (b) the color condition, and (c) the color-word condition. The dependent measure include for analysis was total number of correct items read in the stroop interference sheet (i.e., color-word condition).
Digit Span and Letter–Number Sequencing Subtests of the WISC-IV (Wechsler Intelligence Scale for Children - Fourth Edition) (Wechsler, Reference Wechsler2003).
The Working Memory (WM) subtest is composed of two core subtests: Digit Span (DS) and Letter-Number Sequencing (LNS). DS is composed of two parts: the Digit Forward task (DF) and the Digit Backward task (DB). LNS comprises ten items of three trials each and involves retention and active information manipulation.
Semantic Verbal Fluency Test (SVF, fruits and animals), and Phonological Verbal Fluency (PVF, letters F, A, and S).
This task measure verbal fluency (VF) and consists of asking the subject to name all possible words belonging to a determined category (SVF) or that start with a determined letter (PVF) within a 60-second period excluding proper names and alternate endings of the same word. There are norms available for Spanish-Speaking children (Arán Filippetti & Allegri, Reference Arán Filippetti and Allegri2011; Ardila & Rosselli, Reference Ardila and Rosselli1994).
Porteus Maze Test (Porteus, Reference Porteus1965).
This test assesses planning ability and it is composed of twelve mazes that differ in complexity. In each maze, the participant must trace the way from a starting point to an exit and must avoid blind alleys and dead ends, with no backtracking allowed.
Matching Familiar Figures Test (MFFT20) (Cairns & Cammock, Reference Cairns and Cammock1978).
This test assesses the reflexivity-impulsivity cognitive style. The test consists of presenting the child with a situation containing several alternative answers, of which only one is correct. The child is asked to select the alternative that is identical to the model. The variable included in the CFA was the total number of errors. In previous studies, it has been demonstrated that the MFF indicators show some loading on one factor of the EF construct (Lehto et al., Reference Lehto, Juujärvi, Kooistra and Pulkkinen2003; Welsh et al., Reference Welsh, Pennington and Groisser1991).
Procedure
First, an interview was requested with the school principals, who received explanations regarding the investigation. Then, we asked for authorization from the children’s parents or legal guardians clarifying that the participation was deliberate and anonymous. Finally, we obtained written consent from the parent or legal guardians of each child participating in the study. We individually tested each child in the school area for three sessions lasting up to 30 to 40 minutes per session.
Statistical analysis
We performed CFA by means of the AMOS Graphics 16.0 program (Arbuckle, Reference Arbuckle2007) to test various EF models (one-factor, two-factor, three-factor, and non-correlated-factor models). We estimated the goodness of fit level of the models using the χ2 test and the following fit indexes: Comparative Fit Index (CFI), Incremental Fit Index (IFI) and Akaike’s Information Criterion (AIC). In addition, we calculated the root mean square error of approximation (RMSEA) for each model to identify their degrees of error. To test measurement invariance across SES, we used multi-group CFA. Finally, we used bifactorial multivariate analysis of variance (MANOVA) to analyze the performance of each EF indicator according to SES (MSS and LSS) and group age (8–9 years old and 10–12 years old).
Results
Confirmatory Factorial Analysis (CFA)
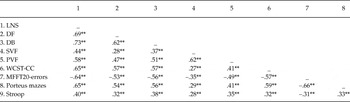
We used CFA to compared different models of EFs for each group (MSS and LSS): a) a three-factor model, b) a two-factor model, c) a one-factor model, and d) a non-correlated-factor model. Task intercorrelations between EFs measures selected for the whole sample are presented in Table 1.
Intercorrelations between Executive Measures (All sample n = 248)

Note: LNS= Letter-number sequencing (WISC IV); DF = Digit Forward (WISC IV); DB = Digit Backwards (WISC IV); SVF = Semantic Verbal Fluency; PVF= Phonological Verbal Fluency; WCST-CC= Complete Categories of WCST; MFFT20-errors = Total errors of the Matching Familiar Figures Test-20; Porteus mazes = Total number of mazes completed; Stroop = color-word interference score of the Stroop test.
** p < .01.
Firstly, we tested the different models in the MSS group. Prior to perform the CFA, using the K-BIT intelligence test (Kaufman & Kaufman, Reference Kaufman and Kaufman1990), we verified that the children who were included in the sample showed intellectual performance within the normal range expected for their ages (M = 94.06; SD = 7.17). To determine which model had a better fit, we considered the fit indexes (CFI, IFI, AIC and RMSEA) and the differences in χ2. As can be observed in Table 2, the three-factor model showed excellent fit indices because χ2 was not significant, the values of the CFI and IFI were superior to 0.90, and the RMSEA was below 0.06. Subsequently, we tested three nested two-factor models to determine whether the structure was better explained with a two-dimensional structure. The fit indices and the χ2 difference test showed that all the two-factor models provided a significantly worse fit than the full three-factor model. For this reason, the three-factor model was retained as the best fit model. To estimate the one-factor model, all of the correlations between latent variables were fixed at 1. As can be observed in Table 2, the χ2 difference test was significant and the fit indices were not satisfactory which led us to reject the model. Finally, we tested a non-correlated-factor model in which all of the correlations between latent variables were fixed at 0. This model could not be identified.
Fit Indices for the Three-factor Confirmatory Factor Analysis Model and Reduced Models for each group

Note: a Indicates comparisons are to the full-three factor model, 2 with 1, 3 with 1, and so forth.
Values higher than 0.95 for CFI and IFI, lower values of AIC, and RMSEA below 0.06 indicate god fit.
χ2 difference tests indicated that all the reduced models 2–5 for both groups provided significantly worse fits than the three factor model.
The non-correlated-factor models could not be identified.
Best fit model are in bold.
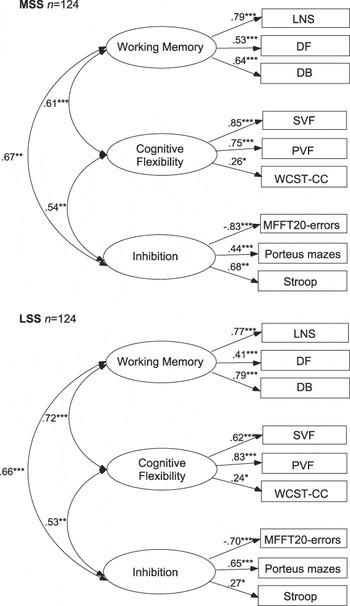
Next, the structure in the LSS group was verified. Similar to what was found in the MSS group, the three-factor model was the model with the most acceptable fit; the χ2 difference test for all the two-factor models provided a significantly worse fit than the full three-factor model, and the non-correlated-factor model could not be identified (see Table 2). In sum, these data suggest that the three-factor model is the best fitting model for both groups. The final three-factor model for each group is illustrated in Figure 1.
Confirmatory Factor Analysis of EFs for each group defined by SES.
*p < .05; **p < .01; ***p < .001.

Multi-group Confirmatory Factor Analysis (MGCFA)
Because the three-factor model presented excellent fit indexes in both groups, we used MGCFA to assess measurement invariance according to the children’s SES.
Measurement invariance is achieved using a sequence of hierarchically nested models. In the first analysis, which allows for the observation of the configural invariance, all parameters can vary independently between groups (baseline model). In the following analyses, equality restrictions are imposed on various parameters between the groups. Non-significant differences among the nested models indicate that the restrictions can be supported, and therefore invariance can be assumed across groups. In turn, because an indicator that restricted parameters were invariant, we required that the CFI difference be equal or less than .01 between successive levels of invariance (Cheung & Rensvold, Reference Cheung and Rensvold2002). Model 1 (M1 baseline model) does not present restrictions for the two groups. Because this model revealed good fit indices (see Table 3), we can assume configural invariance between the groups, meaning that the children from different SES groups conceptualize the EF construct in the same way. In model 2 (M2), the factor loadings are restricted to be equal among the groups. As can be observed in Table 3, the increase in χ2 was not significant, the fit indices of the model were good, and the CFI difference was .01. Therefore, metric invariance was retained, which means that children belonging to distinct SES respond to the indicators of each latent variable and the relationships between these indicators with their latent variable in the same way. In model 3 (M3), the variances and covariances of the factors were set to be equal among the groups. Because the increase in χ2 was not significant, the fit indices of the model were good, and the difference in the CFI was equal to 0, structural invariance was supported. In model 4 (M4), the variances and covariances of the errors of the variables were restricted to be equal among the groups. This level of invariance would indicate the extent of task variance correlated to the latent construct (i.e., related to reliability). Since the increase in χ2 was significant, and the CFI difference was −.08, residual invariance was not supported. Hence, this fact would show that these specific tasks do not provide correspondingly accurate EF measures for children of different SES. However, it has been suggested that test of residual invariance is highly constrained (Chan, Reference Chan1998); thus it would be less important than the previous analysis for the assessment of measurement invariance (see Table 3).
Measurement invariance across SES

Note: a Indicates comparisons are to the previous model, M2 with M1, M3 with M2, and M4 with M3.
Finally, to analyze the differences in factor means between groups, we compare a model where the latent mean for each factor was freely estimated across groups against a model where they were constrained to be equal across groups. Since the increase in χ2 was significant (p = .010), and the CFI difference was −.02, equivalence of factor means was not supported. Next, we selected the MSS as the reference group; thus we set each MSS EF factor mean as 0, and free values of 0 for EF factor of LSS group, in order to analyze if the latent means of LSS group were significantly difference from 0 (i.e., the latent means of the MSS group). Results indicate that LSS children displayed lower means in each EF factor (all EF factors means significantly different from 0 at the .001 level).
Performance on each EF indicator according to SES and group age
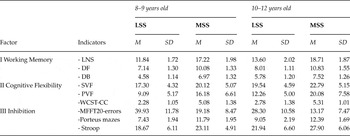
We used bifactorial MANOVA to analyze the mean differences for each EF indicator among SES and group age, incorporating the variable SES (MSS and LSS) and group age (8–9 and 10–12 years old) as fixed factors and each EF dimension as dependent variables. Table 4 shows the descriptive statistics for each EF indicator according to SES and group age.
Means (M) and Standard Deviation (SD) for each Factor according to SES and group Age

FACTOR I-Working memory
MANOVA results showed an effect of SES (Hotelling’s T = 2.28), F(3, 242) = 184.11 p < .001, ηp² = .70 and group age (Hotelling’s T = .22), F(3, 242) = 17.91 p < .001, ηp² = .18, but not for the interaction between the two (Hotelling’s T = .02), F(3, 242) = 1.39 p = .246, ηp² = .02. Significant SES effects were found for LNS, F(1, 244) = 425.68 p < .001, ηp² = .64, DF, F(1, 244) = 279.43; p < .001, ηp² = .53 and DB, F(1, 244) = 160.15 p < .001, ηp² = .40, with an advantage being observed for the MSS group. Age differences for LNS, F(1, 244) = 40.92 p < .001, ηp² = .14, DF score, F(1, 244) = 22.30 p < .001, ηp² = .08 and DB, F(1, 244) = 28.47 p < .001, ηp² = .10, favoring the older group were observed.
FACTOR II – Cognitive flexibility
MANOVA results showed that there was a significant effect of SES (Hotelling’s T = 1.30) F(3, 242) = 104.64 p < .001, ηp² = .57 and group age (Hotelling’s T = .10), F(3, 242) = 8.17 p < .001, ηp² = .09. No differences were found for the interaction between the two (Hotelling’s T = .004), F(3, 242) = 0.31 p = .816, ηp² = .004. Significant SES effects were found for SVF, F(1, 244) = 22.85 p < .001, ηp² = .09, PVF, F(1, 244) = 85.69 p < .001, ηp² = .26 and WCST-CC, F(1, 244) = 255.52; p < .001, ηp² = .51, with an advantage being observed for the MSS group. Age differences for SVF, F(1, 244) = 15.00; p < .001, ηp² = .06, PVF, F(1, 244) = 19.23, p < .001, ηp² = .07 and WCST-CC, F(1, 244) = 4.81; p = .029, ηp² = .02, favoring the older group were observed.
FACTOR III – Inhibition
MANOVA results showed that there was a significant effect of SES (Hotelling’s T = 1.33) F(3, 242) = 107.14, p < .001, ηp² = .57 and group age (Hotelling’s T = .30), F(3, 242) = 24.08, p < .001, ηp² = .23, but not for the interaction between the two (Hotelling’s T = .03), F(3, 242) = 2.56, p = .056, ηp² = .03. Significant SES effects were found for total errors of the MFFT20, F(1, 244) = 198.10, p < .001, ηp² = .45, Porteus mazes, F(1, 244) = 215.96; p < .001, ηp² = .47 and the Stroop test, F(1, 244) = 44.07, p < .001, ηp² = .15, with an advantage being observed for the MSS group. Age differences for total errors of the MFFT20, F(1, 244) = 47.96, p < .001, ηp² = .16, Porteus mazes, F(1, 244) = 18.02, p < .001, ηp² = .07 and the Stroop test, F(1, 244) = 26.49, p < .001, ηp² = .10, favoring the older group were observed.
Discussion
The main goal of the present study was to analyze the latent structure of EFs among Spanish-Speaking children and to test measurement invariance across SES. To document this objective, we started from an EF model similar to that proposed by Miyake et al. (Reference Miyake, Friedman, Emerson, Witzki, Howerter and Wager2000) and later established in a child population by Lehto et al. (Reference Lehto, Juujärvi, Kooistra and Pulkkinen2003) which proposed a structure composed of three separate but associated components.
Interpreting the Structure of EF
The CFA in both groups (MSS and LSS) showed best fit for the three factor solution: (1) Working Memory, (2) Cognitive Flexibility, and (3) Inhibition. Working memory is considered a brain system which allows to keep and manipulate information necessary for the execution of complex tasks such as comprehension, learning and reasoning (Baddeley, Reference Baddeley1992). Thus, the first EF component may reflect cognitive processes such as information maintenance and manipulation. Consistently, many authors have suggested that working memory constitutes one of the EF central components (Diamond, Reference Diamond, Bialystok and Craik2006; Roberts & Pennington, Reference Roberts and Pennington1996). The second dimension -the Cognitive flexibility factor- may reflect the ability to monitor our own responses depending on the feedback received and alternate between different sets of stimuli in order to reach the task objective (i.e., reactive flexibility). In the same way, it would manifest the aptitude to produce and generate different responses (i.e., spontaneous flexibility). Accordingly, Lehto et al. (Reference Lehto, Juujärvi, Kooistra and Pulkkinen2003) found that word fluency and the Trail Making Test (another well-known task to measure reactive flexibility) grouped in an equal executive system factor coined ‘Shifting’. Finally, the Inhibition factor may reflect the ability to inhibit and suppress irrelevant information to reach an objective. However, the type of inhibition that this factor refers to should be clarified because the term ‘inhibition’ has various meanings depending on the adopted paradigm. To resolve this issue, Nigg (Reference Nigg2000) has proposed a taxonomy of inhibitory processes into three types: executive inhibition, motivational inhibition and automatic inhibition, which are themselves divided into different subtypes. Executive inhibition is further divided into (a) behavioral inhibition, (b) interference control, and (c) cognitive inhibition. Thus, taking into account the processes assessed by the tasks selected in the present study, this dimension is thought to correspond to executive inhibition. In this way, this factor would reflect the ability to inhibit and suppress irrelevant information, which, in turn, allows for the necessary response delay and self-regulation of one’s behavior during the execution of complex, goal-directed tasks.
Overall, our results are in agreement with previous studies that assume a multi-dimensional construct among both child (Brocki & Bohlin, Reference Brocki and Bohlin2004; Huizinga et al., Reference Huizinga, Dolan and van der Molen2006; Klenberg et al., Reference Klenberg, Korkman and Lahti-Nuuttila2001; Lehto et al., Reference Lehto, Juujärvi, Kooistra and Pulkkinen2003; Levin et al., Reference Levin, Culhane, Hartmann, Evankovich, Mattson, Harward and Fletcher1991; López-Campo et al., Reference López Campo, Gómez-Betancur, Aguirre-Acevedo, Puerta and Pineda2005; Pineda et al., Reference Pineda, Ardila, Rosselli, Cadavid, Mancheno and Mejia1998; Welsh et al., Reference Welsh, Pennington and Groisser1991) and adult populations (Fisk & Sharp, Reference Fisk and Sharp2004; Miyake et al., Reference Miyake, Friedman, Emerson, Witzki, Howerter and Wager2000; Pineda et al., Reference Pineda, Merchán, Rosselli and Ardila2000). Moreover, both the number of factors identified and their terminology are consistent with what reported by Diamond (Reference Diamond, Bialystok and Craik2006), Lehto et al. (Reference Lehto, Juujärvi, Kooistra and Pulkkinen2003) and Miyake et al. (Reference Miyake, Friedman, Emerson, Witzki, Howerter and Wager2000).
Socioeconomic Status and Age Effects
As was hypothesized, the results confirm that configural, metric, and structural invariance across SES can be assumed. Similar results were found by Wiebe et al. (Reference Wiebe, Espy and Charak2008) in preschool-aged children. These data suggest that there are no qualitative differences between groups during the performance of different tasks assessing EFs. The same cognitive processes are at work; that is, children from different SES conceptualize the EF construct in the same way. However, when comparing the means obtained for each EF factor and indicators according to SES, we discovered significant differences in favor of the MSS group in the three EF components. These data show differences of a quantitative nature and are consistent with the findings of previous studies regarding a poorer performance among LSS children compared to MSS children in EF tasks (Arán Filippetti & Richaud de Minzi, Reference Arán Filippetti and Richaud de Minzi2011; Farah et al., Reference Farah, Shera, Savage, Betancourt, Giannetta, Brodsky and Hurt2006; Noble et al., Reference Noble, McCandliss and Farah2007; Noble et al., Reference Noble, Norman and Farah2005).
Regarding the Working memory factor, LSS children had a lower performance in tasks assessing working memory than their MSS peers. The cognitive profile found in LSS children suggests difficulties in retaining and manipulating verbal information ‘on line’ for short-term use. Likewise, since this factor would also reflect verbal skills and may be considered as a Verbal-based factor, SES disparities would also be evident in this cognitive area. This is consistent with previous studies conducted in low and middle-SES children that found SES disparities in Left perisylvian/Language and Medial temporal/Memory systems and in Lateral/Prefrontal/Working memory (Farah et al., Reference Farah, Shera, Savage, Betancourt, Giannetta, Brodsky and Hurt2006; Noble et al., Reference Noble, McCandliss and Farah2007). Significant differences among SES were also found regarding the Cognitive flexibility factor; LSS children completed fewer categories in the WCST and generated fewer words in VF tasks than the MSS group. This profile suggests SES disparities in reactive and spontaneous cognitive flexibility. Finally, with respect to the third EF factor (i.e., the Inhibition factor), the results indicate that the LSS group obtain lower punctuations in the Stroop test, made significantly more errors with short latencies in the MFFT20, and completed a minor number of mazes than the MSS group. These data confirm the results reported by previous studies which found SES disparities in Anterior cingulate/Cognitive control (Farah et al., Reference Farah, Shera, Savage, Betancourt, Giannetta, Brodsky and Hurt2006; Noble et al., Reference Noble, McCandliss and Farah2007), a high proportion of impulsive children from low-socioeconomic or disadvantageous cultural sectors (Arán Filippetti & Richaud de Minzi, Reference Arán Filippetti and Richaud de Minzi2011; Juliano, Reference Juliano1977; Mumbauer & Miller, Reference Mumbauer and Miller1970) and minor planning abilities in LSS children (Arán Filippetti & Richaud de Minzi, Reference Arán Filippetti and Richaud de Minzi2011). Overall, the data is in line with previous studies that argue that growing up in poverty has a negative effect on cognitive development (Brooks-Gunn & Duncan, Reference Brooks-Gunn and Duncan1997).
Secondly, it was observed that in both groups, LSS and MSS, age influenced tasks execution which eventually values the EF components. These results coincide with those of previous studies that found an age effect on the execution of tasks valuing the domains of (a) Working memory (Gathercole, Pickering, Ambridge, & Wearing, Reference Gathercole, Pickering, Ambridge and Wearing2004; Huizinga et al., Reference Huizinga, Dolan and van der Molen2006), (b) Cognitive flexibility (Huizinga et al., Reference Huizinga, Dolan and van der Molen2006; Lehto et al., Reference Lehto, Juujärvi, Kooistra and Pulkkinen2003), and (3) Inhibition (Brocki & Bohlin, Reference Brocki and Bohlin2004; Klenberg et al., Reference Klenberg, Korkman and Lahti-Nuuttila2001). The improvement in the performance of EF tasks in terms of age seems to be connected to different processes of cerebral maturation. Neuroimaging has registered a linear growth in white matter from childhood up to adolescence (Giedd et al., Reference Giedd, Blumenthal, Jeffries, Castellanos, Liu, Zijdenbos and Rapoport1999) but revealed nonlinear changes in cortical gray matter, with a prepubescent increase followed by a postadolescent decline (Giedd et al., Reference Giedd, Blumenthal, Jeffries, Castellanos, Liu, Zijdenbos and Rapoport1999; Gogtay et al., Reference Gogtay, Giedd, Lusk, Hayashi, Greenstein, Vaituzis and Thompson2004). Similarly, postnatal changes have been stated in a number of processes, namely brain myelination (Sowell, Thompson, Tessner, & Toga, Reference Sowell, Thompson, Tessner and Toga2001), synaptic processes (Huttenlocher & Dabholkar, Reference Huttenlocher and Dabholkar1997) and cerebral glucose metabolism (Chugani, Reference Chugani1999). These structural cerebral changes correspond with the emergence of diverse cognitive functions. As specified, motor and sensory regions associated with highly basic functions would maturate first, following the areas linked to language development and spatial orientation, and eventually frontal regions associated with EFs and attention (Gogtay et al., Reference Gogtay, Giedd, Lusk, Hayashi, Greenstein, Vaituzis and Thompson2004).
Interestingly, though in every group-age LSS children demonstrated a lower performance than MSS children, the development profile was similar in both groups. This suggests that the cognitive observable profile of LSS children should mainly result from a lack of experience rather than from a permanent deficit in the mechanisms necessary for the development of EFs. Basically, it was observed a gradual increase of these functions with age but not a stable deficit in development.
Based on the solid evidence within the field of neuroscience that EFs and the PFC develop postnatally (Diamond, Reference Diamond, Stuss and Knight2002; Fuster, Reference Fuster1997), it is reasonable to suggest that these regions might be sensitive to SES. This observation is in line with brain studies that have shown a maturational lag in the frontal region (Otero, Pliego-Rivero, Fernandez, & Ricardo, Reference Otero, Pliego-Rivero, Fernández and Ricardo2003), left-frontal hypoactivity (Tomarken, Dichter, Garber, & Simien, Reference Tomarken, Dichter, Garber and Simien2004), and alterations in PFC functioning (Kishiyama, Boyce, Jimenez, Perry, & Knight, Reference Kishiyama, Boyce, Jimenez, Perry and Knight2009) among LSS children and adolescents. Previous studies have found that the parent education level is the main socioeconomic variable that explains the neurocognitive differences associated with SES (Arán Filippetti & Richaud de Minzi, Reference Arán Filippetti and Richaud de Minzi2012; Noble et al., Reference Noble, McCandliss and Farah2007; Noble et al., Reference Noble, Norman and Farah2005). It has also been noted that the association among these socioeconomic indicators and executive task performance can be partially explicated in terms of cognitive mediating factors, such as cognitive impulsivity, but not by IQ level (Arán Filippetti & Richaud de Minzi, Reference Arán Filippetti and Richaud de Minzi2012).
Theoretical implications of EF structure
Overall, our data are consistent with the view that assumes a diverse structure for EFs because three separate factors were found, but at the same time unitary, because these factors are correlated (i.e., the unity-but-diversity view, see, e.g., Lehto et al., Reference Lehto, Juujärvi, Kooistra and Pulkkinen2003 and Miyake et al., Reference Miyake, Friedman, Emerson, Witzki, Howerter and Wager2000). Interestingly, despite having used different tasks to those of previous studies, a three-factor structure was consistently found. This fact suggests that regardless of the EF tasks employed, these would be assessing three broad functions or executive dimensions but, since they are correlated, the former would depend on a common underlying mechanism. So, what would be the mechanism underlying the tasks employed in this study? A possible explanation could be that the tasks used in this study and, in general, those that assess EFs, require keeping information in mind and self-regulation to achieve the goal proposed by the task. Besides, the fact that the execution of tasks that assess EFs requires attentional control might also be considered; for instance, a recent study stated that working memory and EF tasks share a common underlying component of executive attention (McCabe, Roediger, McDaniel, Balota, & Hambrick, Reference McCabe, Roediger, McDaniel, Balota and Hambrick2010). This would explain the unitary nature of EF structure. However, it would also be diverse, since each task would entail specific resources depending on the goal, as: to manipulate information ‘on line’ (i.e., Working memory factor), to switch between different set of stimuli and to produce different ideas (i.e., Cognitive flexibility factor), or to reflect and look in detail in order to give a correct response and inhibit incorrect ones (i.e., Inhibition factor).
This assumption could favorably confirm the existence of a general prefrontal EF, adaptable, which would operate in different ways depending of tasks requirements and, given the reciprocal connections between the PFC with different brain areas, might employ different available resources depending on tasks. Could the differences between tasks explain the EF diverse nature? Would it be, then, more appropriate to speak of ‘executive tasks’ that require ‘executive functioning’ -as a single entity or as a more general process-? This idea would be consistent with current models of executive functioning that proposed an adaptable and changeable association between the PFC and EF task performance. For instance, the adaptive coding model of PFC function proposed by Duncan (Reference Duncan2001) suggests that working memory, selective attention and cognitive control are three different aspects of the same underlying processing function. Its main idea is that PFC neurons are highly adaptable allowing the temporal representation of relevant information, acting as a working memory system. Thus, any cell in this region has the potential to be activated by different types of inputs. This model suggests that PFC has non-specific monitoring functions that can be adapted to different cognitive demands.
From this perspective, an important aspect to consider in the study of EFs is the distinction between ‘executive tasks’ and the ‘underlying cognitive mechanism’ common to them, as the different demands imposed by EF tasks could be explaining the diverse nature of EFs but the core underlying cognitive mechanism would be the same. Therefore ‘executive functioning’ might be considered as a more general process or emergent function, resulting from the joint operation of its different subprocesses (i.e., EF components).
The results of the present study are important in two main respects. First, both CFA and MGCFA allowed us to determine that EFs in both groups consist of three dimensions, each of which is responsible for different cognitive operations but working together for the execution of complex cognitive tasks. These data suggest that a single executive task may not be sufficient to measure executive ability and that different tasks may be necessary to assess the components of the EF construct. Interestingly, although the number of factors can vary depending on the study, due to the tests included in the analysis and the characteristics of the sample, the structure we found was equivalent in both groups, thereby adding validity to the unitary but diversity hypothesis of EFs in Spanish-speaking children. It should be note that although our results indicated three factors that were interpreted in a similar way to those presented by Lehto et al. (Reference Lehto, Juujärvi, Kooistra and Pulkkinen2003) and Miyake et al. (Reference Miyake, Friedman, Emerson, Witzki, Howerter and Wager2000), most of the tests we used are different from those used in the above-mentioned studies; consequently, this difference limits the generalization of the results.
Second, these findings represent a contribution to intervention strategies that are aimed at reducing the effects of SES on EF development and represent an important step toward understanding the influence of social and environmental factors involved in cognitive development. Our results suggest that differences in the executive task performance between children of different SES would be primarily quantitative (i.e., low punctuations) and not qualitative, since it was noted that EF structure was invariant across SES, and EF task execution improves with age in every variable and in both groups.
Understanding the dimensional nature of EFs and the factors that may influence their development provides the tools that are necessary to optimize the assessment, diagnostic steps, and intervention strategies needed among child populations with dysexecutive cognitive profiles.