Introduction
Footrot is a highly contagious bacterial disease of sheep affecting the interdigital skin and the surrounding soft and hard horn of a hoof, often resulting in severe lameness. There are various options for control and treatment, and the most effective strategy appears to be prompt treatment of affected animals, which also reduces spread of the infection (Egerton, Reference Egerton2000; Green et al., Reference Green, Wassink, Grogono-Thomas, Moore and Medley2007). In Britain it is estimated that about 6% of adult ewes and 3% of lambs are affected at any time (Grogono-Thomas et al., Reference Grogono-Thomas, Cook and Johnston1998; Wassink and Green, Reference Wassink and Green2001; Clements et al., Reference Clements, Mellor and Fitzpatrick2002) and the costs associated with the disease have been estimated at £24.4 M annually for Great Britain or £1.32 per ewe and £0.15 per lamb (Nieuwhof and Bishop, Reference Nieuwhof and Bishop2005).
Infection of animals by a disease is expected to affect their general wellbeing and performance. For example, estimates of the reduction of live weight in lambs infected with internal parasites range from 6.2% to 23% (Coop et al., Reference Coop, Graham, Jackson, Wright and Angus1985; Mackay et al., Reference Mackay, Betteridge, Devantier, Budding and Niezen1998). Sheep scab leads to a 53% reduction in growth rate in lambs (Kirkwood, Reference Kirkwood1980) and a 10% loss in birth weight (Sargison et al., Reference Sargison, Scott, Penny and Pirie1995), while losses in lamb weaning weight due to Maedi-Visna have been estimated at 12% for the most severe cases (Pekelder, Reference Pekelder1994). Based on results of Symons (Reference Symons1978) and Stewart et al. (Reference Stewart, Clark and Jarrett1984) it can be estimated that ewes infected with footrot have a reduced lamb output of 18%. Marshall et al. (Reference Marshall, Walker, Cullis and Luff1991) investigated the long-term effect of footrot on the live weight of wethers that were 1.5 years old at the start of a 2-year trial. One group of animals that was left largely untreated over the study period showed a significant decrease in body weight at times of high footrot prevalence, but on average animals regained the lost weight in the following months. Any variation between animals in their response to footrot and the nature of this variation were not studied.
Genetic variation in resistance to footrot has been demonstrated (Skerman et al., Reference Skerman, Johnson, Kane and Clarke1988; Raadsma et al., Reference Raadsma, Egerton, Wood, Kristo and Nicholas1994; Conington et al., 2007), with the heritability depending on the definition of footrot (number of classes, observed or underlying scale) and reaching values up to 0.3. While Raadsma et al. (Reference Raadsma, Egerton, Wood, Kristo and Nicholas1994) showed an increased risk of footrot with heavier live weights, they did not estimate the effect of footrot on live weight gain. Breeding objectives for most selection programmes for meat or multipurpose sheep breeds include higher growth rates, and it is important to know if higher weights achieved through selection will lead to higher susceptibility to footrot and consequently higher weight losses.
The current study aims to estimate the effect of footrot in lambs on their growth performance. Data on footrot severity and live weights are used from the experiment described by Raadsma et al. (Reference Raadsma, Egerton, Wood, Kristo and Nicholas1994) in which lambs were exposed to footrot and vaccinated 6 or 9 weeks later. A further aim is to separate effects of live weight on the risk of footrot from the effect of footrot on subsequent live weights. To this end, a number of extra traits are defined to describe footrot severity and the effects on growth. Genetic and phenotypic correlations between footrot severity and weight (gain) are estimated, allowing prediction of the effects of selection on increased weights on footrot and its consequences.
Material and methods
Animals and treatments
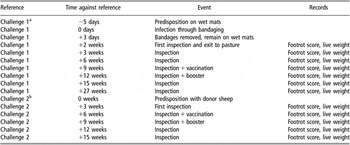
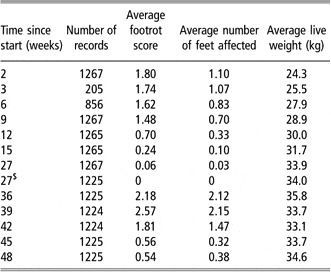
A study was conducted over a 4-year period, as described in detail by Raadsma et al. (Reference Raadsma, Egerton, Wood, Kristo and Nicholas1994). Each year, two groups of about 200 Merino sheep were infected with footrot on two separate occasions followed by vaccination. All data from year 2, when the trial was interrupted by a dog attack that killed some sheep and required treatment of others, were eliminated, however. At the start of trial 1, when animals were about 10 months of age, they were artificially infected for the first time, the second infection through exposure on pasture (start of trial 2) was about 33 weeks after the first and the two trials combined took 48 weeks (Table 1). Weights at, or close to, the start of each of these two trials and at 3-week intervals were recorded for up to 15 weeks after infection, although not all weights were taken on all animals (see Table 2). An overall footrot score was assigned to each animal at the same 3-week intervals on a 0 (no footrot) to 5 (severe footrot) scale and the number of feet affected was recorded. Data from animals that had footrot in week 27 (6 weeks prior to the second infection) were not considered for the second trial. Animals were vaccinated with homologous strain vaccines 9 and 6 weeks post infection in each trial, respectively, inducing a high degree of healing (Raadsma et al., Reference Raadsma, Egerton, Wood, Kristo and Nicholas1994).
Timeline of treatments and records over the two trials

aChallenge 1 occurred at 10 months of age.
bChallenge 2 occurred 33 weeks after challenge 1.
Number of animals recorded and average footrot score, number of feet affected and average live weight over the two trials

$Includes only those free of footrot for inclusion in trial 2.
The total dataset comprised 1267 animals with complete records for the first trial (Table 2). Of these, 1225 animals with a 27-week weight record were included in the analysis of the second trial (group size varying from 205 to 220 in trial 1 and 198 to 214 in trial 2).
Quantifying the impact of footrot on weight gain
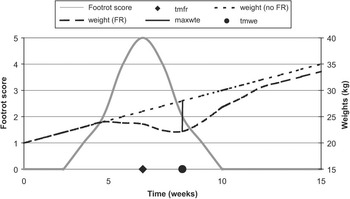
Initial inspections of the live weight data indicated that impacts of footrot on weight gain are transient. Therefore, additional traits have to be derived from the raw data to capture these transient effects. To enable this, a general framework for the effect of infection or disease on the live weight of an animal was developed as shown in Figure 1. In terms of effects on live weight, the first noticeable effect will be weight loss or reduced gain some time after the infection. This may coincide with the first observation of clinical signs of disease, precede them or follow later. If an animal recovers from the disease, the weight loss will reach a maximum and then decline and there may or may not be a permanent long-term effect on the animal’s live weight.
General framework for the development of footrot and weight following infection (footrot score on 0 to 5 scale, time after infection and weights in arbitrary units).

Figure 1 shows a hypothetical profile for the change in footrot score that peaks at time t = 6; a straight line depicts the weight gain of an unaffected animal, and a curve that of an affected animal that initially loses weight and then regains much of the weight loss through compensatory growth.
Based on this figure the following new traits can be defined:
• Peak time (tmfr): the time between infection and the highest footrot score;
• Maximum weight effect (maxwte): the biggest negative difference in weight of an infected animal compared to that expected from unaffected growth;
• Time of maximum weight effect (tmwe): the time at which the maximum weight effect occurs since infection;
• Time (twe_fr) between maximum footrot and maximum weight loss.
Analysis
The effect of footrot on weight gain (or loss) can be estimated at two levels: a general estimate at population level and an individual animal estimate. The former can be estimated by comparing unaffected animals with affected animals, taking into account severity of the disease (Marshall et al., Reference Marshall, Walker, Cullis and Luff1991). The second method, which allows estimation of between animal variation, requires comparison of the actual growth curve of an affected animal with the unobserved curve predicted for that individual animal if had not been affected.
In line with Raadsma et al. (Reference Raadsma, Egerton, Wood, Kristo and Nicholas1994), animals were deemed unaffected if they did not have any overall footrot scores >1 over a trial. Growth curves for unaffected animals in trial 1 were estimated using SAS GLM (Statistical Analysis Systems Institute (SAS), 1989) fitting the model:

with:

For trial 2, the same model was used, except that the sex × time interaction was not significant and was eliminated from the model. Note that for trial 1 the earliest available weight was 2 weeks after infection and this was considered the start weight. In trial 2, the weight 6 weeks prior to the second infection (27 weeks after the first infection) was used as start weight.
For all animals, these regressions were then used to predict live weight at time t, using (i) the linear regression (pwtlt) only, (ii) linear and quadratic terms (pwtqt) and (iii) linear, quadratic and cubic (pwtct) terms:

The same procedure was used for trial 2, but without the sex-specific regression of weight on time.
Deviations of actual from predicted weights, at various time points, were calculated for each animal, separately for the pwtl, pwtq and pwtc predictions. In affected animals, this deviation is expected to be negative (i.e. a reduction in weight gain). The maximum weight effect (maxwte) was the most negative deviation, and the time this occurred was the week of maximum weight effect (tmwe). In cases where the same maximum weight effect occurred more than once, the time of the maximum was the average of the occurrences when this maximum occurred. The variable endwte was calculated as the weight deviation at the end of each trial, again separately for predictions based on linear, quadratic or cubic regressions.
The effect of footrot on these traits was then estimated with SAS GLM for all animals in each trial as:

where Yijklmn=maxwte or tmwe and footrot=sum of footrot scores or maximum footrot score during the trial.
Regardless of the effects of footrot, maxwte (and possibly tmwe) can be expected to have a genetic component, as it is a measure of growth compared to a group average. In this study, we are interested in finding whether this genetic component is related to measures of footrot resistance. Genetic analyses were done with an animal model using VCE 5.1 (Kovac and Groeneveld, Reference Kovac and Groeneveld2003), generally with the model:

with variables defined as above and animaln is a random effect accounting for the direct genetic effect associated with animal n. The start weight effect accounts for the weight related risk of contracting footrot and was excluded from certain models in multivariate analyses of live weights. The footrot effect was not included when analysing footrot severity or in multivariate analyses with a footrot measure as one of the dependent traits. The pedigree contained 5815 animals.
Results
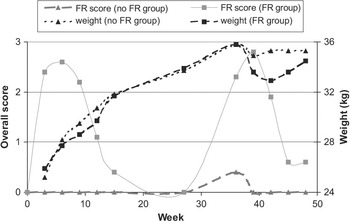
The average overall footrot score and live weights for animals deemed free of footrot (maxFR < 2) and also for affected animals are presented in Figure 2. The development over time confirms the basic framework in Figure 1. It can be seen that the impacts on live weight do appear to be transient, occurring after the time of maximum footrot severity.
Average overall score and live weight for animals with a maximum footrot score < 2 (no FR group) and others (FR group).

Weights of animals were predicted using their weight at the start of the trial and growth curves estimated from the healthy animals. In trial 1, there were 435 healthy animals with a total of 2164 weight records, while only 84 animals, with 419 weights, were considered unaffected in trial 2. Linear, quadratic and cubic terms of the growth curves were significant in both trials.
Effect of footrot on live weight
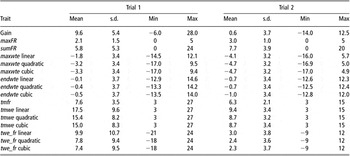
Table 3 summarises the parameters describing the impact of footrot. The traits shown are: sumFR the sum of all footrot scores over the trial, maxFR the maximum of the footrot scores over the trial, and other parameters are defined above. With regard to timing, it can be seen that peaks for footrot score and the maximum weight effect could occur at any time during the trials (from week 3 to 27 in trial 1 and week 3 to 15 in trial 2), but the average time of the maximum footrot score in both trials was between 6 and 8 weeks, with the maximum weight effect following later. In trial 1, depending on how the healthy growth was predicted, the maximum weight effect occurred 7 to 10 weeks after the highest footrot score (twe_fr), while in trial 2 on average the delay was only 2 to 3 weeks. There were some minor differences in the estimated effects using linear, quadratic or cubic terms in the prediction of healthy growth.
Distributions of footrot and weights traits (trial 1 n = 1267, trial 2 n = 1225)

Weights in kg and times in weeks.
Over the duration of trial 1, animals gained an average of almost 10 kg and the average maximum weight effect (maxwte) was, as expected, negative (−1.8 to −3.3 kg), but by the end of the trial the effect on weight had almost completely disappeared. In trial 2, there was little weight gain (+0.6 kg) and the average maximum weight effect was larger (−4.1 to −4.7 kg), which may partly be due to the later start weight in trial 1 (2 weeks after infection) compared to trial 2 (6 weeks prior to infection). At the end of trial 2, which was much shorter, only a small weight loss remained, showing important compensatory growth.
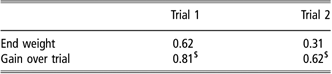
The maximum weight effect is only moderately correlated with the weight at the end of each trial, whereas there is a much stronger correlation with the growth over the trial (adjusted for start weight) (Table 4).
Residual correlations of the maximum weight effect (maxwte) with end weight or weight gain over each trial, using a linear prediction of healthy growth
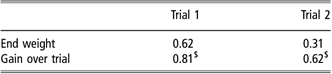
$Gain and maximum weight effect adjusted for start weight.
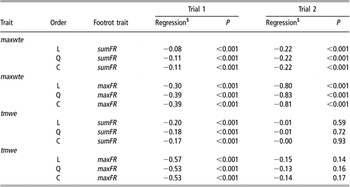
Weight at the start of each trial has a clear effect on the size of the maximum weight effect, with a regression of 0.05 to 0.10 kg/kg of maximum weight loss on start weight in trial 1 (depending on exact model) and about 0.15 in trial 2 (P < 0.01). Table 5 shows the effect of footrot on the size and time of the maximum weight effect in trials 1 and 2, estimated as a linear regression and depending on the order (linear, quadratic and cubic) used to predict healthy growth. Again there is little difference between estimates based on linear, quadratic or cubic predictions of healthy growth. Footrot, by either measure, has a highly significant negative effect on live weight. For example in trial 1, an animal with a sumFR of 5.8 (the average) would lose about 0.5 to 0.6 kg compared to healthy growth. The effect of the maximum scores is slightly larger, ca. 0.6 to 0.8 kg loss at a maximum score of 2.1. The effects in trial 2 are much larger, both due to higher regression coefficients and higher average footrot scores, resulting in 1.7 kg weight loss at a sum of scores of 7.7, and 2.5 kg loss for a maximum score of 3.0.
Effects of footrot severity on weight and time of maximum weight effect (‘regression’) and level of significance in trials 1 and 2, depending on the order of the regression used in the prediction of healthy growth

$Linear regression units are kg/point for maxwte and endwte, weeks/point for tmwe.
In trial 1, the effect of severity of footrot on the time the maximum weight effect (tmwe) occurs is also highly significant, with the effect occurring sooner for more severe footrot. There is no such effect in trial 2.
Genetic effects on weight loss
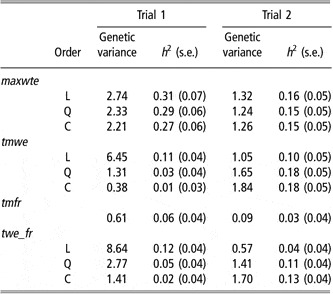
Univariate estimates of genetic variances and heritabilities for the various footrot and derived traits, based on models accounting for the standard fixed effects, start weight and sum of footrot scores are given in Table 6. In trial 1, the heritability for the maximum weight effect is about 0.30 and higher than that of gain over the same period, which is 0.17. The heritability is smaller in trial 2, but the phenotypic variance is similar. The time of peak footrot or maximum weight loss and the length of time between them have very small heritabilities, which also depend on the order of covariates used to estimate healthy growth.
Genetic variances (kg2) and heritabilities for weight effects (n = 1267 for trial, n = 1225 for trial 2), depending on the order of the regression used in prediction of healthy growth

Models fitted included the standard fixed effects and start weight and sum of footrot scores as covariates, and for trial 2 also sum of footrot scores from trial 1.
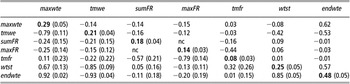
Table 7 shows the genetic and phenotypic correlations between the various variables defined from trial 1 data, including the sum of footrot scores and the maximum footrot score, as well as heritabilities for each variable. The corresponding variances and covariances are given in Table 1.1 of Appendix 1. The model fitted was the same for all traits and excluded the start weight. Because the two footrot score variables were highly correlated and a model with both included would not converge, estimates in Table 7 are based on two separate multivariate analyses, each excluding either footrot measure (estimates for parameters in both analyses were essentially the same). The estimates for the heritabilities of these traits were similar to those presented by Raadsma et al. (Reference Raadsma, Egerton, Wood, Kristo and Nicholas1994).
Genetic parameters (standard errors) and phenotypic correlations for weight and footrot traits including start weight and end weight in trial 1

maxwte and tmwe are based on the linear predictions of healthy growth. Heritabilities on, genetic correlations below and phenotypic correlations above diagonal.
nc = no convergence.
Footrot score and maximum weight effect have a negative genetic correlation indicating that selection for increased resistance to footrot would lead to a lower impact on weight in affected animals. The genetic correlation between maxwte and tmwe is strongly negative, which is consistent with some animals recovering, while others continue to lose weight, but the phenotypic correlation is small (−0.14). There is a strong positive correlation between maxwte and wtst showing that at equal severity of footrot, larger animals cope better with the disease, and the negative correlation with tmwe suggests that the effects that do occur will happen sooner. Based on the negative correlation of maxFR and tmfr it appears that the sooner footrot reaches maximum severity, the less severe it is.
In alternative analyses (not shown) in which the start weight was included in the model as a covariate, or maxwte and tmwe were based on estimates of healthy growth including a cubic term, genetic and phenotypic correlations were very similar to those without the covariate or cubic terms as presented in Table 7.
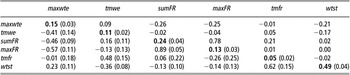
The equivalent estimates for trial 2 are given in Table 8 and corresponding variances and covariances given in Table 1.2 of Appendix 1. Compared to trial 1 (Table 7), estimates of genetic correlations between weight loss and footrot are stronger, but there does not seem to be a correlation of footrot severity with timing of its peak. The genetic correlation between start weight and maxwte is much lower, indicating that at this stage, genes that affect growth have a much smaller effect on the reaction to footrot.
Genetic parameters (standard errors) and phenotypic correlations for weight and footrot traits including start weight in trial 2

maxwte and tmwe are based on the linear predictions of healthy growth. Heritabilities on, genetic correlations below and phenotypic correlations above diagonal.
In contrast, the alternative analysis (not shown) that included start weight as a covariate in the model for the other five traits, shows similar genetic correlations to a model without the covariate, but phenotypic correlations between footrot severity and weight loss are much stronger, confirming an important effect of footrot on weight loss. The phenotypic correlation between tmwe and tmfr of 0.89 after both have been adjusted for start weight, shows a strong dependency between timing of footrot and the maximum weight loss.
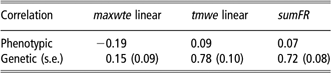
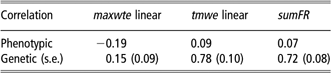
Phenotypic correlations (repeatabilities) across the two trials for weight loss and footrot scores were low (Table 9), as was the genetic correlation between maxwte in the two trials, although of opposite sign to the phenotypic correlation. In contrast the severity of footrot and the time of maximum weight loss in the two trials have highly positive genetic correlations, indicating environmental effects specific to each trial. Corresponding covariances are given in Table 1.3 of Appendix 1.
Phenotypic and genetic correlations between the same trait in the two trials, estimated in a model fitting start weight as a covariate
Discussion
This aim of this study was to estimate the effect of footrot on weight gain of affected animals, and to investigate the nature of the between-animal variation for this effect. A general approach was developed describing the relationship between disease and weight gain, and new traits were defined such as the maximum weight loss as a result of disease and the time after infection that this occurs.
The new trait of maximum weight effect was defined as the maximum weight loss of animals as a result of footrot. This trait required prediction of an animal’s weight had it not been affected, which was achieved by applying the growth curve of unaffected animals in the same flock and taking into account various effects that may affect growth, such as sex and age. The accuracy of this prediction is difficult to assess, but is likely to be better in the first trial as it was based on many more animals.
The weight of an affected animal is determined by the animal’s (unknown, but predicted) growth if it had remained healthy and the footrot effect, estimated as predicted growth − actual growth. Systematic errors may be introduced in the estimation of the footrot effect because healthy growth has an important genetic component, but is accounted for in the prediction by including an effect of start weight on growth. If the footrot effect for faster growing animals was still underestimated, this would lead to a negative correlation between healthy growth and the footrot effect, but the actual genetic correlations between gain over the trial and weight loss are highly positive.
Animals with average severity of footrot in trials 1 and 2 are predicted to suffer weight losses of 0.5 and 2.5 kg live weight, respectively, compared to uninfected animals. Animals subsequently regained most of the lost live weight later in the trials after they recovered from footrot. Weight loss, adjusted for the level of footrot, had a genetic component, with heritabilities of approximately 0.30 in trial 1 and 0.15 in trial 2. Although the two traits were similar in nature, the method of challenge, serogroup and virulence of challenge isolate and timing of challenge were different, and this may account for differences in relationship between weight gain and footrot.
For an average weight of animals around 30 kg, the weight loss estimated in this study is a much smaller percentage (2% to 8%) of live weight than found for other sheep diseases (Kirkwood, Reference Kirkwood1980; Coop et al., Reference Coop, Graham, Jackson, Wright and Angus1985; Pekelder, Reference Pekelder1994; Sargison et al., Reference Sargison, Scott, Penny and Pirie1995; Mackay et al., Reference Mackay, Betteridge, Devantier, Budding and Niezen1998). The effect is similar to a 6.7% reduction in lamb output due to footrot in ewes estimated from results presented by Symons (Reference Symons1978) but much lower than the 30% found by Stewart et al. (Reference Stewart, Clark and Jarrett1984). Costs of footrot to the British sheep industry estimated by Nieuwhof and Bishop (Reference Nieuwhof and Bishop2005) are based on extrapolating the average of results presented by Symons (Reference Symons1978) and Stewart et al. (Reference Stewart, Clark and Jarrett1984) to a weight effect, i.e. an 18% reduction in growth. Nieuwhof and Bishop (Reference Nieuwhof and Bishop2005) estimate the total costs of footrot at £24.4 M, of which only £1.5 M is due to reduced lamb growth so a reduction based on the current findings would have a little impact on the total. Both trials confirm findings by Marshall et al. (Reference Marshall, Walker, Cullis and Luff1991) that sheep eventually completely regain weight lost due to footrot, but in this experiment animals were treated by therapeutic vaccination rather than left untreated.
For the British meat sheep industry, the main costs of footrot are suffered therefore in adult ewes at times of mating, lambing and lactation. In wool sheep, such as the Merino in this study, footrot will also impact negatively on fleece weight and fleece quality, specifically staple strength, which is not recoverable (Symons, Reference Symons1978; Stewart et al., Reference Stewart, Clark and Jarrett1984).
In general terms, conclusions are similar for the two trials, which used the same animals, but there are differences in the size of the weight loss, the time frame and the heritability of weight loss and timing. While the trials differed in various aspects, including animal age, the method of infection and the time between infection and vaccination, it seems reasonable to assume that the previous infection affected the response of animals in the second trial. While the footrot scores across the two trials showed a high positive genetic correlation, this was not the case for the maximum weight effect. The animal’s response to subsequent infections should not therefore be regarded as repeat measures of the same trait.
Selection for higher weights at a given age and consequent higher mature weights, as practiced in most sheep breeding programmes, bears the risk, already established by Raadsma et al. (Reference Raadsma, Egerton, Wood, Kristo and Nicholas1994), that animals become more susceptible to footrot as a direct effect of weight. The current study shows that at a phenotypic level weight losses due to footrot also increase with severity (phenotypic correlations between maximum weight loss and the sum of footrot scores for example are −0.26 and −0.14 in trials 1 and 2, respectively), thus apparently compounding the negative effect of live weight on the animal’s performance. In contrast, the first trial shows that at the genetic level animals with a high breeding value for growth lose less weight (r g = 0.67), which may be indicative of their (genetic) ability to better cope with the disease. The effect was smaller in trial 2 (r g = 0.23).
Alternatively, selection for increased resistance to footrot may lead to lower weights, if footrot scores are not adjusted for live weight. In theory a selection programme could include weight loss due to footrot in order to identify the more resilient animals, i.e. those that do not lose weight while showing clinical signs of footrot. Estimation of weight loss is not practical, however, as it would require knowledge of the time of infection and frequent weighing. Selection on growth should to a large extent identify the same animals. The low repeatability of footrot scores across the two trials means that any selection programmes aiming to increase resistance to footrot through selection of resistant animals under natural challenges would benefit from repeated scoring of the same animals and use of information on relatives.
Acknowledgements
The authors are grateful to the large contribution by technical staff in the challenge and collection of data, in particular Craig Kristo, Dave Palmer, Marilyn Jones, Denise Wood, Gina Attard, Ron Henderson. The overall input by Prof John Egerton in design and conduct of the work is gratefully acknowledged. The work was supported in part with a grant from the then Australian Wool Research and Promotion (AWRAP) organization. The BBSRC contributed to inputs from G.J.N. and S.C.B.
Appendix 1. (Co)variance matrices
See Tables 1.1, 1.2, 1.3
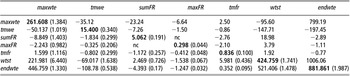
(Co)variances for weight and footrot traits including start weight and end weight in trial 1

maxwte and tmwe are based on the linear predictions of healthy growth. Genetic variances on, genetic covariances below and phenotypic covariances above diagonal. These figures correspond with the genetic parameters in Table 7.
nc = no convergence.
(Co)variances for weight and footrot traits including start weight in trial 2

maxwte and tmwe are based on the linear predictions of healthy growth. Genetic variances on, genetic covariances below and phenotypic covariances above diagonal. These figures correspond with the genetic parameters in Table 8.
Phenotypic and genetic covariances between the same trait in the two trials, estimated in a model fitting start weight as a covariate

These figures correspond with the genetic parameters in Table 9.