Introduction
The Sanjiang Plain is one of the most important commodity grain bases in China (Shi et al., Reference Shi, Chang, Wang, Li, Hu, Liu, Li, Li, Zong and Huang2020). The large-scale land reclamations in this region have mainly happened before 21st century; However, the cropping structures have still undergone significant changes every year recently due to the government's crop rotation project (Cai et al., Reference Cai, Li, Du and Xue2021) and soybean rejuvenation programme (e.g. rice-to-soybean conversion) (Lin, Reference Lin2023). Quantitative information about present interannual cropping structure changes is still limited. Despite some efforts in short-period annual crop mapping (You et al., Reference You, Dong, Huang, Du, Zhang, He, Yang, Di and Xiao2021), yearly-temporal and fine-spatial crop type maps during recent periods of dramatic planting structure alterations remain absent. Thus, it limits our understanding the ongoing process of farm trajectories and its related driving factors behind these dynamics in this region.
Remote sensing technology can provide information on cropping structure and its dynamics at regional and global scales (Zhang et al., Reference Zhang, Wu, Zeng, He, Liu, Tao, Zhang, Nabil, Tian and Bofana2021). Satellite data with low spatial (250 m–1 km) and high temporal (daily to monthly) resolution (i.e., MODIS and AVHRR) have been widely used for large-scale extraction of crop types (Wardlow et al., Reference Wardlow, Egbert and Kastens2007; Chen et al., Reference Chen, Lu, Moran, Batistella, Dutra, Sanches, Da Silva, Huang, Luiz and MaF2018). However, for smallholder farming, areas or regions with diverse cultivation structures or complex terrain regions, the ‘mixed pixel’ problems in satellite data with coarse spatial resolution lead to significant errors in crop mapping and even in production estimation due to heterogeneous agricultural landscapes (Hu et al., Reference Hu, Yin, Friedl, You, Li, Tang and W2021; Luo et al., Reference Luo, Zhang, Zhang, Han, Cao and Zhang2022). Public Free and open access to long time series of remote sensing data with medium to high spatial and temporal resolution offers new opportunities for large-scale crop mapping; Meanwhile, standardized and operational crop-classification platforms have been well established (Song et al., Reference Song, Huang, Hansen and Potapov2021). In particular, the dense time series of Landsat and Sentinel data (10-30 m) limit the mixed-pixel problems, and have been applied to map the precise annual spatial distribution of crops at the national and continental scales. For instance, the U.S. Department of Agriculture's (USDA) Cropland Data Layers (CDLs) are 30 m satellite imagery-derived crop-specific land cover maps across the conterminous United States. The CDLs are produced using multi-source satellite imagery (i.e., Landsat, Resourcesat, Sentinel, etc.), and have been annually updated since 2008. The CDLs include 110 land and crop classes with an average classification accuracy of over 90% (Boryan et al., Reference Boryan, Yang, Mueller and Craig2011). The Agriculture and Agri-Food Canada (AAFC) has generated the annual crop type digital maps in Canada since 2009, a decision tree based methodology was applied using optical (Landsat-5, AWiFS, DMC) and radar (Radarsat-2) based satellite images, and the overall accuracy is at least 85% (Fisette et al., Reference Fisette, Rollin, Aly, Campbell, Daneshfar, Filyer, Smith, Davidson, Shang and Jarvis2013; Amani et al., Reference Amani, Kakooei, Moghimi, Ghorbanian, Ranjgar, Mahdavi, Davidson, Fisette, Rollin and Brisco2020). Blickensdörfer et al. (Reference Blickensdörfer, Schwieder, Pflugmacher, Nendel, Erasmi and Hostert2022) combined the time series of Sentinel-1, Sentinel-2 and Landsat-8 data to map 24 agricultural land cover classes in Germany for the 3 consecutive years (2017, 2018 and 2019). For cross-national scales, under the support of the European Space Agency (ESA), the Sen2-Agri system allows for automated agricultural land cover maps derived from Sentinel-2 and Landsat-8 imagery at 10 m spatial resolution (Defourny et al., Reference Defourny, Bontemps, Bellemans, Cara, Dedieu, Guzzonato, Hagolle, Inglada, Nicola, Rabaute, Savinaud, Udroiu, Valero, Bégué, Dejoux, El Harti, Ezzahar, Kussul, Labbassi, Lebourgeois, Miao, Newby, Nyamugama, Salh, Shelestov, Simonneaux, Traore, Traore and Koetz2019). In addition, Luo et al. (Reference Luo, Zhang, Zhang, Han, Cao and Zhang2022) applied transductive transfer learning to process 130 000 Sentinel-2 images on the Google Earth Engine (GEE) platform, and generated the 10 m crop maps for four major crops across 10 European Union (EU) countries for 2018 and 2019. So far, systematic technical classification systems and platforms based on remote sensing data with medium and high spatial resolution have been established in Europe and America for regional crop mapping. These continuously improve the generation of annual crop data, which provide the necessary research basis for analysing the evolution of cropping structure at multi-spatial and temporal scales. However, in China, systematic, automated and wall-to-wall monitoring of the cropland mapping system has received less attention (You et al., Reference You, Dong, Huang, Du, Zhang, He, Yang, Di and Xiao2021); and current available high-resolution cropland data not only cover a limited number of crop types, but are also irregularly updated.
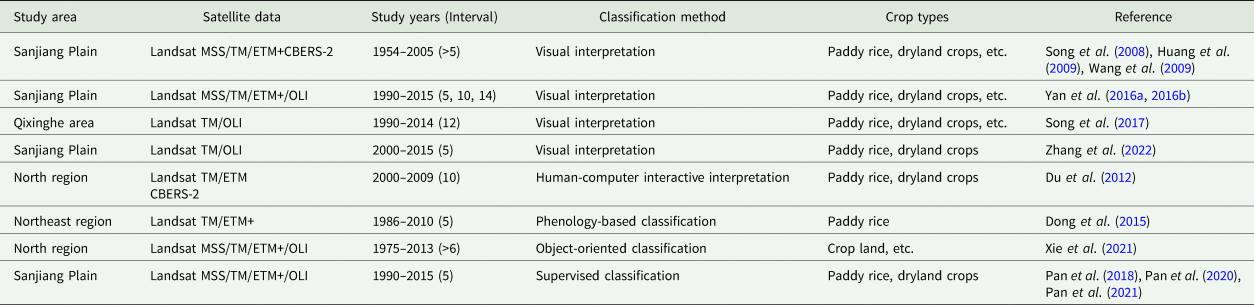
The Sanjiang Plain has experienced intensive land reclamations since 1950s. Even though the dynamic evolution of land cover in the Sanjiang Plain has been well studied, the up-to-date crop dynamics is unknown due to the unavailability of fine-scale and annual continuous cropland maps. The current study summarized the literatures on the spatial and temporal dynamics of cropland in the Sanjiang Plain in terms of remote sensing data, classification methods and time spans and intervals (Table 1). As for the data, the studies used remote sensing data with medium spatial resolution such as Landsat as the main data source. In terms of classification methods, visual image interpretation (Song et al., Reference Song, Liu, Wang, Zhang, Jin, Li and Liu2008, Reference Song, Yang, Gao and University2017; Wang et al., Reference Wang, Song, Liu, Zhang, Zhang, Li, Ren, Jin, Yang and Zhang2009; Yan et al., Reference Yan, Zhang, Kuang, Du, Chen, Liu, Yu and Yang2016a, Reference Yan, Zhang, Liu, Chen, Chen, Bu, Yang and Chang2016b; Zhang et al., Reference Zhang, Wang ZL, Du and Chen2022), supervised classification (Pan et al., Reference Pan, Zhang, Kuang, De Maeyer, Kurban, Hamdi and Du2018), phenology-based methods (Dong et al., Reference Dong, Xiao, Kou, Qin, Zhang, Li, Jin, Zhou, Wang and Biradar2015) or object-oriented approaches (Xie et al., Reference Xie, Sun, Liu, Ding and Lu2021) were used to map cropping patterns for individual years in the study area; For the study periods, the studies focused on the years before 2015; meanwhile, the time spans for quantifying the spatial and temporal dynamics of croplands were long (5–12 years). Crop cultivation in the Sanjiang Plain is intensive. Under the influence of temperature and precipitation, management policies, etc., annual fluctuation of crop planting structure is relatively significant. Therefore, it is urgent to establish high-resolution annual crop distribution datasets to update the continuous interannual cropland cultivation evolutions in the Sanjiang Plain in recent years. For this purpose, the specific objectives of the current study were to: (1) construct annual 30 m cropland data layers in the Sanjiang Plain from 2014 to 2020; (2) explore temporally high-frequency and spatially continuous dynamic change patterns of paddy rice and dryland crops.
Studies related to time-series geospatial datasets for croplands in the Sanjiang Plain

Materials and methods
Study area
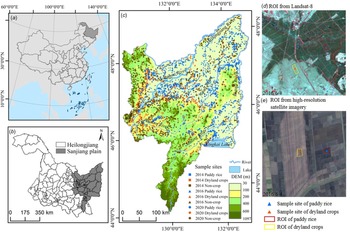
The Sanjiang Plain is located in northeastern Heilongjiang Province, China (43.834°N–48.411°N, 129.196°E–134.776°E) and covers a total area of 10.87 × 10⁴ km2 and 23 counties (Fig. 1). It is formed by the alluviation of Helongjiang, Songhuajiang and Wusulijiang rivers. The climate of this region varies between temperate humid and subhumid continental monsoon, with average temperatures below −18 °C in January and 21–22°C in July and average annual precipitation of 500–650 mm. The suitable climate, flat terrain, fertile soil and sufficient water resources offer the favourable optimal conditions for agricultural cultivation. Rice, maize and soybeans are the three major crops, which mainly distribute in the flatlands of the northeast, central and sourtheast Sanjiang Plain and present a mosaic spatial landscape (Yin et al., Reference Yin, You, Zhang, Huang and Dong2020). Paddy rice is irrigated, but other crops (such as corn and soybeans) are dryland crops (Fan et al., Reference Fan, Zhang, Chen and Chen2020). From 2003 to 2015, the total cultivation area of crops showed a fluctuating upward trend, and the total grain production increased continuously. In 2015, the sown area of three crops was about 96% of the Sanjiang Plain's total crop cultivation area, with corn accounting for 40%, rice 37% and soybeans 19% (Cai et al., Reference Cai, Li, Du and Xue2021).
Location of the Sanjiang Plain (a–b); Spatial distribution of validation sample sites in 2014/2016/2020 (c); Gound-reference ROI examples from Landsat-8 (d) and high-resolution images (e).

Data and preprocessing
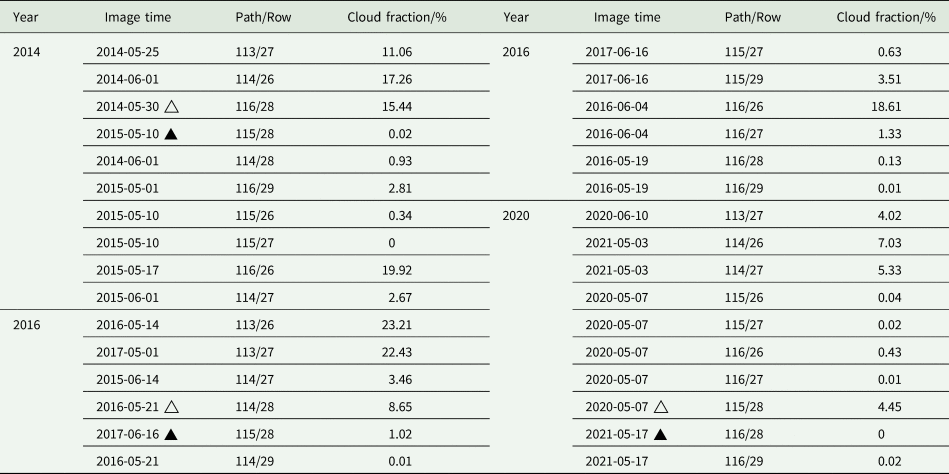
The datasets for the current study include: (1) Landsat-8 surface reflectance data were collected from 2014–2021, with a spatial resolution of 30 m and a temporal resolution of 16 days (Table 2). The satellite data covered the period from rice field flooding to rice sowing (late April to June) with a total of 32 image scenes. When the cloud cover of the images in 2014, 2016 and 2020 was more than 5%, cloud-free images from the same period of adjacent years were selected for cloud-mask replacement. Since the Landsat-8 surface reflectance data have been radiometrically and atmospherically corrected, the image preprocessing in the current study included projection transformation, coordinate matching, clipping and image mosaicing; (2) The 2015 Northeast China Land Use Data (NCLUD2015) was derived from Landsat-8 imagery using an object-oriented classification approach. The NCLUD2015 croplands include two types (paddy rice and dryland crops) with an overall accuracy of 94% (Mao et al., Reference Mao, Wang, Wu, Wu, Zeng, Song, Yi and Luo2018; Mao et al., Reference Mao, He, Wang, Tian, Xiang, Yu, Man, Jia, Ren and Zheng2019); (3) Then collected the 10 m crop data layer for northeast China (NCCDL10 m) developed by You et al. (Reference You, Dong, Huang, Du, Zhang, He, Yang, Di and Xiao2021). This dataset included 3 years of crop data layers during 2017–2019, which were produced using time-series Sentinel-2 imagery and random forest algorithm on the GEE platform. The dataset mapped 3 most popular crop types (corn, soybean and paddy rice) with an overall accuracy of 81%-86% over three years. To match with land use classification system of NCLUD2015, corn and soybean were combined as dryland crops. The NCLUD2015 and NCCDL10m datasets used different classification systems, which made the comparison difficult. The current work first aggregated these maps by reclassifying them using a unified legend system, which includes three land cover types: paddy rice, dryland crops and non-crop.
Landsat-8 surface reflectance data

Note: △ Images with cloud cover > 5%, ▴ images for cloud-covered area replacement. Other unlabelled images with more than 5% clouds will only use the cloud-free part of the image in the mosaic and clip.
Classification and validation of paddy rice and dryland crops
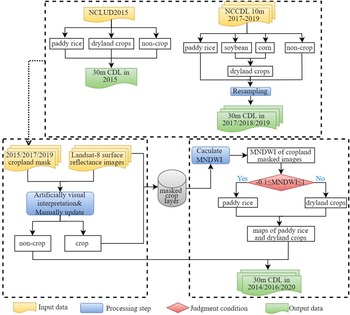
To construct a 30-m annual-continuous crop dataset of the Sanjiang Plain during 2014–2020, the current study collected four years of currently available cropland spatial datasets in 2015 and 2017–2019; the current work proposed a two-step conceptual framework of decision tree classification to generate crop data layers for the other three years of 2014, 2016 and 2020, based on the above cropland datasets and Landsat-8 satellite data as follows (Fig. 2):
-
Step 1 to generate crop and non-crop layers: the current study used the Landsat-8 colour composite images in 2014, 2016 and 2020 as ground truth, and manually updated the crop and non-crop boundaries of neighbouring years of 2015, 2017 and 2019 by visual interpretation methods;
-
Step 2 to identify paddy rice and dryland crops within crop layers using the decision rule of the Modified Normalized Difference Water Index (MNDWI) at the pixel scale: the rice fields of the Sanjiang Plain are flooded between late April and early May, and rice seedling transplantation begins in mid-May. From late April to mid-June, the rice fields show mixed spectral features of water and seedlings on the Landsat-8 images. Meanwhile, the dryland crop fields show a mixed spectrum of dry-bare soil and seedlings. Therefore, the current study calculated the MNDWI (Xu, Reference Xu2005) (Eqn (1)) from Landsat-8 image in the early phase of crop growing season to enhance the spectral differences between vegetation, water and dry-bare soil in the fields, and established a decision threshold rule to segment paddy rice and dryland crops (Eqn (2)).
(1)$${\rm MNDWI} = ( {\rho_{{\rm Green}}-\rho_{{\rm SWIR}2}} ) /( {\rho_{{\rm Green}} + \rho_{{\rm SWIR}2}} ) $$ (2)$${\rm MNDWI} = \left\{{\matrix{ {-0.1 \le {\rm MNDWI} \le 1, \;\,{\rm paddy}\,{\rm rice}} \cr {{\rm MNDWI} < -0.1, \;\,{\rm dry}\,{\rm land}\,{\rm crops}} \cr } } \right.$$


where ρ Green, ρ SWIR2 represent the Landsat-8 reflectance in the green band (0.53~0.59 μm) and shortwave infrared band (1.56–1.66 μm), respectively.
The conceptual framework of decision tree classification of 30 m annual crop data layers (CDLs) in the Sanjiang plain,during 2014–2020. NCLUD: Northeast China Land Use Data, NCCDL10 m: Northeast China Crop Data Layer.

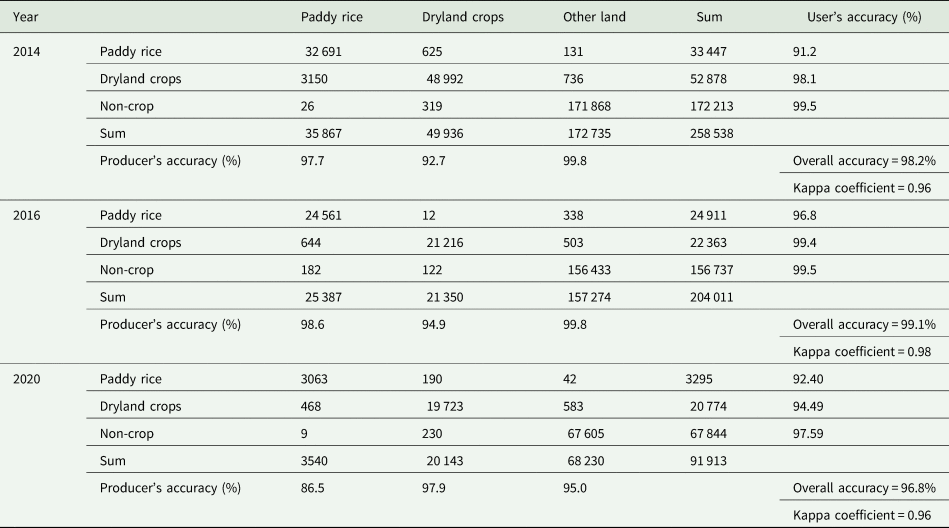
A pixel-wise validation was implemented to assess the accuracies of 2014/2016/2020 CDLs (Dong et al., Reference Dong, Xiao, Menarguez, Zhang, Qin, Thau, Biradar and Moore Iii2016). The current work used a stratified random sampling method to generate ground truth sampling sites across. First, the study region was divided into three zones (paddy rice, dryland crop, non-crop) based on the 2015/2017/2017 CDLs, and randomly settled 600 sampling sites for each zone (Fig. 1(c)). Then, created one region of interest (ROI) for each sampling site; with the high-resolution satellite imagery and Landsat-8 colour composite images as ground truth references, the current work visually interpreted the ground-truth land attribute and compared it with the classified land type on the 2014/2016/2020 CDLs for each ROI. Figures 1(d) and (e) show the ROI examples. Finally, five classification metrics (producer's accuracy, user's accuracy, overall accuracy and Kappa coefficients) were calculated from the confusion matrix to quantify the classification accuracies of 2014/2016/2020 CDLs. The calculation equations of classification metrics refer to Hao et al. (Reference Hao, Di, Zhang and Guo2020).
Annual spatio-temporal dynamics of paddy rice and dryland crops
Based on the annual crop layers of the Sanjiang Plain from 2014 to 2020, the current study quantified the changing magnitude and rate of cultivation area for paddy rice and dryland crops at the interannual scale. It also measured the spatial evolution of paddy rice and dryland crops in terms of spatial agglomeration and directionality by calculating the planted frequencies, changing trend of cultivated area and gravity migration at the pixel scale.
Temporal dynamic analysis
Area variation (Δs) and rate of variation (Δs′) were used to quantify interannual fluctuations of total planted area for paddy rice and dryland crops. Δs is the total area variation, and Δs′ is the area variation per unit area for paddy rice or dryland crops.

where S a, S b denote the total planted area of paddy rice (dryland crops) for the two adjacent years.
Spatial dynamic analysis
Frequency statistical analysis
The current work overlaid the annual 30 m CDLs during 2014–2020 at the pixel level, and generated frequency maps of paddy rice and dryland crops over the Sanjiang Plain. The frequency value, ranging from 1 to 7, stands for the number of years planted as paddy rice (dryland crops), and can represent the cropping intensity for the two crop types within the 7 years for each pixel. Then designated the pixels with the 6⩽ frequency ⩽7, 4⩽ frequency <6, and 1⩽ frequency <4 as continuous, stable, unstable cultivation, respectively. Note that unstable cultivated fields refer to the fields that might be under crop rotation, fallow or abandoned. Compared with the analysis of annual CDL maps, the frequency statistic maps can show the spatial distribution of paddy and dryland cropping landscape patterns and its temporal variation in an integrated manner.
Trend analysis
The current study calculated the area fraction percentage within 1 km × 1 km grids for the two crops. Area variation trend (slope) maps of crop planting area were generated at grid scales:

where slope is the linear-fitted slope of n years (n = 7); y is area fraction for paddy field (or dryland crops) within 1 km × 1 km grids; slope > 0 indicates that crop area shows increasing trend; otherwise, declining trend. The area change trend was further reclassified into five classes based on slope according to the following principles:

Gravity centre migration model
The gravity centre refers to a spatial mean centre of the area composed of paddy rice and dryland crops field patches. In the current study, the direction and distance of the gravity centre (X t, Y t) at different study nodes are obtained by the gravity centre migration model, in which the direction of gravity deviation indicates the ‘high density’ of the distribution of paddy rice and dryland crops, and the distance of deviation indicates the equilibrium of migration, thus quantitatively describing the directional characteristics of the spatial evolution of paddy rice and dryland crops:


where d is the migration distance between years (t + 1 and t, t = 2014–2020); (X i, Y i) and M it are the geographical centroid and area for each crop patch, respectively, n is the number of rice (dryland crops) patches.
Results
Remote sensing extraction of paddy rice and dryland crops in 2014, 2016 and 2020
The classification confusion matrix shows that the overall classification accuracies of crop data layers in 2014, 2016 and 2020 exceeded 96%, with the Kappa coefficient ranging from 0.96 to 0.98 (Table 3). MNDWI can effectively distinguish paddy rice from dryland crops, with over 90% accuracy. The average user and producer accuracy for paddy rice is 95% and 90%, respectively; and for dryland crops is 95% and 90%. The classification accuracies for non-crop are greater than 95%. Note that in the current study, satellite imagery from April to June were used to identify the flooding signal of paddy fields. The availability of imagery during the early rice growing season would affect classification results. For instance, if the date of image acquisition is earlier than the time of field flooding, the spectral signals of rice transplanting cannot be captured; therefore, the identification of paddy rice might fail. In addition, pixels along the boundary between rice fields and dryland crops are affected by the mixed spectrum problem, which reduces the robustness of the MNDWI segment threshold and leads to the classification errors of paddy rice. In Table 3, the omission errors of paddy rice in the confusion matrices are higher than those of other types: 8.85% (2014), 3.25% (2016) and 13.47% (2020).
Confusion matrix of cropland dataset of the Sanjiang Plain in 2014, 2016 and 2020. Map categories are rows while reference categories are columns. Map categories are rows while reference categories are columns

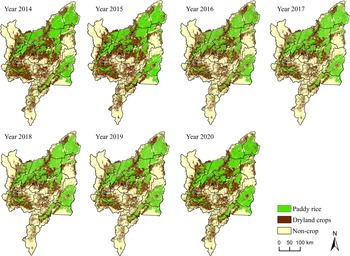
Figure 3 shows the annual spatial distribution of crop area for the Sanjiang Plain from 2014 to 2020. For 7 years in the Sanjiang Plain, croplands were the main land cover and consist of paddy rice and dryland crops fields, which distributed in the plain areas with low altitude and flat terrain. Paddy rice cultivation was more intensive, and mostly located in water-rich areas, such as the north counties including Fuyuan, Tongjiang, Suibin and Fujin and the south-east region-Hulin County. Note that there were spatial pattern fluctuations of paddy fields in some local areas among years. Especially, paddy rice showed significant expansion in the northeast of Huachuan and the Woken basin. The planting area of paddy rice in the eastern part of Raohe County declined slightly. The dryland crops were mainly located in the north-central counties (Jixian, Jiamusi and Baoqing) and also in the south-western regions (Huanan, Yilan and Boli). Compared to paddy rice, the landscape of dryland crops was more fragmented than paddy rice, and showed circular, striped distributions around the paddy patches. From 2014 to 2020, dryland crops cultivation tended to shrink in Jixian and Muling, and expand in northeastern Fuyuan and the eastern Raohe.
30 m annual crop data layers of the Sanjiang Plain in 2014–2020.

Annual temporal characteristics of paddy rice and dryland crops from 2014 to 2020
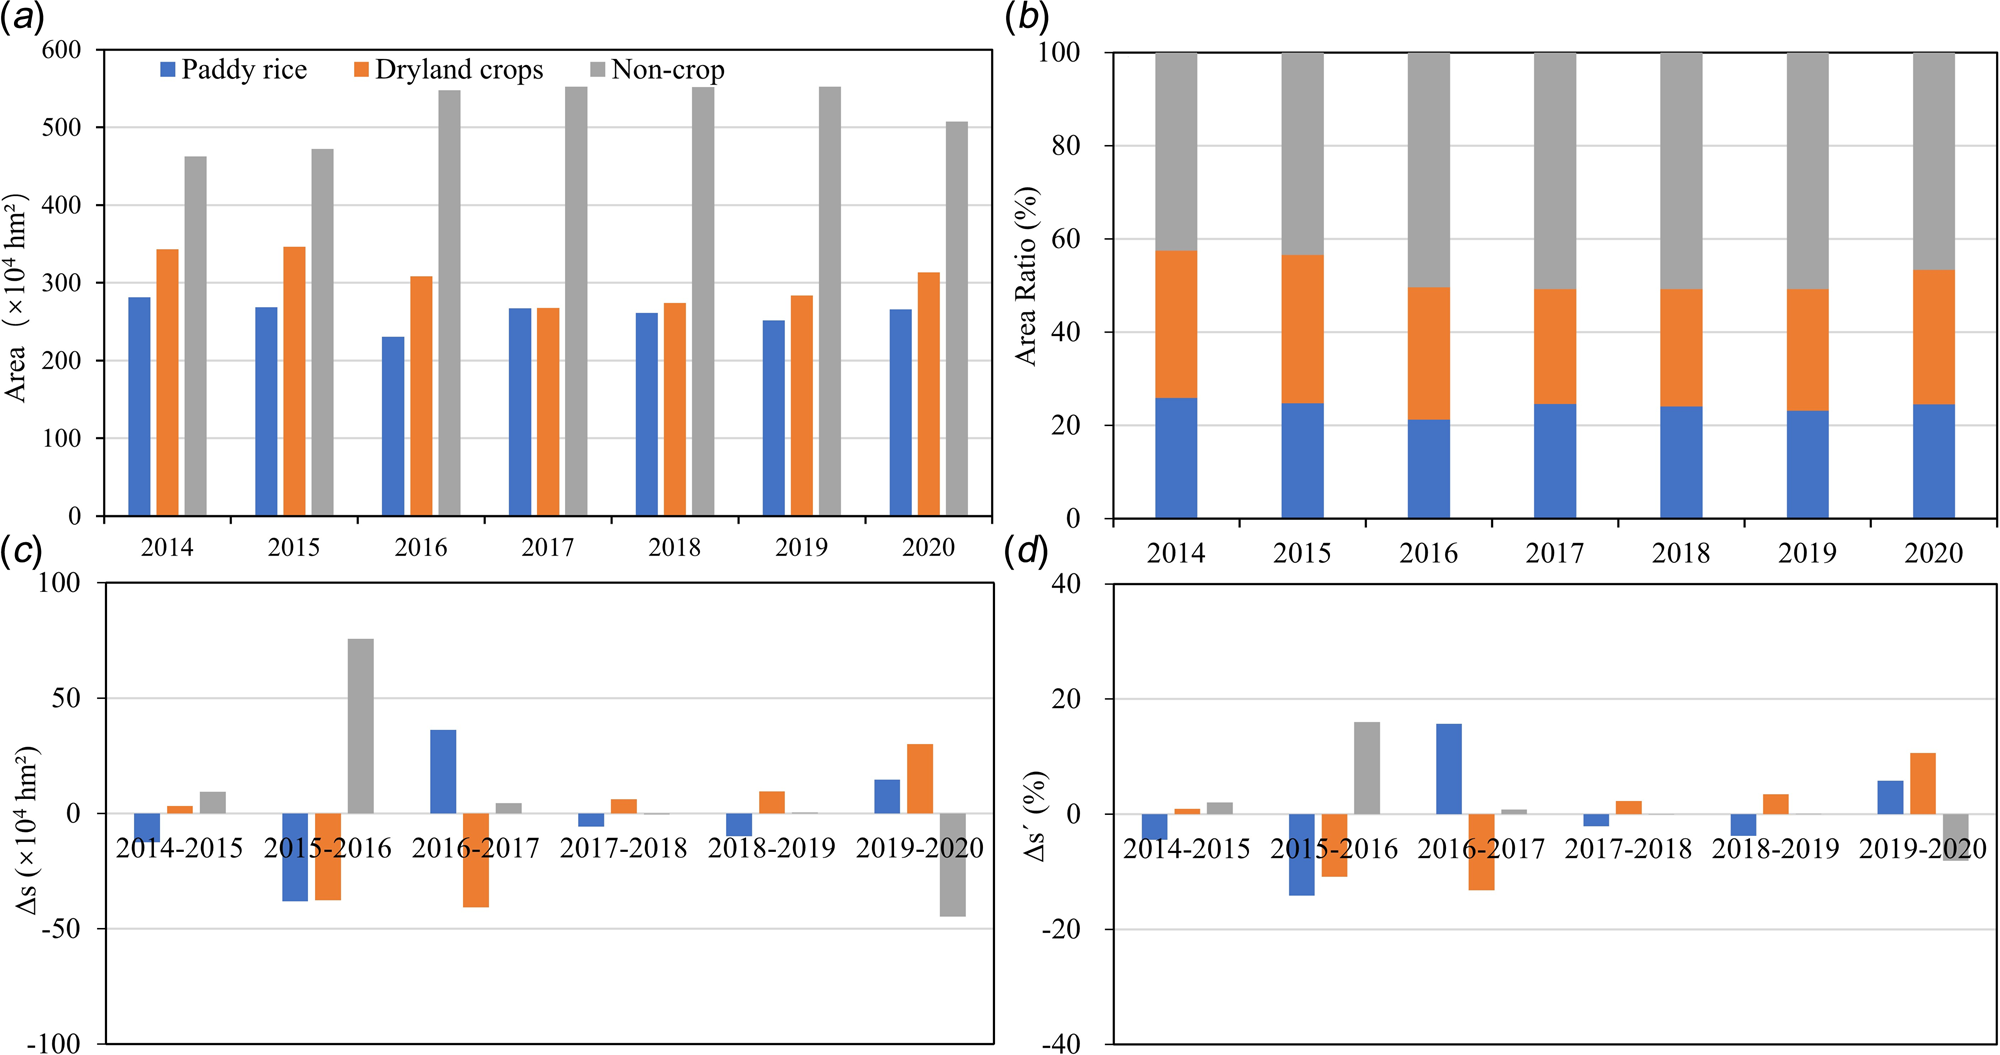
A comparative analysis of the annual area changes of crop layers during 2014–2020 can accurately demonstrate area variations in paddy rice and dryland crops on the temporal scale (Fig. 4). Cropland was the main land cover in the Sanjiang Plain, accounting for an annual average area percentage of 52 ± 3.4% (566 ± 36.9 × 10⁴ hm2). The annual average planting area of dryland crops (305.3 ± 29 × 104 hm2) was higher than that of paddy rice (260.9 ± 14 × 104 hm2); the area proportions for paddy rice and dryland crops were 21–25% and 25–32%, respectively (Fig. 4(b)). The total cropland area reduced from 624.4 × 10⁴ hm2 in 2014 to 580 × 104 hm2 in 2020, with a decrease of 15.3 × 10⁴ hm2, 29.4 × 10⁴ hm2 for paddy rice and dryland crops, respectively (Fig. 4(c)). Area variation between 2014–2017 for two croplands were greater than that between 2017–2020; The average absolute area changes in 2014–2017 for paddy rice and dryland crops were 29 × 104 hm2, 27 × 104 hm2, while in 2017–2020 they were 10 × 104 hm2 and 15 × 104 hm2, respectively. The unit area change (Δs ′) in paddy rice was −4.5% (2014–2015), −14.1% (2015–2016) and 15.7% (2016–2017), and remained relatively stable (−2.2–5.8%) in other years (Fig. 4(d)). Δs ′ for dryland crops decreased by 10.8% (2015–2016) and 13.2% (2016–2017) and increased slightly after 2017. Δs ′ values were of dryland crops were 2.3% (2017–2018), 3.5% (2018–2019) and 10.6% (2019–2020).
Statistics of annual area variation for paddy rice and dryland crops in the Sanjiang Plain, 2014–2020: Area (a), Area ratio (b), Area variation (Δs) (c) and rate of variation (Δs′) (d).

Annual spatial characteristics of paddy rice and dryland crops from 2014 to 2020
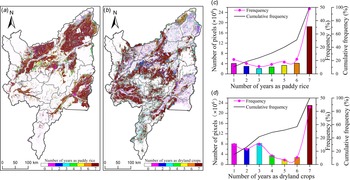
Figure 5 shows the statistics of planting frequency for two crops at pixel level. 77.5% of the Sanjiang Plain was once cultivated as cropland for at least one year in 2014–2020 (frequency⩾1), with 28.9% and 48.5% for paddy rice and dryland crops, respectively. The landscape pattern of core planting regions of paddy rice was clustered and kept stable over the years. The pixels planted more than 6-year paddy rice accounted for 60% of the total area, which was mainly located in northern counties, such as (Fuyuan, Tongjiang, Suibin and Fujin) (Fig. 5(a)). 24.2% of paddy rice was under 4-year planting frequency, mainly in Huachuan and Raohe. In contrast to paddy rice, the dryland crops cultivation was less stable with fragmented landscape patterns. 48% of the dryland crops have been cultivated for more than 6 years, mainly in the north-central (Fujin, Youyi, Jixian and Baoqing) and southwestern (Yilan, Huanan and Boli) counties (Fig. 5(b)). Compared to paddy rice, the spatial variation was greater in dryland crops with 41.8% planted less than 4 years. One part was scattered in the core area of paddy fields, the other part was located in Jixi and Muling counties with relatively concentrated and spatially coherent patterns.
Frequency statistic maps of paddy rice and dryland crops in the Sanjiang Plain, 2014–2020: frequency maps for paddy rice (a) and dryland crops (b); frequency histograms of paddy rice (c) and dryland crops (d).

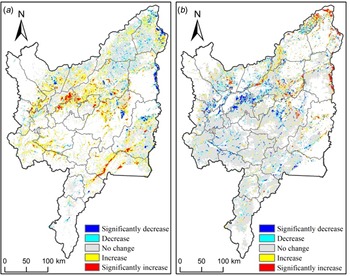
The current study calculated the trends of area change of two crops at 1 km × 1 km grids within 7 years. For both crops, the regions with an unchanged (Figs 6(a) and (b)) coincided with the areas where cultivation was frequent (Figs 5(a) and (b)). For paddy rice, the regions with significant increase and increase trends of planted area accounted for 4.2% and 22.3%, respectively; and significant decrease and decrease trends took up to 2.1% and 5.9%, respectively. As for dryland crops, the percentages of significant increase, increase, significant decrease and decrease were 2.5%, 7.0%, 5.7% and 3.5%, respectively. Note that the regions where paddy cultivation was increasing have a concurrent declining trend in dryland crops cultivation. These regions were mainly located along the water-rich counties, including Huachuan, west Fujin, north Youyi and the intersection of Yilan, Boli and Huanan. Meanwhile, the area with paddy rice cultivation decreasing also corresponded to the area with increasing tendency for dryland crops, with Fuyuan and eastern Raohe as typical regions.
Slopes of 7-year area percentage within 1 km × 1 km grids for paddy rice (a) and dryland crops (b) in the Sanjiang Plain, 2014–2020.

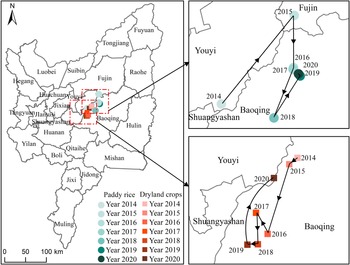
In 7 years, the centres of gravity for both crops mainly aggregated in the central counties of the Sanjiang Plain (Baoqing, Youyi and Fujin); however, the migration direction and magnitude of the centres of gravity varied from year to year (Fig. 7). Overall, the centre of gravity for paddy rice has shifted 31.8 km to the northeast between 2014 and 2020, while the centres of gravity for dryland crops moved to the opposite by 8.91 km to the southwest. There were significant differences in the migration trajectories of the two crops. The general trajectory direction of gravity centres of paddy rice was northeast→southwest→northeast, with a migration speed of 4.54 km/a. In 2014–2015, the migration distance of gravity centres for paddy rice was the largest, around 44.0 km across Youyi to Fujin counties. In 2015–2016, the centre of gravity for paddy rice moved to Baoqing, and then kept stable. The centres of gravity for dryland crops, in general, moved in the southwest→northeast direction, and the average migration speed was 1.27 km/a; Compared to the migration distances in other years (<10 km), the migration distance of dryland crops was greater in 2015–2016 and 2019–2020, 21.0 km toward the southwest and 20.6 km toward the northeast, respectively.
Trajectory of gravity centres for paddy rice and dryland crops in the Sanjiang Plain, 2014–2020.

Discussion
Since reclamation in 1954, the Sanjiang Plain has established large state-owned farms and has become an important base for food production in China. Although many studies have artificially interpreted satellite imagery to extract land cover information, and then analysed the spatial pattern evolution of croplands in the Sanjiang Plain, their study period was earlier (1954–2015); In addition, the time interval for quantifying changes in cropland was long. Influenced by a combination of natural and human factors, interannual spatial and temporal variations in cropping patterns of cropland are higher than for non-crop covers (such as built-ups and forests). High-quality, annually updated crop cover dataset can help accurately reflect the spatial distribution of crops, their cultivation structure and intra-annual dynamics. Meanwhile, it can optimize and improve the parameter inputs of modelling crop growth, irrigation, terrestrial ecosystem and improve model prediction accuracies. The visual interpretation method artificially digitizes cropland boundaries from false-colour composite satellite images based on differences in hue, shape, and texture between paddy fields and dryland crops. This method is laborious and its cost of generating annual crop data layers is high. Therefore, the frequency of updating the land cover dataset based on this method is at intervals of 5 years or more. Recent studies have proposed a single phenology-phase mapping algorithm for paddy rice in the Sanjiang Plain based on the relationship between Enhanced Vegetation Index (EVI) and Land Surface Water Index (LSWI) during the transplanting period of rice seedlings. Compared to the visual interpretation approach, these automatic computer recognition algorithms are simpler with less labour and time costs, and higher classification accuracy of paddy rice in the Sanjiang Plain. The users' and producers' accuracies were about 90–97% and 91–94%, respectively (Dong et al., Reference Dong, Xiao, Kou, Qin, Zhang, Li, Jin, Zhou, Wang and Biradar2015; Qin et al., Reference Qin, Xiao, Dong, Zhou, Zhu, Zhang, Du, Jin, Kou and Wang2015; Jin et al., Reference Jin, Xiao, Dong, Qin and Wang2016). To investigate the recent spatial and temporal changes of cropland in the Sanjiang Plain, the current study collected the cropland datasets of 2015, 2017 and 2019 and updated the cropland boundaries in 2014, 2016 and 2020 from the cropland data of 2015, 2017 and 2019 using false-colour composite satellite imagery; Then, the paddy fields were derived from cropland by setting the thresholds for segmentation of MNDWI in the early cropping season, and built the annual crop layer datasets from 2014 to 2020, whose accuracy (90–95%) is comparable to the accuracy of the previous cropland datasets. Therefore, the current study improves the classification efficiency of croplands while ensuring the classification accuracy of paddy rice and dryland crops.
The early land cover changes of the Sanjiang Plain and the associated environmental effects have received widespread attention, which mainly focused on 1954–2015 (Zhou et al., Reference Zhou, Gong, Wang, Khan and Zhao2009; Song et al., Reference Song, Wang, Du, Liu, Zeng and Ren2014; Yan and Zhang, Reference Yan and Zhang2019). Studies show that since 1949, with the increase in food demand and population growth, the Sanjiang Plain has experienced the reclamation of natural vegetation (wetlands and grasslands) to cropland and the large-scale conversion of dryland crops to paddy fields, which is called the rapid agricultural development period (Wang et al., Reference Wang, Song, Ma, Ren, Zhang, Liu, Chen and Song2011); Until the beginning of the 21st century, the ecological environment was severely threatened by the rapid expansion of cultivated land. Wetland protection policies such as wetland restoration, have slowed the expansion of cropland to some degree (Wang et al., Reference Wang, Zhang, Zhang, Li, Liu, Song, Li, Li and Duan2006; Liu et al., Reference Liu, Sheng, Lu and Liu2015). A highly intensive pattern of agricultural land use emerged in the 2005–2015 period. For instance, paddy rice was large-scale mechanized cultivated, while the landscape patterns of dryland crops were fragmented. The cropland unsuitable for cultivation was restored as wetland (grassland or forest), and wetlands showed a marked decline in reclamation rates (Wang et al., Reference Wang, Jiang, Wang and Xue2019; Xiang et al., Reference Xiang, Wang, Mao, Zhang, Xi, Du and Zhang2020). To follow up on previous studies, it was found that despite the cultivation structure and spatial pattern of croplands were relatively stable during 2014–2020, the cultivated area of paddy rice and dryland crops showed a slight overall declining trend with positive and negative interannual fluctuations. Natural environmental and socioeconomic factors are the main drivers causing the changes in cropping patterns in the Sanjiang Plain. Natural factors such as climate, topography and hydrologic conditions directly determine the overall spatial suitability of regional crop planting, with little short-term variation; Unlike natural factors, socioeconomic backgrounds, including market demand, economic efficiency, agricultural macro-control and resource and environmental protection policies, are highly volatile and have rapid and significant effects on short-term changes in agricultural cropping patterns (Chen et al., Reference Chen, Meng, Yu and Tan2022), and are the main factors contributing to the interannual variation in cropping patterns of two croplands in the current study. Under market economy, farmers' production decisions are driven by market efficiency (i.e., planting production costs and returns are related), which in turn determine the agricultural planting structure. The purchase price of rice in Heilongjiang Province was reduced from RMB 3.0/kg in 2017 to RMB 2.6/kg in 2018, and this price remained until 2021. Meanwhile, the cost of agricultural inputs has been considerable, the cost of planting and harvesting rice has increased by years, and the land rent for rice cultivation has also increased. According to the law of diminishing land returns, paddy rice cultivation with less economic benefits is reduced, and some rice planting areas are replaced by dryland crops with better economic returns. Strengthened by the policy guidance in recent years, Heilongjiang Province optimized the regional agricultural cultivation structure and proposed to appropriately reduce the cultivation of paddy rice in the areas of the Sanjiang Plain with inferior and inefficient soils and in the areas with excessive groundwater exploitation, and advocated corn-soybean rotation, and appropriately expanded soybean cultivation. The interannual variation in the gravity centre of paddy rice and dryland crops in the Sanjiang Plain is mainly driven by human-led land use behaviour. From 2014 to 2015, the gravity centre of paddy rice and dryland crops migrated to the northeast, mainly due to the expansion of paddy rice in Fuyuan and Tongjiang in the north during this period. During the period 2015–2018, the gravity centre of paddy rice moved southwards, mainly because some counties in the southwestern of the Sanjiang Plain (e.g. Huachuan) were affected by the low efficiency of paddy rice and government regulation, and vigorously promoted the ‘dryland crops convert to paddy rice’ in order to adjust the cropland cultivation pattern. In addition, benefiting from the vigorous development of water conservancy projects during this period, the increase in the cultivation of paddy fields in the southern Muling and Umken river basins contributed to the southward migration of the gravity centre of paddy field cultivation. Since 2018, in order to curb groundwater over-exploitation in the Sanjiang Plain to ensure the sustainable development of agriculture (Li et al., Reference Li, Tian, Luo, Dong, Cui and Khan2021), Heilongjiang Province has focused on the pilot work of fallowing paddy fields in the southern part of the Sanjiang Plain (Chong et al., Reference Chong, Liu, Qiang, Guan, Qiang, Zhang and Kong2020), of which the fallowed paddy fields in Hulin and Baoqing have contributed to the northward migration of the gravity centre of paddy field cultivation. The gravity centre of dryland crops showed a continuous southward migration from 2014 to 2019, which was also influenced by the policy of vigorously promoting the ‘dryland crops convert to paddy rice’ in some counties in the southwestern part of the Sanjiang Plain, as mentioned above, In addition, the economic development of the southern of Heilongjiang Province (Mudanjiang) during this period was accompanied by the expansion of dryland fields in accordance with the principle of ‘balance of occupation’, which also led to a significant migration in the centre of gravity of dryland fields southwards. In 2019–2020, the centre of gravity of the dryland crops moved towards the northeast, due to the impact of the national policy of subsidizing dryland crops and the ‘paddy rice to dryland crops’ in the eastern of Sanjiang plain (Hulin city).
The current study relied on available land cover products and satellite images during the early cropping season to create 3-period 30 m crop layers through a combination of visual interpretation and threshold segmentation. Although the classification strategy in the current study can separate paddy rice from dryland crops quickly and with satisfactory classification accuracy, classification efficiency is limited by the effort required to update cropland boundaries; secondly, the seven crop datasets were derived from three different classification strategies, leading to inconsistent classification system errors across the datasets, reducing their comparability and increasing uncertainties in interannual spatiotemporal dynamic analysis of two croplands. In the future, under the background to optimize regional crop planting patterns, frequent crop rotations (e.g., rice to soybean and corn-soybean rotation) will urgently require agricultural land datasets covering more crop types. With the support of cloud computing platform for remote sensing big data (e.g., GEE, PIE- Engine) and very high-resolution satellite data, a standardized and operational production and assessment systems for regional crop datasets need future efforts.
Conclusions
The current study established the annual 30 m crop datasets for 2014–2020. It explained the spatial distribution characteristics of crop cultivation of the Sanjiang Plain in recent years, and investigated spatio-temporal dynamic process of the regional crop cultivation structure. The classification strategy proposed in the study can effectively constructed high-quality spatial datasets for croplands. Even though the total planted area of both crop declined slightly from 2014 to 2020, it shows obvious interannual variations in total area, cropping frequency, area change trend and trajectories of centres of gravity along continuous years. The current study theoretically highlight key aspects that have been neglected in studies of monitoring land cover change monitoring, that is, quantifying the annual process of land cover change is more important than describing its initial and final status. In terms of practical applications, these results also provide fundamental scientific insights for optimal regulation of regional agricultural resources, sustainable use of cropland and ensuring food security.
Author contributions
J. C. and Z. ZY. conceived and designed the study. Z. ZY., C. G. and L. XT. contributed to the remote sensing data collection and classification. J. C. and Z. ZY. drafted the manuscript, revised the manuscript and approved the final version. L. XM. and C. HY. contributed to the revision of the final version. All authors read and approved the final manuscript.
Financial support
The authors are very grateful for funding provided through the Research Foundation of Education Bureau of Liaoning Province, China (grant no. LJKMZ20221414), the National Natural Science Foundation of China (grant no.41801340), and the National key research and development programme of China (grant no. 2021YFD1500101).
Conflict of interest
The authors declare there are no conflicts of interest.
Ethical standards
Not applicable.